Article Text

Abstract
Oligonucleotide array based analysis was conducted to examine the temporal pattern of gene expression across the various stages of lung development to identify regulatory pathways at key developmental time points. Whole embryo total RNA or embryonic lung total RNA was harvested from A/J mice at seven developmental stages. To investigate changes in gene expression during lung development, four samples from each stage were examined using Affymetrix U74Av2 murine oligonucleotide microarrays. From the over 12 000 genes and ESTs represented on the array, 1346 genes and ESTs were identified as having a significant change in expression between at least one time point and the others (p<0.001, Kruskal-Wallis test). Within this group of ∼1300 genes, four patterns of expression were seen: (1) upregulation during the embryonic period of development (up-down); (2) upregulation during the postnatal period of lung development (down-up) and (3) fluctuating expression, up initially, down for one or more time points, and then up again (up-down-up); and (4) vice versa (down-up-down). Expression patterns of genes previously reported to be involved in pulmonary development were also examined. Using the pathway visualisation tool, GenMapp, at least three regulatory pathways were found to contain clusters of differentially expressed genes: Wnt signalling, cell cycle, and apoptosis. Furthermore, we have shown that many of the genes involved in lung development are either known oncogenes or tumour suppressor genes altered in lung cancer, such as Cyr61, Rassf1a, and Dutt1/Robo1, or putative lung cancer genes. In addition, the genes identified pertinent to early development may also serve as candidate susceptibility genes for various inherited lung cancer disorders as well as for various heritable disorders of lung development. These results will contribute to our understanding of novel aspects of the regulatory machinery for embryonic lung development and of the genes involved in lung tumorigenesis.
- development
- expression signatures
- lung
- microarray
Statistics from Altmetric.com
Mammalian lung development comprises six stages: embryonic, pseudoglandular, canalicular, saccular, alveolar, and maturation of the microvasculature.1 The embryonic stage begins around 9.5 days post coitum (dpc) with the budding of the primitive lung mass from the ventral gut epithelium, accompanied by septation from the oesophagus.2 The lung bud then forms the preliminary trachea and pulmonary bronchi by 12 dpc, forming the single left lung lobe and the four lobes of the right lung.3 Expansion of the bronchial tree, including formation of the bronchi and bronchioles, occurs during the pseudoglandular phase (14.5-16.5 dpc). Also during this phase, epithelial cells differentiate to begin to form the prealveolar saccules. The cell mass comprising the prealveolar sacs expands exponentially during the canalicular period (16.5-17.5 dpc), with septation into alveoli continuing through birth and until maturation of the adult lung. The pulmonary vasculature constantly remodels as the lung structures expand and differentiate. Vasculature remodelling continues throughout the lung development process, not being complete until lung maturation.
The intricate formation of the lung requires precise regulation of a host of transcription factors, growth factors, and structural proteins. Several transcription factor-gene interactions have been reported to be involved in lung development. As shown in fig 1, factors such as thyroid transcription factor-1 (TTF-1) are involved in several stages of development, interacting with different targets at different stages. Activation of lung specific transcription factors at certain time points is known but their targets are often unidentified, as in the case of TTF-1 during the canalicular and saccular-alveolar and adult stages.4 HNF-3, both alpha and beta forms, also play an important role in the differentiation of lung tissues but their exact targets are unknown. HNF-3β appears to influence the transcription of various other lung epithelium restricted genes such as TTF-1.5 The role of extracellular matrix in lung development has also been examined to profile murine lung development.6 Although gene expression patterns in lung development have been reported for selected sets of genes,6 this is the first report of detecting specific regulatory pathways on a transcriptome wide basis.
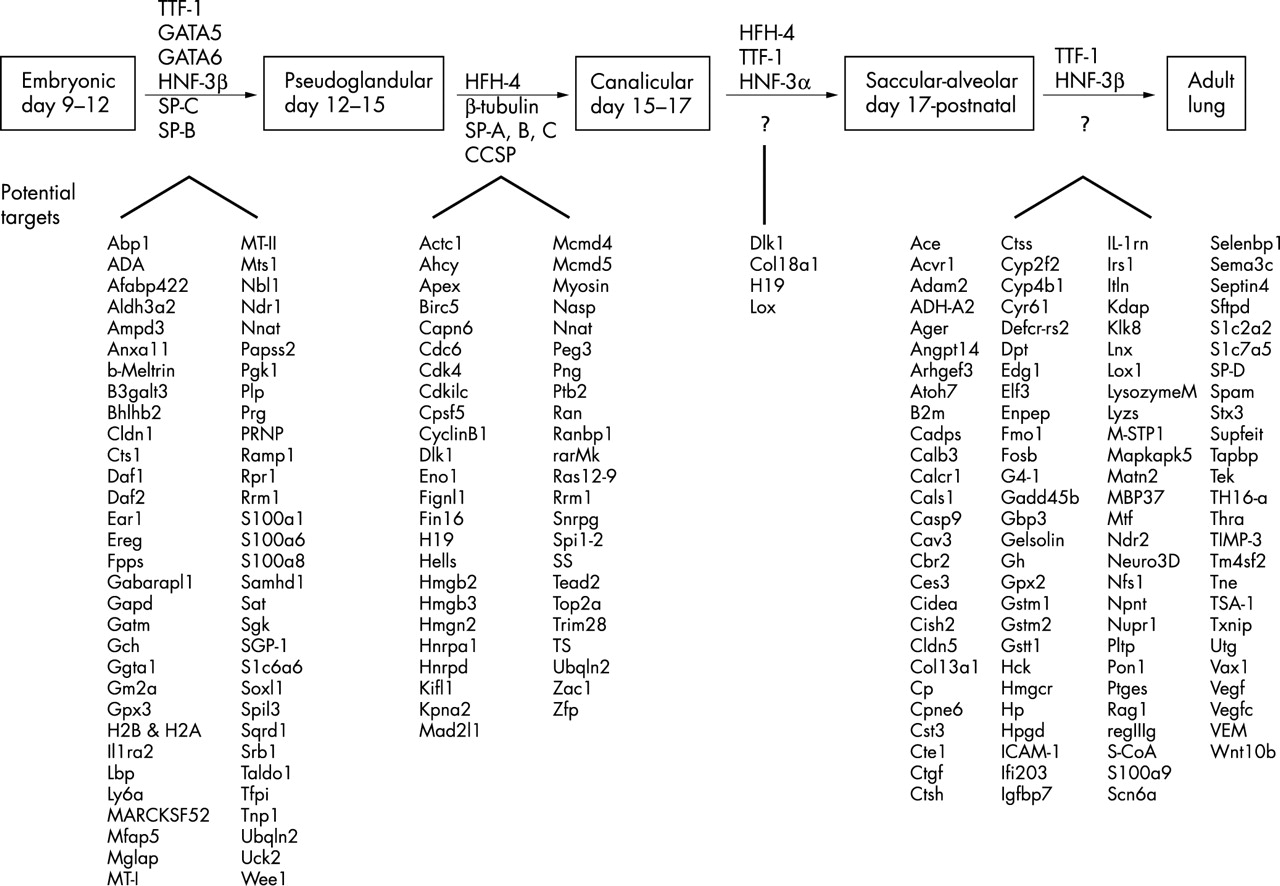
Transcription factors and their targets involved in embryonic lung development. Previously described transcription factors appear above arrows. Candidate target genes appear below arrows. Potential target genes identified in this study are indicated below the large carets.
While there are several factors whose direct involvement in pulmonary development have been documented, the scope of their involvement is not clear at present. The targets of these transcription factors and the regulatory molecules controlling their transcription are unknown. In some cases, cell type specific expression has been described but precise temporal regulation has not been described. The abundance of cell types and tissue remodelling that occurs throughout lung development processes may require currently unidentified regulatory elements, transcription factors, and growth factor receptors.
Here, transcriptome wide analysis of gene expression was performed at seven stages of lung development using oligonucleotide microarrays. Using arrays representing over 12 000 genes and ESTs facilitated the identification of genes or pathways not currently known to be involved in lung development and provided confirmation of genes and pathways currently considered to be involved. Selected genes were further confirmed by real time PCR assays. As a result, association of a series of novel transcription factors, target genes, temporal regulation, and candidate regulatory pathways was observed during lung development. These results should lead to future studies of novel temporal interactions between candidate transcription factors and their targets, which may help to uncover new mechanisms driving lung development.
METHODS
Collection of lung tissue
Pregnant A/J mice (Jackson Laboratories) were sacrificed at days 9.5 dpc, 14.5 dpc, and 17.5 dpc. Entire 9.5 dpc embryos were collected as were lungs only from 14.5 dpc and 17.5 dpc embryos. At birth, and at one, two, and four weeks after birth, lungs were also collected from A/J mice. The entire embryo (9.5 dpc) or lung tissue (14.5 dpc, 17.5 dpc, NB, 1 w, 2 w, 4 w) was processed for total RNA with TRIzol RNA isolation reagent (Life Technologies). Four samples per time point were processed for total RNA. However, for the 14.5 dpc time point, the RNA from 10 lungs was pooled to make the sufficient RNA for one sample; because of the small size of the tissue collected, lungs were pooled to make sure that there was enough RNA for analysis. Thus, four samples for the 14.5 dpc time point means 40 lungs were used. Mice were kept in sterile conditions at a temperature of 22±1°C. They were fed Rodent Lab Chow (5001, Purina) and water ad libitum.
RNA amplification
Total cellular RNA was collected from each of the seven time points. Total RNA was purified with a Qiagen RNeasy Mini kit (Cat ID 74104). In vitro transcription based RNA amplification was then performed on each sample. cDNA was synthesised using the T7-(dT)24 primer: 5‘-GGCCAGTGAATTGTAATACGA CT-CACTATAGGGAGGCGG-(dT)24-3‘. The cDNA was cleaned using phase lock gel (Fisher Cat ID E0032005101) phenol/chloroform extraction. After purification, in vitro transcription labelling was performed using the Enzo “Bioarray Kit” (Affymetrix, Cat ID 900182). The resulting cRNA was purified, again using the Qiagen RNeasy Mini kit.
Affymetrix GeneChip probe array
Affymetrix Mu74Av2 GeneChips, encompassing >12 000 genes and ESTs on one array were processed according to the manufacturer’s recommendations. Every gene or EST is represented by a probe set consisting of approximately 16 probe pairs (oligonucleotides) of 25mer oligonucleotides. One sequence of a probe pair represents the complementary strand of the target sequence while the other has a 1 bp mismatch at the central base pair position. This mismatch sequence serves as an internal control for specificity of hybridisation. Removed from the list of genes in fig 2 are those probe sets with negative expression values.
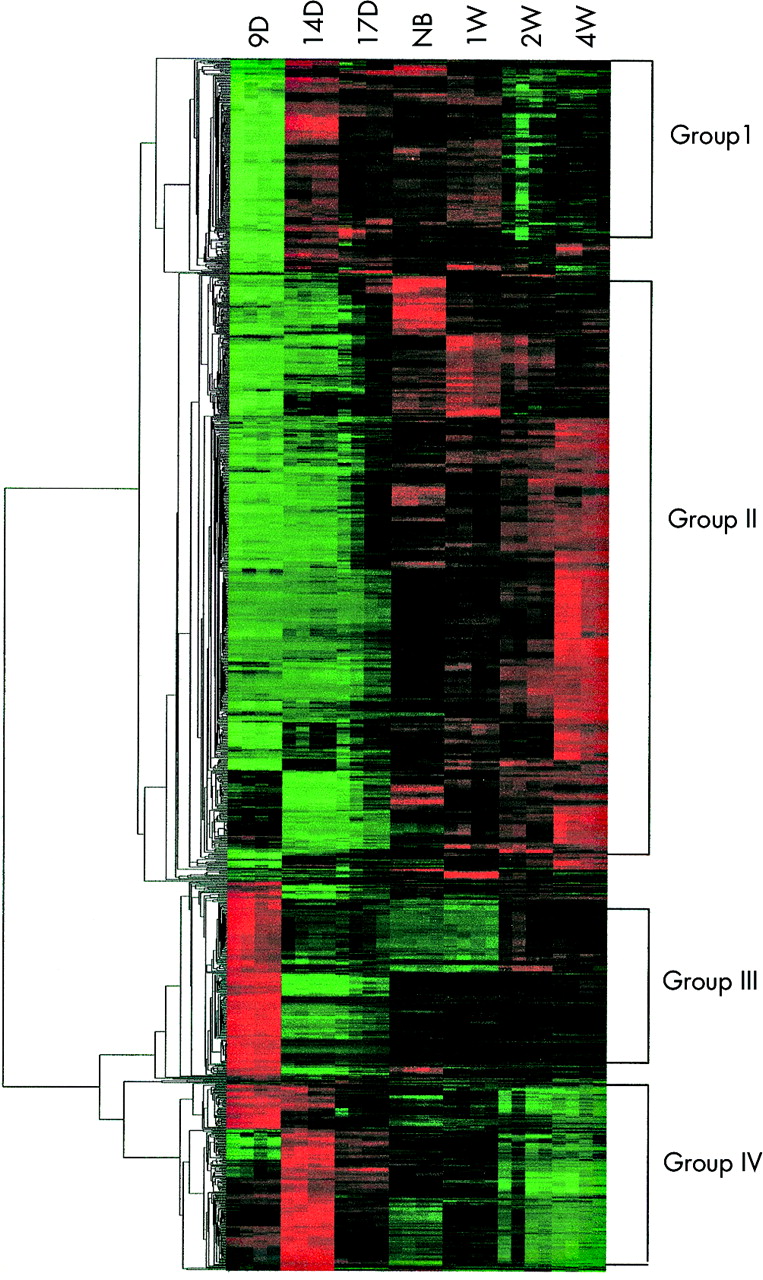
Hierarchical clustering of 1346 genes and ESTs found to be differentially expressed for at least one time point (p<0.001, Kruskal-Wallis test). The columns represent the various time points examined whereas the genes and their expression values are displayed in rows. Expression levels for each gene were transformed across samples using a normal (0,1) transformation. Green indicates an expression below the mean value for the gene, black near the mean, and red above the mean. Expression pattern grouping is to the right of the figure and clustering to the left.
Statistical analysis
Estimation of gene expression
Four independent samples were collected per time point. Analysis was performed using a three stage procedure previously described.21 Briefly, stages consisted of (1) array normalisation, (2) estimation of gene expression, and (3) statistical testing. To make arrays comparable, raw intensity values within CEL files were normalised via regression as follows. A pseudoarray was produced, consisting of the median spot intensity determined across all arrays for all spots. Each real array was quadratically regressed against this median pseudoarray. Resulting scaled CEL files were used to estimate gene expression according to the full model index of Li and Wong20 (LWF), which was recently shown by Lemon et al22 to be superior to both the Li-Wong reduced model and Affymetrix average difference. Genes with negative expression indexes were removed.
Statistical testing
Kruskal-Wallis testing was performed to identify genes which were differentially expressed during at least one time point according to a cut off of p<0.001. Genes passing this filter were allocated to four mutually exclusive groups according to their expression pattern, with some genes not assigned to any specific group. Ratios of average expression were computed by first averaging expression indexes within experimental groups, then dividing the averages as specified by the contrast. For example, a prenatal/postnatal ratio would have all the prenatal samples averaged, the postnatal samples averaged, and the ratio of the averages determined. Hierarchical clustering was performed as follows. Genes were selected according to criteria described in the text. For the selected genes, expression indexes were transformed across samples to a N(0,1) distribution using a standard statistical Z transform. These values were input to the GeneCluster program of Eisen et al23 and genes were clustered using average linkage and correlation dissimilarity.
GenMAPP
Signal transduction pathways, metabolic pathways, and other functional groupings of genes were evaluated for differential regulation using the visualisation tool GenMAPP (UCSF).8 GenMAPP is a recently reported tool for visualising expression data in the context of biological pathways.8 We imported the statistical results of our data set into the program and used GenMAPP to illustrate pathways containing differentially expressed genes. Differential gene expression was based on prenatal versus postnatal expression change (two-fold and p<0.05, t test).
Real time RT-PCR
Synthesis of cDNA
Two micrograms of total RNA per sample, collected as described above, were converted to cDNA using the SuperScript First-Strand Synthesis system for rt-PCR (Invitrogen, Cat No 11904-018). It is important to note that the total RNA used for the purposes of real time PCR were from the exact same samples as those described in the microarray analysis section of the methods. We chose to use the same RNA in order to cut down on sample variation that could occur if RNA was recollected. The primer used to generate cDNA was the same as that used to generate cDNA for the oligonucleotide array assay (T7- (dT)24 primer: 5‘-GGCCAGTGAATTGTAATACG ACTCACTATAGGGAGGCGG-(dT)24-3‘).
Real time PCR
The real time PCR assay was performed using the LightCycler-FastStart DNA Master SYBR Green 1 kit (Roche Cat No 3003230). The following primers were used to amplify the genes of interest: Angiomodulin/Igfbp7 F-CAAGGTCCTTCCAT AGTGACG, R-TCAGGCAAGAGCAGGGTTAT; Aquaporin 1 F-TCAAACCACTGGATTTTCTGG, R-TGGGTCCCTCACTTTCA CTC; Calcyclin/s100a6 F-ACCGTGCGCTTCTTCTAGC, R-CTG GATTTGACCGAGAGAGG; Carbonyl Reductase 2 F-GGA ACTAGGGCCACACAAGA, R-ATGAGCCCAACAAAGTGGAC; Kruppel-like factor 4 F-ACTCACACAGGCGAGAAACC, R-CAGACCCCATCTGTTCTGTG; Math5/atoh7 F-ATGAAGTC GGCCTGCAAAC, R-CCCATAGGGCTCAGGGTCTA; NeuroD3 F-GAGGCTCTGCTGCACTCC, R-GAAAGGAGAAAAGGGGA TCG; Surfactant C F-TATGACTACCAGCGGCTCCT, R-GCCCGTAGGAGAGACACCTT; TEA domain FM 2 F-AGACGCAGTTGACTCGTTCC, R-GCAGCAGACGGTACAC AAAG. Two μl of cDNA was added to a 20 μl total volume reaction mixture containing water, MgCl, FastStart master mix, and primers. Each real time assay was performed in duplicate. Data were collected and analysed on the Biorad iCycler version 2.033. GAPDH (primers: F-TGGAGAAACCTGCCAAGTATG, R-GTGGGTGCAGCGAACTTTAT) was used as an internal standard. The GAPDH value, a reflection of the number of cycles needed to reach a threshold of fluorescence, was subtracted from the cycle value for the individual gene whose expression was being assessed. For the calculation of the fold changes over time, the four week expression value (adult lung) was used as the control expression value. All other time points were divided by the four week value and the expression was displayed as a fold change relative to expression of an adult A/J mouse.
RESULTS AND DISCUSSION
The experimental design of this study includes the use of lung tissues from seven key developmental time points. We harvested whole embryos at 9.5 dpc, lungs from embryos at 14.5 dpc and 17.5 dpc as well as mice at newborn (NB), 1 week (1 w), 2 weeks (2 w), 3 weeks (3 w), and 4 weeks (4 w) of age from A/J mice and the RNA from each tissue was extracted. The gene expression from the use of entire embryos at days 9.5 dpc represents not only lung tissue but also a variety of different types of tissues/cells. Total RNA was converted to cRNA for hybridisation to Affymetrix Murine U74Av2 GeneChips. Four samples per time point were analysed for statistical significance. Kruskal-Wallis statistical analysis of the normalised expression data showed 1346 genes, expressed sequence tags (ESTs), and RIKEN sequences with a p<0.001. Fig 2 displays expression patterns for these genes with the genes hierarchically clustered and the tissue samples ordered by developmental stages. Clustering shows four major patterns: group 1, group 2, group 3, and group 4. Group I includes genes that are downregulated during early organogenesis (9.5 dpc), upregulated during lung expansion and differentiation, and downregulated again during lung maturation. Group II consists of genes whose expression patterns are low during the entire embryonic period of lung development and then increase during alveolarisation and lung maturation. Group III is a smaller group consisting of genes highly expressed during organogenesis, drastically downregulated during branching and lung bud expansion, and then upregulated once more postnatally. Group IV consists of genes with moderate to high expression levels during organogenesis and branching, which then reduce to low expression levels during vascular remodelling and terminal differentiation of the various lung tissues. The representative genes from each of the four major cluster groups are listed in tables 1 and 2.
Representative genes from expression groups I and III (see fig 2)
Representative genes from expression groups II and IV (see fig 2)
Of the 202 members of group I, whose expression is decreased during early stages of organogenesis (9.5 dpc), increased during branching and completion of the conducting airways (14.5 dpc-1 w), and then decreased with lung maturation (2-4 w), 121 are known genes. Table 1 lists those genes whose expression change is two-fold or greater between the 9.5 dpc time point and the 14.5 dpc time point. The fold change between the 1 and 2 w time points average 1.3 for this group of genes.
Group I genes include several homeobox and zinc finger transcription factor genes. Homeobox11 and c4 (Hox11 and HoxC4) both had over a two-fold increase in expression between 9.5 and 14.5 dpc. Bcl-6 associated zinc finger protein (Bazf) had fold change of ∼1.4. There were several Ras related genes in this group as well. RAB3B and Ras recision gene (rrg) are both members of the Ras pathway and interact with genes that control the cell cycle. Their activity may be vital for the strict regulation of the rapid increase in cell mass occurring during the period of exponential proliferation (14.5 dpc-1 w). RAB3B had a 2.9-fold induction of expression at 14.5 dpc. Rrg had a 2.7-fold increase in expression at 14.5 dpc and a reduction, ∼two-fold, of expression at 1 w.
Structural and adhesion genes are present in group I as well as transcription factors. Perinatal upregulation of the structural genes during development is concurrent with expansion of the major airways. Several members of the procollagen family, such as types I, V, and XIII, fit the group I profile. Fibulin 1 is a matrix protein whose expression is 2.1-fold greater at 14.5 dpc. Lysyl oxidase is involved in the maturation of collagen and elastin, as well as playing a role in p21 suppression.7 It had the highest expression change of all of the group I genes, 3.9-fold. The metabolic enzyme, hydroxysteroid dehydrogenase-1, belongs to the steroid catabolic pathway and had a two-fold expression change.
Group II genes have a decreased expression during the entire embryonic period of development (9.5-17.5 dpc) and an increased expression during the postnatal period of development (NB-4 w). We have identified 485 genes that have a 1.5-fold or greater expression change between the average of the embryonic time points and the postnatal time points. Table 2 lists those genes whose expression values average four-fold or greater during the postnatal period of development.
Many of the group II genes that are highly upregulated during differentiation and maturation of the lung are involved in cell metabolism. Aquaporin 1, carbonyl reductase 2, and several members of the cytochrome P450 family, IVB and 2f2, are expressed at 5.7, 6.7, 9.6, and 6.1-fold increased levels, respectively, during postnatal differentiation/maturation of the lung. The transcription factors ELF3 and Vax1 also have a high degree of expression during the postnatal period, 8.4 and 4.8-fold induction, respectively. The upregulation of these transcription factors as well as Klf4 and Math5 may lead to the increased expression of genes that promote terminal differentiation of pulmonary cells, including several homeobox domain containing target genes. Structural genes such as matrilin 2, dermatopontin, EMP2, and secretory proteoglycan are involved in the alveolar and vasculature remodelling that accompanies lung maturation.
Group III genes have an expression pattern that is the opposite of group I. They are upregulated during organogenesis (9.5 dpc), downregulated during the expansion and remodelling phase of development (14.5 dpc-1 w), and upregulated again during maturation of the lung (2-4 w). Of the 101 members of this group, 70 are previously identified genes. Group III genes in table 1 include those genes whose expression is 1.5-fold or greater between the 9.5 dpc and 14.5 dpc time points. The average fold difference between the second expression change (1-2 w) was 1.5. Cell cycle effectors such as Meiotic recombination 11, TAF 15 RNA polymerase II, and MAPKKKK2 had significant fold decreases between 9.5 and 14.5 dpc (∼1.65-fold). However, it is important to note that the whole embryos were used for 9.5 dpc and the increase in the expression of group 3 genes at this time point may largely be attributable to the presence of tissues other than lung, such as brain, etc.
There are 125 genes in group IV whose average expression values are at least 1.5 times greater during the embryonic period of development than postnatal period. Group IV genes represented in table 2 have expression values that are two-fold or greater during the embryonic period when compared to the postnatal period of lung development. In group II, many of the highly upregulated genes were associated with cellular differentiation and cell metabolism. The highly upregulated genes observed in group IV are more involved in cell growth and cell mass expansion. Many of the genes in this group are cell cycle control components and transcription factors in this group. Well known cell cycle genes such as CDK4, RAN, p57, and Cyclin B1 are all up regulated (2.3, 2.1, 2.9, and 3.9-fold, respectively) during the embryonic period of lung development. Other related genes involved in cell cycle control and matching the group IV expression pattern are RAN binding protein 1, fidgetin-like 1, mad 2, and thymidylate synthase and they are upregulated 2.1, 2.5, 2.2, and 2.2-fold, respectively. The DNA replication factor MCM4, growth factors such as H19, FGF inducible 16, and Delta-like 1 homologue, and protein degradation molecule ubiquitin 2 are also upregulated during organogenesis and lung mass accumulation. HMG2, Peg-3, and mTEAD2 are transcription factors whose expression is increased more than two-fold during embryonic stages. Structural genes Peg1/Mest, alpha collagen, and alpha actin are also upregulated during the embryonic portion of lung development, which corresponds to the significant amount of remodelling that occurs during lung development.
Fig 3 shows hierarchical clustering of a select group of genes previously associated with lung development, including the transcription factors and their targets. We have significantly expanded the number of genes that may be involved in lung development (figs 1 and 2). The top half of fig 1, described earlier, is a scheme of those factors whose involvement in lung development has been at least partially established. Expression patterns for these genes and others recently identified are displayed in fig 3. The bottom half of fig 1 includes results from this study.

Expression patterns of a select group of genes previously identified as being directly involved in lung development. Green indicates an expression below the mean value, black near the mean, and red above the mean. Values were obtained as described in fig 1.
Next, transduction pathways, metabolic pathways, and other functional groupings of genes that may be involved in mouse lung development were systematically evaluated for differential regulation using the visualisation tool GenMAPP (UCSF). GenMAPP is a novel tool for visualising expression data in the context of biological pathways.8 We imported our data set into the program and used GenMAPP to convert the expression data into illustrations showing presence and significant expression change for the genes represented on the microarray based on the analysis of prenatal versus postnatal expression change. We found that genes in at least three major regulatory pathways were significantly altered during lung development. Fig 4 is a graphical representation of some of the pathways that we have identified that are involved in murine lung development. Fig 4A represents the Wnt signalling pathway. The Wnt pathway is essential for regulating development and differentiation of many tissues. Among other things, it regulates β-catenin, ensuring the proper activation of cell cycle transcriptional controls. Without Wnt family signals, a complex containing APC promotes the phosphorylation and subsequent ubiquitination of β-catenin. Following the initiation of the Frizzled cascade, β-catenin levels rise and accumulation in the nucleus promotes the formation of transcriptionally active complexes with the Tcf family of transcription factors. The Tcf family influences a wide variety of developmental processes in various tissues, targeting such genes as c-myc, cyclin D and c-jun. Fig 4A shows the extent of the involvement of the Wnt pathway in our study.

GenMAPP pathways integrating our expression data. Yellow indicates a higher level of expression in the prenatal samples. Blue indicates a higher level of expression in the postnatal samples. Grey indicates that the selection criteria were not met but the gene is represented on the array. White boxes indicate that the gene was not present on the chip. In those boxes with multiple colours, there were two locations for the gene existing on the array. The inner colour represents the result for the first value determined for the gene and the outer colour represents the subsequent value.
As expected, the cell cycle control pathway is also intimately involved in murine lung development. Fig 4B depicts the involvement of cell cycle control at the G1/S phase boundary. Specific Rb family/E2F repressor complexes prevent progression of the cell cycle at different stages, particularly at G1 in response to DNA damage. If damage is recognised, the option to progress through the cycle after repair or to terminate cellular function is chosen. p53 activation is crucial for this distinction. Advancement of the cell cycle leads to proliferation of the cell type and differentiation after the appropriate signals.
Finally, in fig 4C the apoptotic pathway is presented. Cell death activators and inhibitors are vital for the maintenance of appropriate cell mass during development. As tissue differentiates, apoptosis helps to remodel structure and avoid overgrowth. As we can see in the figure, several key apoptotic genes are involved in lung development. Caspases 6, 8, and 9 are upregulated in the postnatal lung tissue. JNKK, c-Jun, I-kappa B, and NF-κB are also upregulated at this time. C-myc and p53, on the other hand, are higher in the prenatal lung tissues. All of these factors tightly regulate cell death throughout lung development.
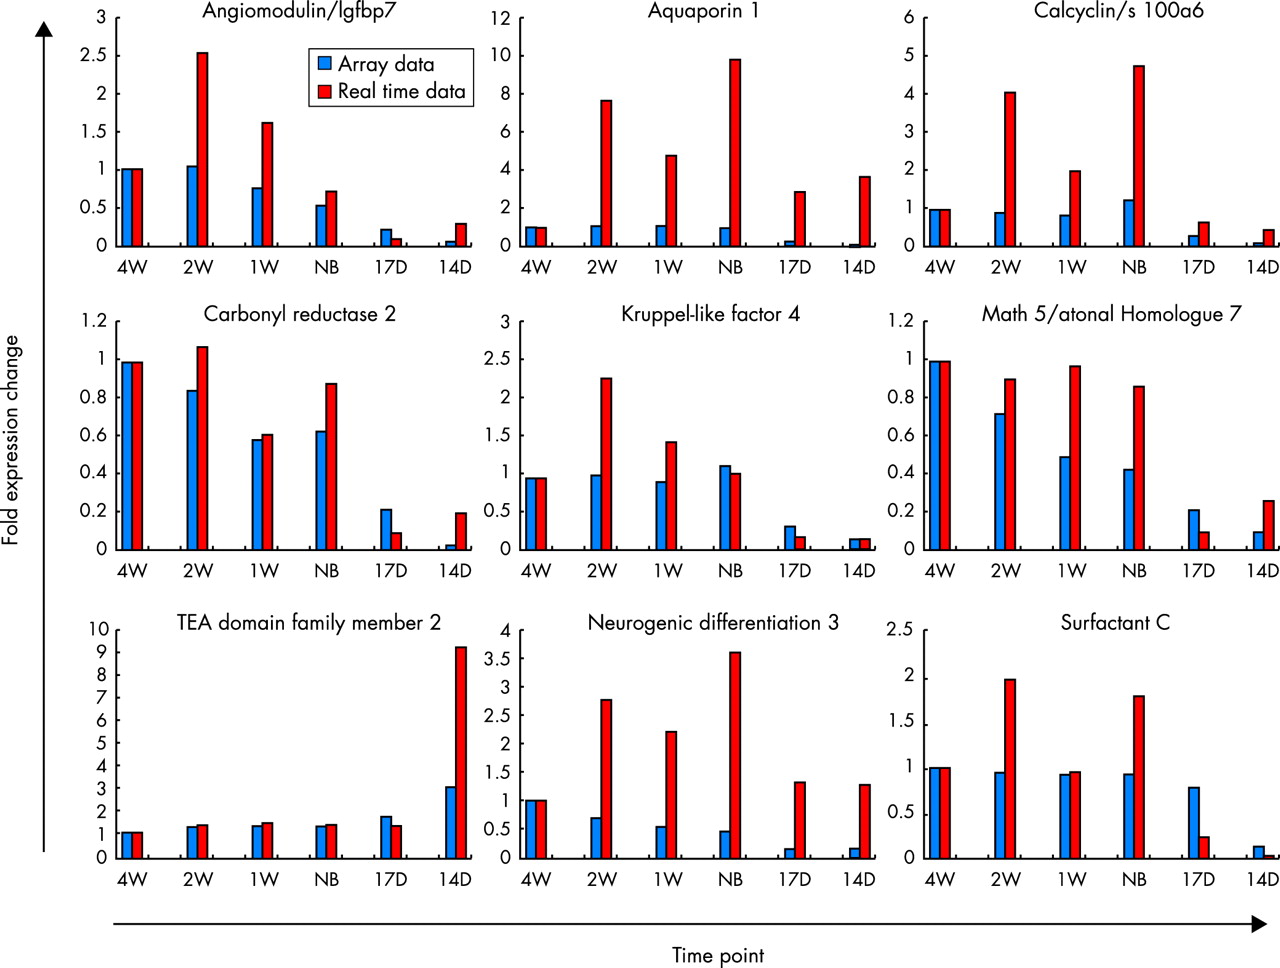
Fig 5 is a comparison of array expression values and real time PCR expression values. Using the expression values and patterns found during the examination of the microarray data, several genes were chosen for real time analysis in order to verify our array data. The exact same total RNA was used to generate cDNA for both experiments. To generate the graphs, the expression values were divided by the four week, adult lung control expression values. The various scales used in the figure help to show the overall patterns of expression in both the microarray and the real time data sets. While in many cases, the real time expression is greater overall when compared to the array expression, the basic patterns of expression remain. Angiomodulin shows a marked increase in real time expression at the two week time point versus the array expression but the pattern of increased gene expression during the postnatal period is still evident in both the array data and the real time data. The same can be said of aquaporin 1 and calcyclin, although the overall real time expression is much greater than the array expression, especially for aquaporin. TEA domain family member 2 (TEAD2) expression is surprisingly higher in the 14 day time point and shows an overall higher expression pattern during the prenatal period of development. Surfactant C expression increases at the newborn time point, which is to be expected with its role in maintaining surface tension integrity in the lung, but its expression seems to decrease at 1 week before increasing again at 2 weeks. Fig 5 shows that while basal expression values may differ between the microarray and real time assays, the patterns first seen in the microarray experiments are consistent.
A comparison of fold changes over time for expression array data with reference to 4 w by real time PCR. Red bars indicate real time data and blue bars indicate expression array data. The scale of each graph was determined individually in order to maximise the view of the particular pattern associated with expression. An average of all four independent samples in two pools is shown. For each time point there are four samples (A-D). RNA from A and C and B and D were pooled and subjected to real time PCR on both pools. The results from the two RNA pools (representing four samples), AC and BD, are presented.
The embryonic stage of pulmonary development begins with the branching of foregut epithelium. The transition from the embryonic period to the pseudoglandular period, around day 12 post coitum is mediated by a host of transcription factors. TTF-1 is a member of the homeodomain containing transcription factors and is involved in the regulation of temporal-spatial patterns, tissue stoichiometry, and structural proteins, especially in lung epithelium.9 TTF-1 binds to regulatory elements in the promoter regions of surfactants A, B, and C, collagens, and cell adhesion molecules. GATA-6 and TTF1 have been shown to alter the expression of structural genes that leads to differentiation and remodelling of lung structure.10 Zinc finger transcription factors, such as GATA-6, are important in cell differentiation. GATA-6 binds to and activates structural genes that are important in the formation of respiratory bronchioles.11 The majority of bronchiolar construction occurs during the period of lung remodelling when cellular lung mass has reached its maximum and alveolarisation and remodelling of the airways for respiration has begun. GATA-6 expression is at its peak during the newborn to 1 w period, mirroring lung reorganisation. HNF-3β has been shown to induce foregut endoderm differentiation and is expressed in all lung epithelia during the entirety of lung development, even being maintained in the alveolar epithelium of adult tissue.12,13 Our data show that once this factor is induced, its expression level is maintained in the lung.
Our list of genes associated with the embryonic-pseudoglandular transition transcription factors is seen in the bottom half of fig 1. Abp1 is an F-actin binding protein. Beta-meltrin is a metalloproteinase. Daf1 and Daf2 protect “self” tissue from being recognised by immune cells. Sox11 is a member of a family of transcription factors involved in cell growth and differentiation, as is Wee1, a CDK1 inhibitory kinase. Ubiquilin 2 is involved in apoptosis. Around day 15 post coitum, the transition from the pseudoglandular stage of pulmonary development to the canalicular stage occurs. Transcriptional control of cell differentiation is carried out by temporal and spatial expression of several types of transcription factors. Winged-helix hepatocyte nuclear factor homologues such as HFH-4, HNF-3β, and HFH-8 are important to the formation of foregut endoderm, from which the lung eventually buds. HFH-4 is also expressed during pre- and postnatal epithelium, being mostly found in basal and ciliated cells. Its expression in the epithelium during development and postnatally in the nose, trachea, and lung influences ciliogenesis.14 We show an increased expression level during the late part of the embryonic period, stretching into the early postnatal time points. The majority of the differentiation of ciliated cells takes place in this time period. HFH-8 is found in the mesenchyme of developing tissues, particularly of the area surrounding the distal epithelium and is seemingly activated by paracrine signals from endodermal epithelia.15 Activation of HFH-8 by extracellular Sonic hedgehog (Shh) signalling via the Patched receptor has been reported.16 Our data show an increased HFH-8 expression at 17.5 dpc following Shh upregulation at 14.5 dpc. Definitive targets of HFH-4 and HFH-8 and those genes facilitating the transition to the canalicular stage are few. Beta-tubulin, an essential microtubule component, is targeted during the most proliferative time points for increased expression. Surfactants A, B, and C as well as Clara Cell Secretory Protein are also first seen in pulmonary tissue.
The transition from pseudoglandular to canalicular phase occurs around day 15 post coitus. Possible target candidates include Cdc6, CDk4, and CyclinB1, which are all cell cycle effectors, as is Eno1, a repressor of c-myc. Ran is a Ras related GTPase which regulates nucleo-cytoplasmic transport during interphase. Nasp is a histone binding protein. Peg3 is involved in chromosome stability. Tead2 and Zac1 are transcription factors. The saccular-alveolar stage of murine lung development facilitates breathing in the animal. It is during this period when preparation for the first breath, including expansion of the alveoli and maintenance of the surface tension in the lung that keeps the alveoli expanded, occurs. HFH-4 and TTF-1 have been established as necessary for this vital part of lung development. Hepatocyte nuclear factor-3alpha also plays a role in preparing the lung for gas exchange. Targets for these transcription factors at this stage are unknown. The canalicular to saccular-alveolar transition around day 17 post coitum is mediated by a small group of known transcription factors such as HFH-4. We have identified a limited group of potential targets. Dlk1 inhibits adipocyte differentiation. H19 function is unknown but is highly regulated by imprinting. The Lox gene is a lipoxygenase.
The largest group of potential targets occurs at the transition from the prenatal to postnatal periods. We have identified 106 genes with the potential to be involved in the maturation process of the lung. Ace is an angiotensin converting enzyme. Casp9 is involved in apoptosis. Cst3 is a protease inhibitor. Edg1 is a G protein coupled receptor. Mapkapk5 is involved in cell cycle regulation. Rag1 is involved in facilitating recombination. Septin4 GTPase is also involved in the cell cycle. Vax1 is a homeobox transcription factor. Vegf is involved in the remodelling of the lung microvasculature in response to lung maturation. Wnt10b is involved in differentiation.
Included in our list of genes of interest are some of the genes associated with lung cancer. Cyr61, a tumour suppressor gene found in mesenchymal cells, is a regulator of cell adhesion migration and proliferation.17 We have found its expression to peak at the newborn time point, slightly decreasing at two weeks and increasing again at four weeks. Constitutive expression of this cysteine rich growth factor is necessary for normal cell growth. A marked decrease in Cyr61 expression has been found in non-small cell carcinoma cell lines. Nore1, the RAS association domain family protein (RASSF1A) homologue in mice, is involved in the negative regulation of cell growth through interaction with the Ras signalling pathway.18 We show upregulation of this gene at the newborn stage of our study, implying that this gene could possibly be activated to control lung cell mass. At this point in development, maturation of the lung structure is occurring, with the overall cell mass being at its limit and restructuring of the tissue beginning in concordance with the start of lung function. Finally, Dutt1/Robo1 gene expression was examined. Dutt1/Robo1 is a murine homologue of the Drosophila Roundabout gene. This gene codes for a neural cell adhesion molecule receptor and has been implicated in the migration of axons, myoblast, and leucocytes in vertebrate lung.19 Knockout mice acquire extensive bronchial abnormalities and it is among the tumour suppressor genes often deleted with the loss of chromosome 3p in lung cancers. We see Dutt1/Robo1 expression at 14.5 dpc, when brachial infiltration into the surrounding mesenchyme is greatest. We find expression patterns of known genes to vary slightly from published reports but at the same time, they follow patterns intuitive to their function and the events of lung development.
In summary, we have shown that transcriptome wide analysis of gene expression shows numerous patterns associated with lung development that have not previously been described. Using oligonucleotide microarray analysis across different lung development stages, a global view of gene expression during lung development shows the temporal regulation of the key regulatory pathways. With a better understanding of gene regulation in lung development comes the possibility of genes that are involved in lung development frequently playing a key role in lung tumorigenesis. The results from the present study will contribute to our understanding of the functions of genes that are important in both lung development and lung tumorigenesis. Finally, the genes identified pertinent to early development may serve as candidate susceptibility genes for various inherited lung cancer disorders as well as for various heritable disorders of lung development.
Acknowledgments
We are grateful to Dr Keith Crist for assistance in microdissection of mouse embryos and E Wiley for secretarial assistance. This work was supported by National Institutes of Health grant numbers R01CA58554 & R01CA78797.