Article Text

Abstract
Objective This study investigated the association between long-term exposure to black smoke (BS) air pollution and mortality in two related Scottish cohorts with 25 years of follow-up.
Methods Risk factors were collected during 1970–1976 for 15331 and 6680 participants in the Renfrew/Paisley and Collaborative cohorts respectively. Exposure to BS during 1970–1979 was estimated by inverse-distance weighted averages of observed concentrations at monitoring sites and by two alternative spatial modelling approaches which included local air quality predictors (LAQP).
Results Consistent BS–mortality associations (per 10 μg m−3 increment in 10-year average BS) were observed in the Renfrew/Paisley cohort using LAQP-based exposure models (all-cause mortality HR 1.10 (95% CI 1.04 to 1.17); cardiovascular HR 1.11 (1.01 to 1.22); ischaemic heart disease HR 1.13 (1.02 to 1.25); respiratory HR 1.26 (1.02 to 1.28)). The associations were largely unaffected by additional adjustment for area-level deprivation category. A less consistent and generally implausible pattern of cause-specific BS–mortality associations was found for inverse-distance averaging of BS concentrations at nearby monitoring sites. BS–mortality associations in the Collaborative cohort were weaker and not statistically significant.
Conclusions The association between mortality and long-term exposure to BS observed in the Renfrew/Paisley cohort is consistent with hypotheses of how air pollution may affect human health. The dissimilarity in pollution–mortality associations for different exposure models highlights the critical importance of reliable estimation of exposures on intraurban spatial scales to avoid potential misclassification bias.
Statistics from Altmetric.com
What this paper adds
-
What is known
-
Epidemiological evidence suggests that long-term exposure to combustion-related air pollutants has adverse effects on health (which are more substantial than the effects associated with short-term exposures) but is limited by scientific uncertainties concerning exposure misclassification and potential confounding.
-
There are scientific and policy requirements for cohort studies assessing air pollution health impacts in the UK to assess the appropriateness of extrapolation of findings from studies in the USA and other European countries.
-
What this study adds
-
Associations between mortality and long-term exposure to black smoke air pollution observed in this study add to, and are generally consistent with, the limited observational evidence available to examine hypotheses of the extent to which long-term exposure to air pollution may affect human health.
-
Dissimilarity in pollution-mortality associations for different exposure models highlights the critical importance of reliable estimation of exposures on intra-urban spatial scales to avoid potential misclassification bias.
-
The extent of dissimilarities noted between exposure models re-emphasises that inadequate human exposure classification will continue to be the one of the most challenging issues to address in future environmental epidemiology research; which emphasises the value of development of sufficiently extensive intra-urban pollution monitoring datasets to support improved epidemiological assessment.
Background
North American1–4 and European epidemiological cohort studies5–7 provide evidence that long-term exposure to air pollutants has adverse effects on health, which are more substantial than the effects associated with short-term exposures.8–10 Earlier analyses relied on inter-urban variations in air pollution with discrete urban areas represented by single monitoring sites. Subsequent attention has focused on exposure assignment determined from intraurban variations in pollutant concentrations. Extrapolating the findings from cohort studies in the USA and European countries to the population of the UK may not be appropriate because of variations in population demographics, cultural factors and pollutant mixes. Correspondingly, there are clear scientific and policy requirements for similar investigations within the UK.8
Scotland has one of the highest death rates in the world for coronary heart disease11 and lung cancer.12 These death rates have been intensively studied and related to well-characterised socio-economic, lifestyle and medical risk factors. The purpose of the work described here was to apply different exposure estimation methods to investigate if long-term exposure to air pollution contributes to excess cause-specific mortality, after adjusting for individual-level risk factors in two large cohorts in Scotland with mortality follow-up periods of up to 25 years.
Methods
Cohort participants
The study used two of the Midspan prospective cohorts.13 The Renfrew/Paisley cohort was recruited from residents aged 45–64 of two towns in west central Scotland and comprised 78% of the target population with 15 402 participants recruited between 1972 and 1976.14 The Collaborative cohort comprised 7028 participants of working age from 27 workplaces in central Scotland, recruited between 1970 and 1973.15 Incomplete and incorrect postcodes, which could not be converted to grid references, restricted the number of participants selected for the present study to 15 331 and 6680 for Renfrew/Paisley and Collaborative cohorts, respectively.
Participants in both cohorts completed a health-related questionnaire and attended a screening medical examination. The questionnaire collected data on gender, date of birth, marital status, smoking status, occupation and address (from which full postcode of residence and area-level deprivation category (DEPCAT) were derived) (table 1). DEPCAT is evaluated at the level of postcode sectors (average population: 5000) and is calculated from general population census statistics on proportion of population in households without access to a car, in overcrowded households, with the head of household in social class IV or V, and in households with unemployed men.16 Social class was derived for cohort participants using the UK Registrar General's classification based on occupation at the time of screening.17 Body mass index was calculated from measurements of height and weight. Blood pressure was measured and a blood sample collected for measurement of plasma cholesterol.14
Summary statistics of individual baseline mortality data in Renfrew/Paisley and Collaborative cohorts
Diagnoses for causes of death were based on the International Classification of Diseases (9th revision). Five outcome mortality classifications were used: all-cause (all codes), cardiovascular (410–414, 426–429, 434–440, 786.5), ischaemic heart disease (410–414), respiratory (480–487, 490–496, 786.0, 786.2) and lung cancer (162). These causes of death groupings were chosen to be compatible with related studies of effects of short-term pollution exposure.18 Follow-up for date and cause of death was maintained until the end of 1998.
Exposure modelling and assignment
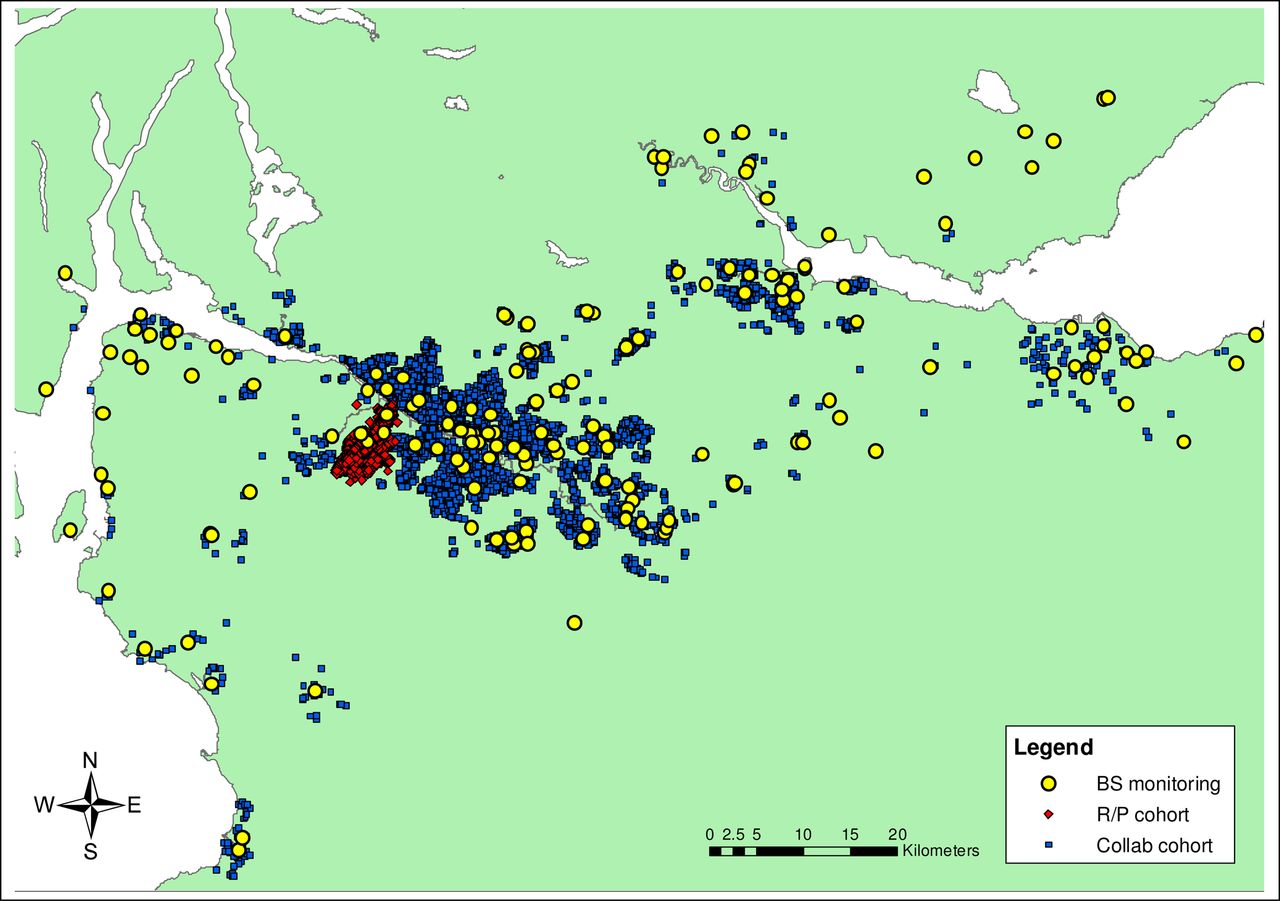
Participants in the Collaborative cohort were geographically dispersed throughout cities, towns and villages in the central part of Scotland (figure 1). The Renfrew/Paisley cohort participants were resident in a more localised area on the west side of the Glasgow conurbation. To provide an indication of geographical scale, the contiguous conurbation of Glasgow, Paisley and Renfrew can be encompassed within a radius of 12 km, with Renfrew and Paisley encompassed by radii of 1.5 and 3.5 km, respectively, within this 12 km radius.
Locations of cohort participants' residential addresses and black smoke monitoring sites.
Daily black smoke (BS) measurements at 181 monitoring sites were obtained from the UK National Air Quality Archive.19 BS is a metric of the optical darkness of airborne particulate matter collected on filter media.20 Although quantified in units of μg m−3, BS concentrations do not equate directly to the mass of any particular size fraction of airborne particulate matter. However, consistent standard calibrations (eg, Department of Environment, Transport and Regions (DETR)21) have been used for many decades to convert reflectance to nominal concentration such that BS data are important measures of historic levels of air pollution used widely in epidemiological studies. The DETR21 calibration procedures were used in the computation of UK government archived BS data used in this study. The use of BS as a metric of particulate matter air pollution is well established in the epidemiological research community and has been shown to be a good marker for traffic and other primary combustion-related urban air pollution, often at least as predictive of negative health outcomes as PM10 or PM2.5.22
These BS data were collected at a time when there was a move away from using coal as the main source of domestic heating fuel under the implementation of the UK Clean Air Acts. Quantitative emissions data for this period are limited in detail. The location and times of operation of the sites were at the discretion of the local authorities and the central government agency responsible for air pollution. A substantial amount of BS data was missing at several sites. Three approaches were used to estimate average long-term exposure to BS between 1970 and 1979 for individual cohort participants. There were insufficient pollutant observations to model exposure in the 1980s and 1990s at the same spatial resolution.23
In the first approach using inverse distance weighting (IDWBS), local knowledge of the geography and meteorological conditions in Scotland was used to allocate monitoring sites to 15 geographic regions. Each region had ≥1 site with ≥60% available BS data. The following model was used to impute missing data and compute geometric mean daily BS for 1970–1979 at sites within each region, 1
1
where i indexes the sites and j indexes the observations within a site, tij is time measured in days from 1/1/70; t* is time from 1/1/75; I(ti > t*)=1 when ti>t* and 0 otherwise; si is a site-specific intercept; day(tij) and month(tij) are factors for day of week and month, respectively; and εij is an error term. Geometric mean daily BS exposure (1970–1979) was estimated for each cohort participant using an inverse-distance weighted average of geometric mean BS at the nearest (<1 km) monitoring sites. If there were no sites within 1 km, exposure was assigned the weighted average of the two nearest monitoring sites. In this method, exposures assigned to cohort participants could only range from the minimum to the maximum of the nearest sites.
In the second approach, using an additive model (AMBS), the 10-year average BS at each site (after imputation of missing values as before) was related to four local air quality predictors (LAQP): altitude above sea level (A); household density (HD) within a 250 m buffer;24 distance to nearest major road (MR) (motorways and ‘A’ roads in 2001 from the National Atmospheric Emissions Inventory25); and distance to the edge of the nearest urban boundary (UB) (derived from Ordnance Survey data). The model also included an indicator (UA.Ind) of whether the monitoring site was inside or outside a small (<17.7 km2; cut-point defined by median area of urban areas containing monitoring sites) or large urban area. Five spatial regression models were examined in sensitivity analyses.23 The most parsimonious configuration was a semiparametric model with bivariate smooth trend of geographical coordinates, s(E, N), and parametric terms for LAQP, which was then used to predict 10-year average BS at each residential location. 2
2
where β1…β5 are fixed effects parameters for LAQP.
The most detailed approach, multilevel spatio-temporal modelling (MultiBS), employed a combination of time series, imputation and spatial smoothing techniques to model the change in monthly BS simultaneously taking into account seasonal effects and LAQP. 3
3
Here, i indexes the sites and j indexes the temporal observations; tij is the number of months from January 1970; f(tij) is the BS temporal trend averaged over the population of all sites; gi(tij) is the deviation of the ith site from the population mean at time tij (f(tij) and gi(tij) were modelled flexibly using penalised linear splines); sine and cosine terms model monthly seasonal effects with α1c, α1s as fixed-effect parameters; and α2…α5 are fixed-effect parameters of LAQP.
The AMBS and MultiBS models were similar in that both used spatial smoothing to estimate participants’ exposure by taking into account both air pollution concentrations at monitoring sites nearby their residences and local environmental determinants by means of LAQP. However, the multilevel model has the ability to estimate coefficients between BS and LAQP in the presence of missing data, and hence was not dependent on the imputation techniques used to replace missing data in the first two approaches. Further details of the development, evaluation and application of these exposure models are described by Beverland et al.23
We included only participants who lived within 5 km of the nearest sites for all three exposure models. Estimated 1970–1979 geometric mean exposure concentrations at participants’ residential addresses in the Renfrew/Paisley cohort ranged from 14.9 to 27.1 μg m−3, 5.9 to 24.4 μg m−3 and 6.4 to 28.7 μg m−3 for IDWBS, AMBS and MultiBS respectively; and in the Collaborative cohort ranged from 5.4 to 70.0 μg m−3, 6.2 to 48.5 μg m−3 and 4.6 to 55.3 μg m−3 respectively (table 1).
The three exposure models were evaluated in a cross-validation study.23 Monitoring sites with >80% data coverage were identified and any missing data were imputed with a site-specific time-series model with a flexible trend, month and day effects to give 39 sites with ‘complete’ data. Ten-year mean BS concentrations at these 39 sites ranged from 8.9 μg m−3 to 48.2 μg m−3. We then created a ‘test data set’ from 19 of these sites, selected at random, and a ‘training data set’ from the remaining 20 sites together with all the sites with <80% data coverage. The model was fitted to the training data set (of 162 sites) and then used to predict BS in the test data set. This cross-validation procedure was repeated 10 times with different random selections of the 19 test sites from the 39 'complete' data sites. The average mean squared differences on the log BS scale ((ln μg m−3)2) were 0.171, 0.171 and 0.090 for IDWBS, AMBS and MultiBS exposure models, respectively.
Interpolated maps of BS concentrations were prepared from estimated BS exposure at address postcodes of cohort participants.23 The AMBS and MultiBS models provided a much more consistent and (from local knowledge) plausible prediction of exposure at addresses of participants than the IDWBS model (eg, the IDWBS model failed to predict anticipated lower concentrations for many cohort addresses in residential areas in south Paisley as all estimates were constrained to remain within the high concentrations measured in the centre of Paisley). Collectively, the cross-validation and map visualisations suggest that the LAQP-based models produce a more realistic prediction of likely exposures in the cohorts.23
Survival analyses
Associations between estimated long-term exposure to air pollution using the three different exposure models and cause-specific mortality were examined using Cox proportional hazards regression, with baseline hazard functions stratified by 1 year age groups and gender, for follow-up to the end of 1998.
Baseline variables included: marital status; smoking status (never, ex-smoker or current smokers who smoked 1–14, 15–24, 25+ cigarettes per day, pipe or cigar smokers); social class (categorised as I: high, II, III: non-manual, III: manual, IV, V: low); body mass index (expressed in quintiles); systolic blood pressure; and cholesterol. The last two variables were used only for modelling all-cause, cardiovascular and ischaemic heart disease mortality.
Participants with missing systolic blood pressure and cholesterol were removed. The 423 (2.8%) participants with missing social class in Renfrew/Paisley cohort were recoded as a separate level in social class. As there were only 11 (0.2%) participants with missing social class in Collaborative cohort, they were removed from the analyses.
To investigate sensitivity to possible additional confounding by area-level socio-economic status, additional adjustments for DEPCAT (1 (least deprived), 2, …, 7 (most deprived)) were included. Further sensitivity analyses used shared γ frailty models, where a random effect cluster was applied to postcode sectors and deprivation categories. Additional sensitivity analyses examined the effect of exclusion of participants who lived at different distances from monitoring sites (for IDWBS) and different follow-up time periods (all exposure models). Possible BS effect modification by gender, smoking status, body mass index and social class was also examined.
Statistical analyses were performed using S-PLUS 7, Insightful Corporation, Seattle, Washington, USA (2005). R 2.14.1 (R Foundation for Statistical Computing, Vienna, Austria) and SPSS 12.0.1. A R package ‘frailtypack‘ (http://www.jstatsoft.org/v47/i04/) was used to fit the shared frailty model with parameters estimated by penalised likelihood maximisation.
Results
In the analyses of the Renfrew/Paisley cohort (table 2A), the adjusted HRs for all-cause and cause-specific mortality, attributable to an increment of 10 μg m−3 long-term MultiBS exposure in 1970–1979, were, in descending order: respiratory (HR 1.26, 95% Confidence Intervals (CI) 1.02 to 1.55); ischaemic heart disease (HR 1.13, 1.02 to 1.25); cardiovascular (HR 1.11, 1.01 to 1.22); all-cause (HR 1.10, 1.04 to 1.17); and lung cancer (HR 1.00, 0.84 to 1.20) for follow-up till end of 1998. Associations between BS and all-cause and specific causes of death were slightly attenuated but persisted following additional adjustment for DEPCAT in the standard Cox model (table 2C).
Adjusted HRs per 10 μg m−3 increment of geometric mean black smoke concentration for 1970–79 with corresponding 95% CI for all-cause and cause-specific mortality for follow-up till end of 1998 for Renfrew/Paisley and Collaborative cohorts.
Effect magnitudes for exposures predicted via AMBS were similar to those via MultiBS. In contrast, associations between IDWBS estimates and mortality were markedly different from the AMBS and MultiBS models, with inconsistent directions and relatively large CI.
In the Collaborative cohort, BS–mortality associations were lower and not significantly elevated, except for lung cancer (HR 1.11 (0.96 to 1.30) for MultiBS) and were similar for different exposure models (table 2B).
The HRs in both cohorts were largely unaffected by stepwise adjustment of risk factors (table 3).
Adjusted HRs per 10 μg m−3 increment of geometric mean black smoke concentration for 1970–79, with corresponding 95% CI for all-cause and cause-specific mortality for the Renfrew/Paisley and Collaborative cohorts with stepwise adjustment of risk factors in Renfrew/Paisley and Collaborative cohorts with MultiBS
In sensitivity analyses using shared γ frailty models, there was no evidence for the Collaborative cohort of heterogeneity between postcode sectors or between deprivation categories. In Renfrew/Paisley, a much smaller geographic area with only 14 postcode sectors, there was evidence for heterogeneity between postcode sectors (deduced from a modified Wald test: variance of the random effect of 0.00637 divided by SE 0.0335, which gave 1.82>1.64, critical value of one-sided normal test) but no evidence of heterogeneity between deprivation categories. Inclusion of a shared frailty component associated with DEPCAT was not required as the risk factors in the model accounted for most of the variance in survival time.
There was no evidence of BS effect modification by gender, smoking or social class for all-cause and specific causes of death for both cohorts (results not shown).
Discussion
BS–mortality associations were observed in the geographically localised Renfrew/Paisley cohort for all-cause, cardiovascular, ischaemic heart disease and respiratory mortality. Associations between BS and cause-specific outcomes were generally consistent for the LAQP-based MultiBS and AMBS exposure models, with a less consistent and generally implausible pattern of associations noted for the IDWBS exposure model. There was limited evidence of possible pollution-related effects in separate analyses of the Collaborative cohort.
Analyses based on the MultiBS exposure model in Renfrew/Paisley cohort indicated highest HRs for respiratory, followed by ischaemic heart disease, cardiovascular and all-cause mortality. BS–mortality associations for the AMBS exposure model were similar to those for MultiBS. These findings are consistent with hypotheses of how air pollution may affect human health10 ,26 and the limited evidence base (reviewed by22) on BS–mortality associations from cohort5 ,7 and cross-sectional studies27 (table 4). For example, observation of all-cause mortality HR of 1.10 (95% CI 1.04 to 1.17) associated with an increment of 10 μg m−3 long-term MultiBS in this study is consistent with equivalent effect magnitudes in two other cohort studies that use BS as an exposure metric: the Netherlands Cohort Study on Diet and Cancer (NLCS-Air) (all-cause mortality HR of 1.05 (1.00 to 1.11)7) and the French PAARC (Pollution Atmospherique et Affections Respiratoires Chroniques/Air pollution and chronic respiratory diseases) study (all-cause mortality HR of 1.07 (1.03 to 1.10)5). These cohort-based risk estimates for all-cause mortality appear to be higher than broadly equivalent risk estimates made in a small area ecological study in Great Britain (GB) (eg, all-cause mortality HR 1.019 (1.018 to 1.021) and 1.007 (1.006 to 1.009) for analyses before and after adjustment for area-level deprivation for 0–8 year exposure window27). Relatively large BS–respiratory mortality associations are evident in the Midspan, NLCS-Air and GB small area studies (respiratory mortality was not examined separately in the PAARC study).
Summary of black smoke (BS)–mortality associations per 10 μg m−3 increment BS in Renfrew/Paisley (present study), NLCS-Air7 and PAARC5 cohort studies, and small-area ecological study in Great Britain27.
The IDWBS exposure model was anticipated a priori to be inadequate for estimation of the effects of local road traffic and household emissions (particularly domestic coal fires before more extensive implementation of smoke control areas under the UK Clean Air Acts) and dispersion and advection processes. This may explain why IDWBS exposure estimates resulted in unexpected ‘protective’ BS–mortality associations in Renfrew/Paisley cohort, although these were less evident when analyses were restricted to cohort participants within 2 km of a monitoring site (results not shown). It has been observed that IDWBS estimation results in gross exposure misclassification.23 For example, local knowledge of pollution climates suggests that the IDWBS model substantially overestimated actual exposures in suburban areas in south Paisley by assigning cohort participants with a distance weighted average of the means of the two nearest monitoring sites in relatively polluted parts of the centre of Paisley. In contrast, the use of LAQP provided consistent and plausible estimates of intraurban variations in BS exposure as predicted concentrations were not constrained to lie within the range of concentrations observed at the nearest (but not necessarily ‘near’) monitoring sites.23
In the reanalysis of the American Cancer Society (ACS) and Harvard Six Cities cohorts, which assigned exposure based on community average concentrations, the HR for respiratory mortality was lower in magnitude than that for cardiovascular mortality with relatively wide CI.28 In contrast, in this study of the Renfrew/Paisley cohort using LAQP-based exposure estimation, the HR for respiratory mortality was higher in magnitude than for any of the other outcomes.
There are limitations in this study of the Midspan cohorts that are shared to a greater or lesser extent with most, if not all, cohort studies of long-term exposure to air pollution. These include exposure misclassification (through missing exposure data, limitations of the exposure model in capturing long-term personal exposures of multiple pollutant metrics that may be relevant to the outcomes being studied, and lack of information on participants’ mobility) and potentially incomplete adjustment for confounding (through unknown individual and area-level risk factors).
The reasons for the weaker BS–mortality associations in the Collaborative compared with Renfrew/Paisley cohort remain speculative. The BS exposures estimated by MultiBS model in the Renfrew/Paisley cohort area had a relatively small inter-quartile range and range of 6 and 6–29 μg m−3, respectively (compared with 8 and 5–55 μg m−3 for the Collaborative cohort), but the effect magnitudes for Renfrew/Paisley cohort were more elevated for all specific causes except lung cancer. Exposure misclassification, lower number of participants/events, lower susceptibility and/or unmeasured confounding factors may have been important. It is possible that the ‘non-occupational’ nature of the Renfrew/Paisley cohort increased the number of participants who spent more time at their residential address reducing exposure misclassification.
Although the risks of air pollution on lung cancer in the Collaborative cohort were estimated relatively imprecisely because of low number of events, the direction and magnitude of the effect estimated from the MultiBS exposure model (HR 1.11, CI 0.97 to 1.30 for follow-up to 1998) were not inconsistent with the 8% increase risk in lung cancer mortality noted in extended analyses of the ACS cohort.29 It is possible that high smoking rates in the Renfrew/Paisley cohort (>80% of male subjects with a history of smoking and the relatively high overall consumption of cigarettes) may have obscured associations between lung cancer mortality and air pollution estimated from the AMBS and MultiBS exposure models. For reasons that remain unclear, relatively high rates of lung cancer were noted in suburban areas in the south west of the Renfrew/Paisley cohort study area compared with lower rates of lung cancer in the town centre areas of Paisley and Renfrew. Cohort participants in south west Paisley would have been assigned a distance weighted average of the means of the two nearest monitoring sites in relatively polluted parts of the centre of Paisley. As noted above, the IDWBS exposure estimates are prone to this type of limitation compared with the AMBS and MultiBS exposure models and correspondingly the associations observed between lung cancer mortality and IDWBS in the Renfrew/Paisley cohort (table 2) were considered to be anomalous.
Participants’ exposures were based on their residential addresses recorded at recruitment in the 1970s. Information on relocations and recent addresses was unavailable but linkage of the Renfrew/Paisley cohort to a national patient database for Scotland suggested that the majority of survivors (84%) were still resident in the Argyll and Clyde Health Board area in the West of Scotland in 1995.30 This does not however provide information on the extent to which participants may have changed address within this Health Board area and/or within the urban conurbation of Renfrew/Paisley. Thus, exposure misclassification may have resulted from a lack of information about participants’ mobility.
Information regarding some potential risk factors, including smoking and body mass index, was only obtained at the time of recruitment. Hence, adjustments for changes in these factors, which might alter the risks of air pollution on health, could not be made. Information on education level was available for the Collaborative cohort, but not for the Renfrew/Paisley cohort. However, Davey Smith et al.15 have shown that occupational social class can be a stronger predictor of health outcomes than education. Additionally, there is evidence that underlying social inequalities in health in the UK may be related more clearly to current social circumstances rather than childhood circumstances.15
The LAQP exposure models predicting air pollution concentrations include household density and distance to nearest road variables that may be associated with mortality independently of their association with air pollution (as indirect measures of area-level socio-economic conditions). This raises the possibility of confounding.31 However, as pollution climate is highly (and highly plausibly) dependent on the LAQP variables, inclusion of these variables in the survival model presents substantial risk of ‘overadjustment’ and possible obscuration of genuine pollution effects. Given that direct individual measures of long-term pollution exposure are unfeasible (and impossible retrospectively), the estimation of long-term effects of air pollution requires a choice between: (a) definite, and possibly gross, exposure misclassification due to very poor estimation of individual exposures; or (b) more precise estimation of individual exposures that may entail possible confounding by LAQP. The potential for unknown confounding mechanisms accounting for the apparent effect of long-term exposure to particles on mortality is likewise recognised in reviews of scientific issues in air pollution and health research.10
To test further for possible socio-economic confounding, an additional area-level measure of deprivation was added to the standard Cox model.32 This measure has been shown to be related to multiple heath outcomes in the Renfrew/Paisley cohort33 and to modify observed effects of short-term exposure to BS in the general population from which the cohort was sampled.34 Additional adjustment for DEPCAT slightly attenuated the associations between long-term BS exposure and mortality (table 2C,D, table 3), but the overall pattern of association remained broadly consistent with the analyses prior to adjustment for DEPCAT and with the magnitude of pollution effects published in a UK review of the health effects of long-term exposure to air pollution (best estimates (and 95% CI) of relative risk of: 1.06 (1.02–1.11), 1.09 (1.03–1.16) and 1.08 (1.01–1.16) for all-cause, cardiopulmonary and lung cancer mortality, respectively8). Further sensitivity analyses using a shared frailty model revealed similar pollution–mortality associations as in the standard Cox models, with no evidence of confounding by DEPCAT.
The interpretation of this additional adjustment is similarly complicated by the possibility of overadjustment that may obscure underlying effects of pollution exposure as the area-level DEPCAT variable is partly derived from individual-level social class variables; and by the possibility that air pollution has a role in the contextual effect of neighbourhood-level deprivation on mortality.35–37 Complexities of this nature may have contributed to inconsistent evidence found in reviews of the effect of socio-economic status on the relationship between air pollution exposure and health38–39 and are subject to ongoing research developments (eg, using multilevel analytical approaches) which continue to face conceptual and methodological challenges to establishing causal inference.40 The detailed pollution exposure estimates produced for the Midspan cohorts may provide a useful dataset for future research as methodological progress is made. In the meantime, it is re-emphasised that retrospective individual-level exposure estimation is just the best possible estimate of individual exposure within constraints of currently available information and analytical approaches, and that the data in panels A and C, and B and D of table 2 provide a range of HR estimates of the effects of air pollution between possible underadjustment and overadjustment for confounding in the combined exposure and survival models.
Conclusions
The associations between mortality and long-term exposure to BS observed in this study in the UK are broadly consistent with previous evidence from other countries and hypotheses of how particulate matter air pollution may affect human health. The dissimilarity in health effects based on different exposure models highlights the critical importance of reliable estimation of long-term exposures on a fine intraurban spatial scale to avoid potential misclassification problems inherent in air pollution epidemiology studies. The extent of the dissimilarities noted between exposure models re-emphasises that it is likely that inadequate human exposure classification will continue to be one of the most challenging issues to address in future environmental epidemiology research; and this has important implications for the development of fit-for-purpose pollution monitoring and modelling capabilities by local and central governments and their health protection agencies.
Acknowledgments
The authors of this paper gratefully acknowledge funding from the Department of Health (England) Policy Research Programme as part of the Initiative on Air Pollution (Research Grant 0020015). The authors are also particularly grateful for the encouragement and support given by the late David Hole, former Professor of Epidemiology and Biostatistics and Head of West of Scotland Cancer Surveillance Unit in his enthusiastic role in planning and implementing this research.
References
Footnotes
Current address: Christina Yap, MRC Midland Hub for Trials Methodology Research, University of Birmingham, UK
-
Contributors IB conceived the original project idea, acted as project manager, and worked with MH and GC to complete the original manuscript and its revision. CY managed the data, conducted the epidemiological analyses, and produced a draft of the manuscript. CY and CR developed and evaluated the exposure models with assistance from all authors. DH, CR, CH, RA and GM provided input to, and detailed interpretation of, the epidemiological analyses. All authors were involved in drafting the article and revising it critically for intellectual content. IB and CR are guarantors.
-
Disclaimer The views in this paper are those of the authors but not necessarily the Department of Health (England).
-
Competing interests None.
-
Provenance and peer review Not commissioned; externally peer reviewed.