Article Text

Abstract
OBJECTIVES To investigate the relation between local road traffic activity and the occurrence, severity, and persistence of wheeze in children.
METHODS Data on wheeze and asthma were collected in a cross sectional questionnaire survey of 22 968 primary school children (age 4–11) and 27 826 secondary school children (age 11–16) in the Nottingham area. Direct measures of road traffic flow were made in the locality of each school and combined with Local Authority traffic data for major roads to estimate local traffic activity in vehicle metres/day/km2. Assessment of the effects of potential confounders was performed in nested case-control groups of 6576 primary and 5936 secondary children. Data on frequency of wheeze were collected for the cases to study disease severity. Longitudinal data on a historical cohort of 883 children who reported wheeze when aged 4–11 in 1988 were used to study the persistence of wheeze into adolescence.
RESULTS Unadjusted prevalence of wheeze in the past year within schools varied widely but was not associated with traffic activity in the school locality (weighted regression coefficient β=−0.01, p=0.93 for primary schools, β=−0.18, p=0.26 for secondary schools). The risk of wheeze in individual primary school children was not associated with traffic activity analysed as a continuous variable, although there was some suggestion of a weak, non-linear plateau effect. Similar effects were found for diagnosed asthma and recent cough. There was no evidence of any relation between traffic activity and risk of wheeze in secondary school children. There were positive but non-significant dose related effects of traffic activity on wheeze severity in primary and secondary children and on persistence of wheeze in the longitudinal cohort.
CONCLUSIONS Traffic activity in the school locality is not a major determinant of wheeze in children.
- wheeze
- traffic pollution
- children
Statistics from Altmetric.com
The role of air pollution in the aetiology of asthma, particularly among children, remains ill defined. Ambient exposure to pollution seems to aggravate symptoms in children with asthma,1 2 but empirical evidence suggests that these exposures are not responsible for the increase in prevalence of childhood asthma found over recent decades in the United Kingdom3 4 as ambient concentrations of sulphur dioxide, particulates, nitrogen dioxide, and ozone have remained static or have fallen over this period.5 However, this overall trend in levels of pollution conceals a steady increase in the contribution of exhaust emissions from road vehicle traffic,6 suggesting that adverse effects of pollutants from motor vehicles may be important. Exhaust emissions from motor vehicles comprise a mixture of numerous pollutants, not all of which are currently measured and some of which are likely to interact with each other. To investigate the relation between risk of wheeze and traffic pollution, we have therefore chosen to use an objective measure of local traffic activity as a marker of exposure to the overall pollution mix arising from vehicle exhausts, rather than try to relate concentrations of individual pollutants to respiratory illness in children. Previous studies of the association between respiratory illness in children and objectively measured road traffic density have reported contradictory findings.7-10 This study investigates the relation between the prevalence, severity, and persistence of wheeze and traffic activity in the locality of schools in and around Nottingham.
Methods
STUDY SCHOOLS
All 135 primary and 44 secondary schools in a postcode area around Nottingham used in previous prevalence surveys11 12 were asked to participate, and all but eight primary schools agreed. Seventy six schools (44%) were located within Nottingham City; the remainder were in surrounding urban districts and rural villages.
CROSS SECTIONAL PREVALENCE DATA
Data on wheeze and asthma were collected for primary school children by a parental questionnaire, based on that used in the previous surveys,11 12 distributed for all children registered in the study schools in June 1995.13 The same data were obtained from secondary school pupils with a self administered questionnaire distributed to all children in early 1996.14 More detailed information on exposures in early life and other potential confounders, including maternal age, birth weight, preterm birth, duration of breast feeding, number of older siblings, parental smoking, and parental occupation, was obtained by a questionnaire sent to parents of nested case-control groups. Cases were all children with reported wheeze in the past year, and controls were children without recent wheeze taken from one in four random subsamples of all respondents to the primary and secondary surveys. This questionnaire also collected information on recent cough, and for the cases of wheeze, details of frequency of wheeze symptoms. Severe wheeze was defined as >10 wheezing attacks in the past year. The questions asked on wheeze, asthma, and cough are given in the .
LONGITUDINAL DATA
Persistence of wheeze was studied in a group of children in whom the same parental wheeze questions had previously been given in a survey of a random sample of three quarters of primary schools in the study area in 1988.12 During 1995–6 we identified all children who reported a history of wheeze in the 1988 survey and who were still attending schools in the county in 1995. The same detailed questionnaire that was sent to the nested case-control groups was sent to each child's parent to establish the child's current wheezing status and details of potential confounding factors.
MEASUREMENT OF TRAFFIC FLOW
Traffic flows were measured on roads in the vicinity of the study schools and used to derive a continuous measure of traffic density (the traffic activity index (TAI)) for those 1 km2 gridsquares of an ordnance survey map containing a school. For roads in the immediate vicinity of the schools, we measured flows with portable Marksman systems (Golden River Traffic, Bicester, UK) in early 1996. Monitoring tubes were laid down during term time, positioned where traffic was free flowing and where possible, left for at least 2 school days so that measurements were collected for both peak and off peak hours. Traffic flow measurements for other major non-residential through roads in the 1 km2 square were obtained from Nottinghamshire County Council routine monitoring data where available, and for the 42% of non-residential roads where no data had been collected, flows were estimated with data collected on roads of comparable type and location. Flows on all residential streets were estimated according to the number of houses and the type of street (through road, access road, or cul-de-sac). Flow measurements were standardised to allow for daily and monthly fluctuations with scaling factors provided by Nottinghamshire County Council to produce an average annual daily total. The TAI was calculated for each 1 km2 gridsquare in which a school was located by multiplying the length of road in the gridsquare by the average annual daily total assigned to that road, and summing over all roads in the gridsquare. Any schools located on the border of two gridsquares were assigned the average of the two TAIs. Units for the TAI are vehicle metres/day/km2—that is, the total number of metres travelled by vehicles in one kilometre square area over a period of one day.
ANALYSIS
Data were entered with SPSS data entry II software package (SPSS, Chicago, IL, USA) and analysed in SPSS-PC (version 7). Because of the different methods of collection of information on wheeze, analyses were carried out separately for primary and secondary school children. The primary outcome variable was “wheeze in the past year”. However, analyses of the cross sectional data were also carried out on “currently active, doctor diagnosed asthma”, defined as those reported to have wheezed in the past year and been treated by a doctor for chest trouble in the past year with a diagnosis of asthma,13 and on “cough in the past year” (one in four random subsample only).
A geographical map of study schools by level of TAI was drawn up with the software programme ARC/INFO PC (Environmental Research Systems Institute, Redlands, CA, USA) with grid references from the 1995 central postcode directory,15 and county boundaries from the 1991 census digitised boundary data.16
An ecological analysis with schools as the units of analysis was first carried out on the data to assess the univariate association between TAI and school prevalence of wheeze and asthma. A weighted linear regression analysis was performed, with the inverse of the variance of the school prevalence estimate as the weight variable. This was so that the less precise estimates based on small numbers of children were given less weight. The relation between TAI and wheeze was then further explored at an individual level with control for potential confounders. Multiple logistic regression analyses were carried out on the prevalence data sets, with adjustment for age and sex, and on the nested case-control data sets with additional adjustment for early life and lifestyle factors. Similar analyses were performed for asthma in the prevalence data sets, cough in the cross sectional subsamples, severe wheeze in our cases of current wheeze, and wheeze in the past year (persistent wheeze) in the 1988 cohort. In our primary analysis, TAI was analysed as a continuous variable. Where there was no significant effect of TAI expressed in this way, we investigated in a secondary analysis the possibility that the relation may be non-linear by fitting TAI as a three level factor with tertiles representing low, medium, and high exposure.
POWER
For the regression analysis based on 127 primary schools, the study provided 90% power to detect a linear relation with a correlation coefficient of 0.28, equivalent to 8% of the variation in school prevalences being explained by differences in TAI. The 44 secondary schools provided 90% power to detect a coefficient of 0.45 (20% variation).
The study was approved by the Nottingham Director of Education and Nottingham City Hospital ethics committee.
Results
PREVALENCE DATA
Prevalence questionnaires were returned for 22 968 primary (83% response, 51% boys) and 27 826 secondary school pupils (86% response, 51% boys). The prevalence of wheeze in the past year was 15.1% in primary and 19.0% in secondary school children, and prevalence of currently active diagnosed asthma was 8.8% in primary children and 8.3% in secondary school children.
TRAFFIC FLOW DATA
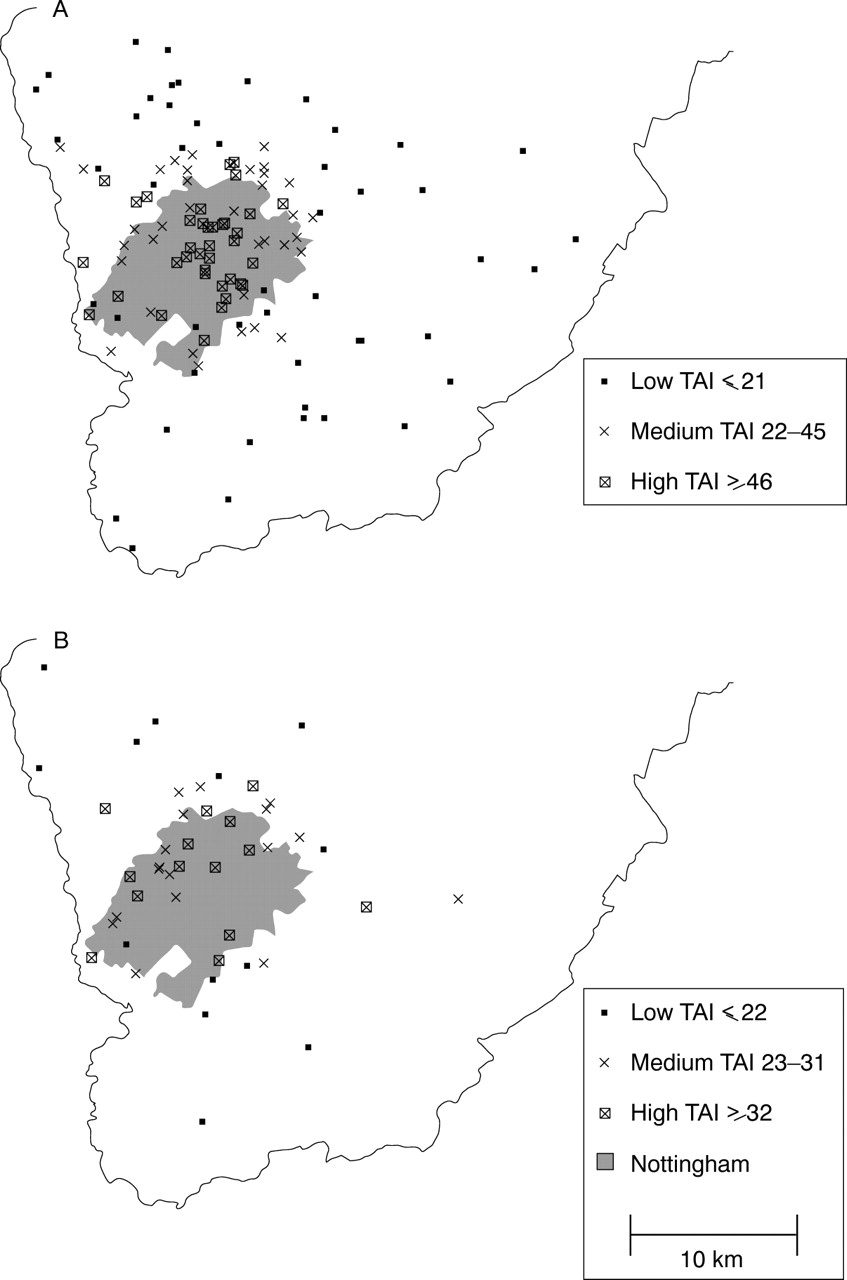
Schools with the highest TAIs were located mainly within urban areas of Nottingham (fig 1). Primary school TAIs (given to the nearest million) ranged from 0 to 117 million vehicle metres/day/km2 with one clear outlier of 247 and one missing value. Secondary school values ranged from 8 to 84 million vehicle metres/day/km2, with one outlying value of 153. These outliers were initially excluded from the linear regression analyses of schools, but analyses were repeated with the outliers included. The tertiles used to define the exposure categories are given in the keys to figure 1.

Map of south Nottinghamshire showing (A) primary schools, and (B) secondary schools by traffic activity index (TAI).
ECOLOGICAL ANALYSIS OF SCHOOL PREVALENCE AND TAI
Individual primary school prevalences of current wheeze varied significantly from 3.1% to 21.5% (p<0.001) and secondary school prevalences from 11.9% to 26.7% (p<0.001). There was no association between TAI and primary school prevalence of wheeze (weighted regression coefficient β=−0.01, p=0.93, fig 2 A) and a non-significant negative relation for secondary schools (β=−0.18, p=0.26, fig 2 B). The findings for asthma were similar, with school prevalence estimates wide ranging (1.5%–17.9%, p=0.003 for primary schools and 4.4%–13.0%, p=0.004 for secondary schools), but showing no significant positive relation with TAI (β=0.10, p=0.28 for primary schools and β=−0.26, p=0.09 for secondary schools). Inclusion of the outlying schools in the analyses resulted in coefficients near zero for both primary (β=−0.08 and −0.02 for wheeze and asthma respectively) and secondary schools (β=−0.02 and 0.04 respectively).

Prevalence of wheeze in past year for (A) primary schools and (B) secondary schools by traffic activity index (TAI).
LOGISTIC REGRESSION ANALYSES OF INDIVIDUAL CHILDREN
The logistic regression analysis of wheeze status for individual primary school children resulted in no significant relation between wheeze in the past year and TAI, fitted as a continuous variable (p=0.82, table 1). However, when TAI was fitted as a factor to look for a non-linear effect, significantly higher odds ratios (ORs) of wheeze were found for medium and high TAI than for low (age and sex adjusted ORs 1.11 (95% CI 1.02 to 1.22) and 1.13 (1.03 to 1.24) table 1). A similar relation was found between asthma and TAI (OR of 1.16 (1.02 to 1.31) for medium TAI, and 1.16 (1.02 to 1.32) for high TAI, relative to low TAI). The relation between TAI and recent cough, examined in the random subsample of survey respondents (n=4570), was slightly stronger and also significant with ORs of 1.21 (1.02 to 1.44) for medium TAI and 1.22 (1.02 to 1.45) for high TAI.
Odds ratios for current wheeze in primary school children in relation to traffic activity near the child's school
The case-control set of 2648 primary school cases and 3928 controls (78% response) was used to control for social class and the major confounders in this data set, which were preterm birth (born ⩾3 weeks early), maternal age, and breast-feeding. After adjustment, there remained no significant effect of TAI, expressed as a continuous variable, on wheeze, asthma, or cough. Adjusted ORs for medium and high tertiles of exposure remained increased at 1.08 and 1.11 relative to low TAI, although in this smaller sample, the significance of the effect was reduced. Control for these confounding factors in the random subsample resulted in ORs of 1.02 (0.78 to 1.34) and 1.06 (0.80 to 1.41) for asthma, and 1.11 (0.93 to 1.34) and 1.15 (0.95 to 1.39) for recent cough. However, the ORs for asthma adjusted for age and sex only were lower in this subsample, and adjustment for confounders had only a small modifying effect.
There was no significant linear association between TAI and self reported wheeze in the past year in the secondary school children, or in the case-control sample of 5936 secondary pupils (58% response), before or after adjustment for age, sex, social class, and maternal smoking in the first 5 years of life, the risk factor in this data set (table 2). No significant association was found for TAI analysed as a factor, and if anything, the ORs for medium and high exposure were slightly reduced (table 2). No significant relations between asthma or cough and TAI were found.
Odds ratios for current wheeze in secondary school children in relation to traffic activity near the child's school
Among both the primary and secondary school children with recent wheeze, the risk of severe wheeze was positively associated with TAI (adjusted ORs of 1.03 and 1.02 per 10 unit increase in TAI), but the linear associations did not reach significance (table 3). Inspection of the ORs for the tertiles showed non-significant increases in risk in those exposed to medium and high traffic activity compared with low activity.
Odds ratios for parent reported severe wheeze (>10 attacks in past year) in current wheezing children in relation to traffic activity near the child's school
LONGITUDINAL DATA
Of the 1330 children now attending secondary schools in the county who reported a history of wheeze in our 1988 survey, we were able to obtain data on 883 (66%) and assign a TAI to 765 children currently attending study schools. Persistence of wheeze was reported in 46% of this sample, and was found to have a weak linear relation with TAI (age and sex adjusted OR 1.05 (1.00 to 1.11) per increase in 10 million vehicle metres/day/km2, p=0.06, table 4). Adjustment for social class, parental smoking, or early life factors made little change to the relation.
Odds ratios for persistence of wheeze into adolescence in relation to traffic activity near the child's current school
Discussion
It is important to establish whether exposure to traffic pollution has a significant effect on respiratory health in children. Previous studies of this question have been of low power, or have tended to use subjective self reported measures of traffic exposure. We have conducted a study of a large sample of school children, with an objective measure of traffic density as a marker of exposure to the real life pollution mix arising from vehicle exhausts. Our ecological analysis at a school level showed substantial variation in the prevalence of wheeze between both primary and secondary schools in our study, which, although likely to be due in part to differences in diagnostic recognition and labelling, suggests that local environmental exposures have a major influence on the prevalence of asthma. However, our findings also suggest that very little of this variation between schools was attributable to differences in traffic activity in the locality of the schools. Although this does not rule out any effect of traffic activity on the risk of wheeze, it does suggest that other factors are likely to be more important. As the use of ecological analyses has certain problems, particularly the difficulty of dealing with confounding at the level of the individual child as opposed to the level of the population unit, we also carried out analyses at an individual level to determine whether local traffic activity has an effect on a child's risk of wheeze with control for potential confounders. We found no evidence of a linear dose-response relation between TAI and wheeze, asthma, and cough. We did, however, identify evidence of a non-linear relation between exposure to traffic activity and occurrence of wheeze in primary school children, whereby children in areas of TAI in the middle and highest tertiles had a greater risk of wheeze than those in the lowest tertile, but with no difference in risk between the middle and highest tertiles. Similar effects were found for asthma and cough. This investigation of non-linear effects of TAI was a secondary analysis in this study and in view of the non-significant continuous relation, these findings may not be genuine. Nevertheless, if valid, these findings would have important implications for future studies, and we therefore include these results here.
To allow comparisons of our prevalence data with those from previous surveys in the same area, we needed to use the same questions to elicit information on symptoms as in our previous studies.11 12In fact these were very similar to the internationally validated questions used in the international study of asthma and allergies in childhood (ISAAC) studies.17 To measure exposure, we have concentrated on traffic activity in the vicinity of the child's school as children spend about one third of their daylight hours at school, a time when pollution levels are highest. But as a child's total exposure is also influenced by home and other exposures not measured here, some degree of error in assigning traffic exposure to school populations is inevitable. Further misclassification may have arisen from the estimation procedure used to assign flows to some roads, or from unmeasured influences from adjacent gridsquares. However traffic flows were measured blind to school prevalence and are therefore likely to be unbiased and any misclassification error would therefore tend to have resulted in underestimates of the true size of effects. This could explain the weaker associations among the secondary school children, who tend to live further away from their school than primary school children and are therefore subject to greater misclassification. We explored the possibility of confounding by factors including social class, preterm birth, maternal age, low birth weight, older siblings, parental smoking, and breast feeding, and found these to have only a small influence on each of the relations found. As data on these early life factors were collected retrospectively, there may be a problem with poor recall, which if less common among those with respiratory problems, could have resulted in bias.
The lack of a significant effect of TAI fitted as a continuous variable on risk of wheeze in primary school children is inconsistent with the significant plateau effect identified for TAI fitted as tertiles, and therefore places doubt on the stability of the results at the level of an individual child. Furthermore, the significance of the non-linear effect is based on SEs that are likely to be underestimated as a result of applying exposure from an area level to an individual child. Therefore the plateau effect found may simply be a chance result, or due to unmeasured confounders, and should be interpreted with caution. Even if a true effect, reductions in traffic activity would have to be extreme to have any public health impact and such reductions are unlikely to be achievable.
The few previous studies to look at the relation between symptoms of asthma and objective measures of traffic flow in preadolescent children have reported significant positive associations between reporting of respiratory symptoms and traffic counts, although none has investigated the shape of the exposure-response curve for symptoms.7 8One possible explanation for the plateau effect found in this study in primary school children is that traffic flows in the Nottingham area are generally high and may have reached a level of exposure for most of the population in which the exposure-response curve is relatively flat. The size of the effects identified are fairly small and amount to about a 10% increase in risk of asthma symptoms at levels of exposure above 22 million vehicle metres/day/km2, although this may be underestimated by misclassification. It is also possible that TAI, which is a measure of exposure for a 1 km2 area, may not reflect the most relevant exposure of an individual child. There is evidence to suggest that more localised exposure could be important as substantial contrasts in concentrations of oxides of nitrogen, carbon monoxide, and particulates have been reported to exist across distances of <100 m.18 Most previous studies looking at fairly localised measures of exposure to traffic have reported positive effects on respiratory health.8 10 19-23 However, many of these used self reported measures of exposure, which are likely to be biased, and one large study of prescribing rates for asthma showed no effect.24 Therefore there is a need to further explore the weak effect of exposure to traffic found in this study with a more precise measure of the localised exposure.
Our additional studies of severity and persistence of wheeze suggest a possible dose-related effect of traffic activity on severity among symptomatic school children, which supports previous reports of the effects of pollution on asthmatic children,25-27 and a similar effect on the persistence of wheeze into adolescence. However, these analyses were subject to relatively low power, and the effects found did not reach significance. Furthermore, in the longitudinal study we were only able to look at traffic activity near the child's current school, which is not a very accurate estimate of exposure for those children who moved during the follow up period. When the analysis was repeated on just those who had lived in their current house for at least 7 years (n=546, 71%), the OR for high TAI was reduced to 1.05. Some loss to follow up also occurred, which may have resulted in selection bias. Therefore, the associations found in these subsets need to be explored in larger studies.
To conclude, these findings suggest that the level of traffic in the 1 km2 area surrounding a child's school is not an important determinant of the prevalence of wheeze in a school. Our study suggests that if there is any relation between traffic density and disease risk, it is that primary school children living in the lowest tertile of exposure in Nottingham (<22 million vehicle metres/day/km2) experience slightly lower risk of wheeze and cough symptoms than children exposed to higher levels. The fact that the effect of traffic activity in a child's local area on asthma symptoms seems to be only small, may be due to insufficiently large contrasts in pollution levels at this scale across our study area, in which case the effects of more localised exposure at home and school need to be explored in future studies.
Acknowledgments
We thank Peter Housden, Director of Education, Julia Swan, Assistant Director, and Tony Dessent, Senior Assistant Director, of Nottinghamshire County Council for their permission and support for the study, and the school teaching and secretarial staff who made the survey work possible. We thank Jennifer Hill for advice on study design, and Marilyn Antoniak, Andrea Goldsmith, Chris Smith, Nicola Williamson, and Mike Priddey for their help with data collection. The mapping work is based on data provided with the support of the ESRC and JISC and uses boundary material which is copyright of the Crown and the ED-LINE consortium. The CPD material from Crown copyright records has been made available through the Post Office and The Data Archive. The study was funded by the National Asthma Campaign and the Department of Health.
RESPIRATORY HEALTH QUESTIONS ASKED ON PARENTAL QUESTIONNAIRES
(1) Has your child ever had attacks of wheezing in the chest? (A noisy whistling sound from the chest, not the throat, causing tightness and breathlessness.) YES/NO
(2) Has your child had any wheezing attacks in the past year? YES/NO
IF YES, how many? 1–4 times 5–10 times >10 times
(3) Has your child been treated by a doctor for chest trouble in the past year? YES/NO
IF YES, what have you been told is wrong with your child?
..............................................................
(4) Has your child had troublesome coughing (especially at night), other than when he/she had a cold or chest infection, in the last year? YES/NO
NOTE: Questions in italics were on detailed parental questionnaires only.
RESPIRATORY HEALTH QUESTIONS ASKED ON THE SECONDARY SCHOOL SELF COMPLETION QUESTIONNAIRE WERE:
(1) Have you ever had attacks of wheezing in the chest? (A noisy whistling sound from the chest, not the throat, causing tightness and breathlessness) YES/ NO
(2) Have you had any wheezing attacks in the last year? YES/NO
(3) Have you been treated by a doctor for chest trouble in the past year? YES/NO
IF YES, what have you been told is wrong with you?
..............................................................