


Abstract
Variability of airway function is a feature of asthma, spanning timescales from months to seconds. Short-term variation in airway resistance (Rrs) is elevated in asthma and is thought to be due to increased variation in the contractile activation of airway smooth muscle. If true, then variation in Rrs should decrease in response to bronchodilators, but this has not been investigated.
Using the forced oscillation technique, Rrs and the variation in Rrs from 4–34 Hz were measured in 39 children with well-controlled mild-to-moderate asthma and 31 healthy controls (7–13 yrs) before and after an inhaled bronchodilator (200 µg salbutamol) or placebo.
In agreement with other findings, baseline Rrs at all frequencies and the sd of Rrs (Rrs sd) below 14 Hz were found to be elevated in asthma while neither forced expiratory volume in one second nor the mean forced expiratory flow between 25 and 75% of forced vital capacity were different compared with controls. The present authors found that Rrs sd changed the most of any measurement in asthma, and this was the only measurement that changed significantly more in children with asthma following bronchodilator administration.
The present results show that like airway narrowing, short-term airway variability of resistance may be a characteristic feature of asthma that may be useful for monitoring response to therapy.
The forced oscillation technique (FOT) to measure impedance of the respiratory system is increasingly being used to assess lung function. This is especially the case in young children or in adult populations where spirometry is not feasible, as the FOT does not require a learned manoeuvre 1–5.
Airway resistance (Rrs) is the most widely reported measurement from the FOT; however, this has been shown to be more variable than forced expiratory volume in one second (FEV1) in terms of measurement repeatability, day-to-day measurement variation and week-to-week measurement variation 6, 7. The present study examined whether this variability may be functionally important and possibly indicative of airway pathology. Indeed, asthma is an episodic disease leading to variation in symptoms and lung function tests that occur over time scales ranging minutes to hours, days, months and even years 8.
QUE et al. 9 recently demonstrated that variation of Rrs recorded over 15 min was elevated in adult asthma and in healthy individuals following the administration of a contractile agonist. These data suggested that increased variation in asthma was due to increased activity of the airway smooth muscle 9. If true, then airway variation should be reduced in response to bronchodilators in asthma and, therefore, could be useful as a measure of the effect of a bronchodilator (BD) in reducing airway diameter variation. To confirm this hypothesis, the present study examined FEV1, Rrs and the variability of Rrs at baseline and following BD administration in children with asthma and healthy children as controls.
METHODS
Population
Asthmatic subjects were diagnosed with asthma by a physician based on their symptoms at an average age (mean±sem) of diagnosis of 3.39±0.38 yrs. The asthmatic children were recruited and tested at Camp Treasure Chest, a camp for asthmatic children sponsored by the Nova Scotia Lung Association (Canada). Control children had no history of lung disease or respiratory complaints and were tested at the Isaac Walton Killam (IWK) Health Centre, Pulmonary Function Lab (Halifax, NS, Canada). The children's parents signed a written informed consent form prior to the start of any study procedures and the study was approved by the research ethics board of the IWK Health Centre.
Study design
Subjects withheld all short- and long-acting β2-agonist medications on the day of their participation in the study. The test protocol followed for each child began with three 1-min FOT measurements with 20–40 s breaks after each minute. The breaks allowed the subject to swallow or cough if desired, which occurred occasionally. This established a baseline FOT measurement and was followed by baseline spirometry and by another FOT measurement to assess any changes that may have occurred from the deep inspirations and forced expirations associated with spirometry. A BD (200 µg salbutamol) was then administered by a metered-dose inhaler (MDI). A group of 15 of the control children were given a placebo inhalation (propellant-only MDI) instead of a BD as a control. FOT measurements were made at 4–5 min intervals following BD, and spirometry measurements were made at 12–15 mins, followed by three 1-min post-BD FOT measurements were short breaks in between, as performed during baseline FOT. The final three 1-min FOT and spirometry measures were used to assess changes due to a BD and to compare these results between patient populations.
Spirometry
Flow–volume curves were recorded with a portable, pneumotachograph-based spirometer (PrestoFlash; Burdick Inc., Milton, WI, USA) to determine FEV1 and the mean forced expiratory flow between 25 and 75% of forced vital capacity (FEF25–75%). The spirometer was calibrated daily with a calibrated syringe. Acceptance of flow–volume curves was according to the American Thoracic Society criteria for children 10. Results were expressed as the percentage of predicted values according to Knudson et al. 11.
FOT
FOT measurements were made using a custom-built FOT device (fig. 1⇓) constructed at Dalhousie University (Halifax). Subjects spontaneously breathed through a mouthpiece (FreeFlow; SensorMedics, Yorba Linda, CA, USA) and bacterial filter (Collins DC-1; Ferraris Respiratory, Louisville, CO, USA) wearing nose-clips, cheeks clasped in their hands, while comfortably seated with the head in a neutral position. The device used a loudspeaker to produce low-amplitude pressure oscillations (∼1 cmH20) with a frequency range >50 Hz. A Fleisch pneumotachograph with a differential pressure transducer (TD-05-AS; SCIREQ, Montreal, QC, Canada) and a common mode rejection ratio measured to be >60 dB was used to measure flow, and a pressure transducer (TD-05-AS; SCIREQ) was used to measure pressure at the patient's airway opening. Both signals passed through a signal conditioner (SC-24; SCIREQ) for anti-alias filtering with 6-pole Bessel filters (cut-off 100 Hz) and were sampled at 700 Hz. A bias fan provided a constant flow of ∼12 L·min−1 of fresh air via long, high inertance, stiff-walled tubes (1.9 cm×176.5 cm length). Flow and pressure were calibrated weekly and the device was verified with a 5 cmH2O·L−1·s−1 constant flow resistor (Hans Rudolph, Kansas City, MO, USA).

The forced oscillation technique device creates oscillatory pressure at the loudspeaker which is transmitted to the patient airway via a mouthpiece. Fresh air is supplied by a bias fan to the patient via long, high inertance tubes which shunt much of the low frequency breathing prior to the pneumotachograph and pressure transducers.
A signal with low crest factor (peak-to-peak amplitude/SD 12) was designed that comprised frequency components of 4, 6, 10, 14, 22, 26 and 34 Hz of 1 s duration, which were repeatedly applied at the patient's airway opening during spontaneous breathing. The frequencies were higher than breathing to avoid contamination from the breathing frequencies and are the prime numbers multiplied by two to largely eliminate harmonic distortion from any nonlinearities 13. The magnitude of pressures at 4, 6 and 10 Hz was increased by 3.6, 2.4 and 1.4 times, respectively, to improve signal-to-noise ratio.
Data analysis
Figure 2⇓ is an example of the pressure and flow data obtained from one subject. For both pre- and post-BD FOT measurements, three 1-min data sets were concatenated to give 3 min of pressure and flow data. The impedance to airflow measured at the transducer (Zmeas) was derived at each of the input frequencies from either 1-s nonoverlapping blocks or 4-s 75% overlapping blocks of the pressure and flow signals according to:  where ƒi denotes calculation at one of the 7 frequencies (i = 1–7), and P(ƒ) is the Fourier transform of pressure and V′(ƒ) is the Fourier transform of flow. Thus Zmeas was a time-series of 180 points. Blocks of 1-s were used for calculation of sd as described below to capture as much variation as possible, while 4-s blocks were used for calculation of median resistance, which provided a small improvement in estimation of median Rrs (<5%) particularly at low frequencies.
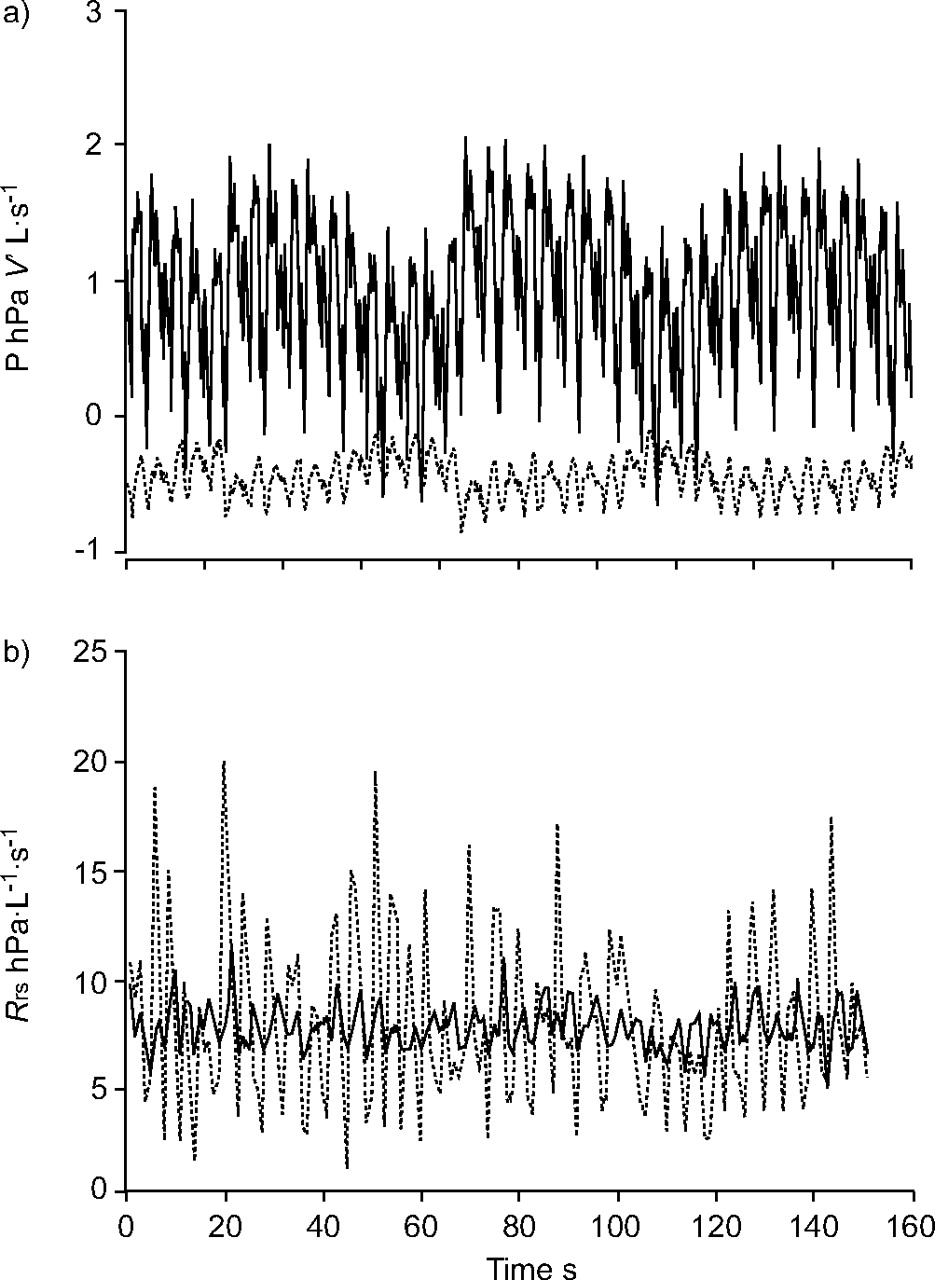
Flow (V′) and pressure (P) contained seven frequencies repeating every second from 4–34 Hz. a) 10 s of baseline P (–––) and V′ (……) recorded from one individual. b) 150 s of baseline airway resistance (Rrs) from a subject calculated once per second from 4 Hz (–––) and 34 Hz oscillations (……).
The impedance of the FOT system proximal to the patient was compensated for by measuring closed system (mouthpiece blocked) and open system (mouthpiece open to the atmosphere) impedances ensuring coherence >0.99 and computing impedance to airflow measured at the airway opening (Zrs) 14. The resistance to airflow, Rrs, was calculated as the real part of Zrs (fig. 2b⇑); reactance was not analysed in the present study. The sds of resistance (Rrs sd) were evaluated at each oscillation frequency from the time series of Rrs as:  where sd denotes calculation of standard deviation.
Pressure and flow data that appeared to be associated with glottis closure, swallowing or episodes of irregular breathing were discarded. Rrs values >5 sds above the mean were discarded, as well as rare negative Rrs values probably caused by the subject's breathing occasionally generating flow components which contaminated the signal frequencies. Blocks of 1-s pressure and flow were discarded until coherence calculated over a 16-s window was >0.9 for all data analysed 15. Furthermore, noise amplitude was estimated at a frequency from the average amplitude of the pressure and flow spectra at neighbouring nonsignal frequencies (e.g. for 10 Hz the average of 8, 9, 11 and 12 Hz was used) and cycles rejected with any component having signal-to-noise ratio <10.
Statistical methods
Rrs, Rrs sd, FEV1 and FEF25–75% were tested for normality in each patient population using Shapiro–Wilk normality tests as well as normality plots. Baseline measurements of FEV1, FEF25–75%, Rrs and Rrs sd were each compared between the two patient populations using unpaired t-tests. The effect of a BD was assessed between asthmatics and controls using separate one-way repeated measures ANOVA for each of FEV1, FEF25–75%, Rrs and Rrs sd measures. The difference between placebo and BD administration in controls was assessed with another separate, one-way repeated measures ANOVA for each of FEV1, FEF25–75%, Rrs and Rrs sd measures. The effect of a BD was also assessed in asthmatics classified by severity according to the Global Initiative for Asthma (GINA) guidelines 16, and in controls with a one-way repeated measures ANOVA and Games–Howell post hoc tests. Statistical significance was determined by p<0.05, unless otherwise stated.
RESULTS
The results were organised into baseline comparisons between asthma and control subjects first, followed by comparisons of the effect of a BD between populations as well as subpopulations of asthma classified according to disease severity. Shapiro–Wilk normality tests and normality plots indicated that spirometry and FOT measurements were all approximately normally distributed.
There were no significant differences in age or height between asthmatic and control subjects (table 1⇓), and asthmatic subjects were slightly heavier (p = 0.045). The subjects with asthma were taking different medication combinations as follows: six were taking as needed short-acting β2-agonist (SABA) alone (salbutamol 200 µg); 13 were taking inhaled corticosteroid (ICS) plus as needed SABA (fluticasone proprionate 125–250 µg b.i.d. and salbutamol 200 µg); four were taking a leukotriene receptor antagonist (LTRA; montelukast 5–10 mg q.d.) plus as needed SABA; 15 were taking combination ICS plus long-acting β2-agonist (LABA) with as needed SABA; half were also taking a LTRA (eight out of 15 taking fluticasone proprionate 200–500 µg q.d. or salmeterol 50 µg q.d. and seven out of 16 taking budesonide 200–400 µg q.d. or formoterol 12 µg q.d.).
Subject characteristics
Baseline comparisons
There was no difference in baseline measurements of per cent predicted FEV1 between asthmatic and control subjects (p = 0.509), with mean±sem of 98.4±2.4 and 100.6±2.1% of predicted values respectively. There was a larger but still not significant (p = 0.105) difference between baseline FEF25–75% measurements, 85.5±3.2 and 94.4±4.6% of predicted values in asthmatic and control subjects, respectively. Thus, neither FEV1 nor FEF25–75% distinguished between the asthmatic and control subject groups at baseline.
At baseline, Rrs was higher in asthmatics at all frequencies (p<0.001), and Rrs SD was also higher in asthma at 4, 6 and 10 Hz (p<0.001, p = 0.035 and p = 0.018, respectively, fig. 3⇓). Rrs was constant across frequencies in control subjects, but a decreasing dependence with frequency was detected in asthmatics as a significant negative slope. There was no change in Rrs or Rrs sd before and after the FEV1 manoeuvre.

a) Median baseline airway resistance (Rrs) and b) Rrs sd in asthmatics (▪, n = 39) and control subjects (□, n = 31). At baseline, Rrs was elevated in asthma at all frequencies compared with control (p<0.001 (a)), while Rrs sd was elevated in asthma below 14 Hz (*: p<0.06) compared with controls. Error bars indicate sem.
Effect of a BD
The subjects with asthma were well controlled by spirometry at the time of measurement. Breathing frequency and tidal volume by integrated flow was not changed with BD in any group. In response to BD, only two out of the 39 asthmatic children showed changes in FEV1 >12%, a threshold indicating clinically significant reversibility 17, and only one of these subjects had a >20% increase in FEF25–75%.
The FOT measures of Rrs and Rrs sd were divided into three frequency ranges to simplify analysis: the average of 4 and 6 Hz measurements was considered low frequency; the average of 10 and 14 Hz was considered middle frequency; and the average of 22, 26 and 34 Hz was considered high frequency. Within asthmatic subjects there was considerable overlap between pre- and post-BD Rrs, Rrs sd and FEV1 measurements (fig. 4⇓). Comparing pre-BD measures within figure 4⇓ as well as middle frequency values using linear regression, FEV1 showed a weak linear correlation with Rrs, with r2 = 0.20, 0.16 and 0.21 (p = 0.0117, 0.0260, 0.009) for low, middle and high frequencies, respectively, while FEV1 was not correlated with Rrs sd at any frequency range. Rrs was better correlated with Rrs sd with r2 = 0.40, 041, 0.39 (p = 0.00016, 0.00013, 0.00022) also at low, middle and high frequencies, respectively. Asthmatic subjects with higher Rrs sd values were clustered at lower FEV1 (figs 4c⇓ and d⇓) and higher Rrs (figs 4e⇓ and f⇓).

Baseline (•) and post-bronchodilator (□) values for each asthmatic child for low frequencies (a, c and e) and high frequencies (b, d and f). Values from different subjects overlap substantially for all parameters. Rrs: airway resistance; Rrs sd: standard deviation of airway resistance; FEV1: forced expiratory volume in one second; % pred: percentage predicted.
The comparison of the response to BD between control and asthmatic subjects in Rrs, Rrs sd, FEV1 % pred and FEF25–75% % pred is summarised in figure 5⇓. No measurement changed in controls given a placebo. FEV1 and FEF25–75% increased significantly in controls (mean±sem 3.1±1.3 and 12.7±1.9%, respectively) and asthmatics given a BD (4.8±0.7 and 7.8±2.8%, respectively). These increases were small and not clinically significant, and were not significantly different between control and asthmatic children.
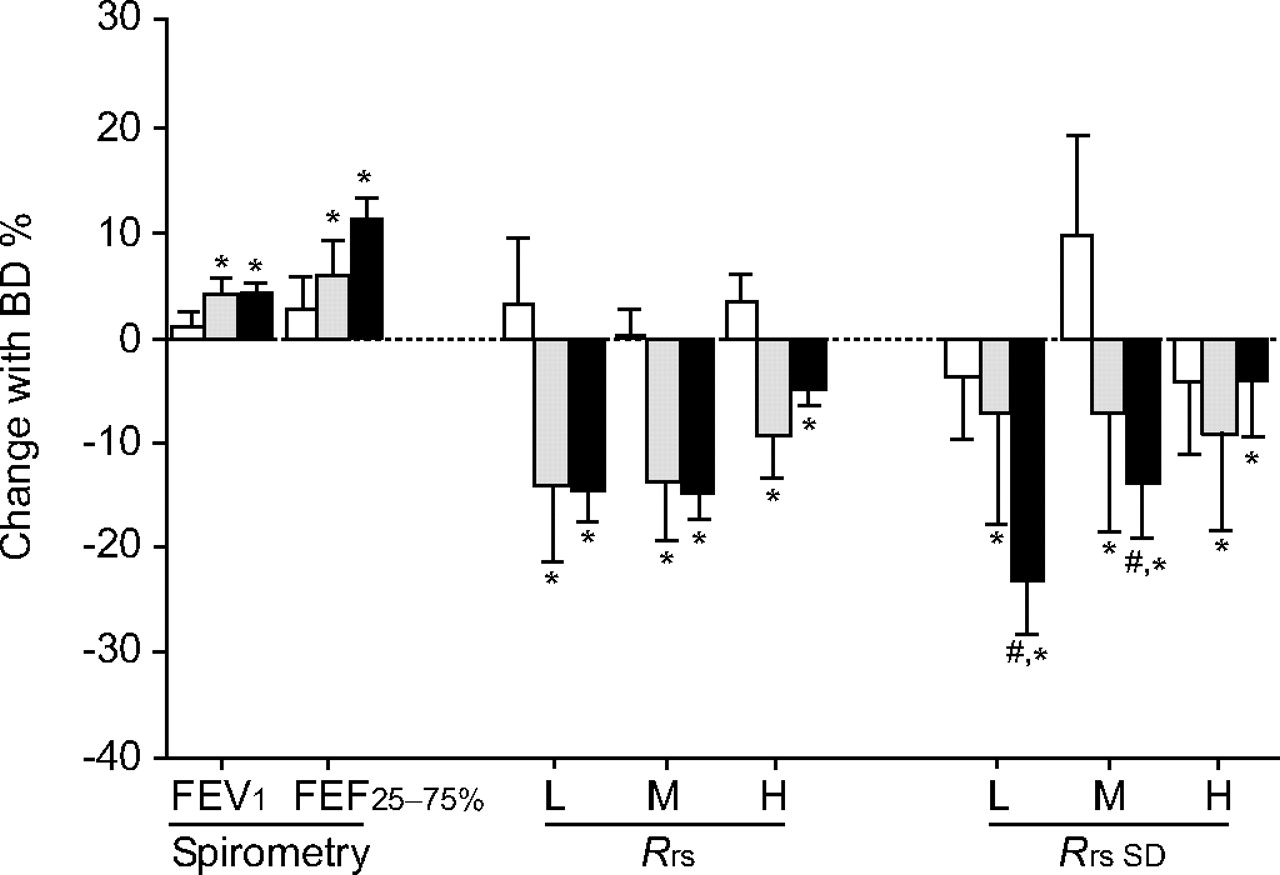
Comparison of the effect of a bronchodilator (BD; 200 µg salmeterol) measured by spirometry (% predicted forced expiratory volume in one second (FEV1) and mean forced expiratory flow between 25 and 75% of forced vital capacity (FEF25–75%)) and the forced oscillation technique (airway resistance (Rrs) and Rrs sd at low (L), medium (M) and high (H) frequencies) in asthmatic subjects (n = 40, ▪), control subjects given a BD (n = 16, ░) and control subjects given a placebo (n = 15, □). *: p<0.05, BD significantly increased FEV1 and FEF25–75%, and decreased Rrs at all frequencies in both control and asthmatic subjects. #: p<0.05, comparing asthmatic and control subjects administered BD, only Rrs sd decreased significantly more in asthmatics. Error bars indicate sem.
Rrs decreased significantly at all frequencies in both asthmatics and controls given a BD but not differently between groups (fig. 5⇑). Similarly, Rrs sd decreased significantly at all frequencies in both asthmatics and controls given a BD, but in this case, Rrs sd changed significantly more in asthmatics than controls at low and middle frequencies but not at high frequencies. Thus the change in Rrs sd due to BD at low and middle frequencies distinguished between control and asthmatic subjects, while the changes in Rrs and FEV1 due to BD did not.
Since the children with asthma differed in their severity and therapy, the difference at low frequencies in response to BD measured by FEV1, Rrs and Rrs sd was also examined, based on asthma severity according to the step in daily medication regimen by the GINA guidelines 16. In the present study there were 17 subjects with mild persistent asthma, 16 with moderate persistent asthma which were sufficient for analysis, but only six with mild intermittent asthma and none with severe persistent asthma. Repeated measures ANOVA with Games–Howell post hoc tests revealed significant differences amongst asthma severity in both baseline measures and responses to BD. At baseline, mild persistent asthmatics had lower FEV1 and FEF25–75% than both moderate asthmatics and control subjects, in contrast to the lack of difference when all asthma groups were grouped together. For the FOT measurements, although the Rrs of all asthma groups were higher than the control group (fig. 6b⇓), there was no difference in Rrs between mild persistent and moderate asthma. This was in contrast with baseline Rrs sd, where only Rrs sd of mild persistent asthma was higher than control and there was no significant difference between control and moderate persistent asthma (fig. 6b⇓). Furthermore, similar to the grouped data in figure 5⇑, there were no differences in response to BD measured by spirometry or Rrs when subjects were split according to asthma severity, but the change in Rrs sd due to BD was more in mild asthmatics than both moderate asthmatics and controls.

a) Percent change with bronchodilator (BD) administration classified according to the Global Initiative for Asthma (GINA) score for forced expiratory volume in one second (FEV1), mean forced expiratory flow between 25 and 75% of forced vital capacity (FEF25–75%), airway resistance (Rrs) and the sd of airway resistance (Rrs sd) in controls (n = 16, □), mild persistent asthmatics (n = 17, ░) and moderate persistent asthmatics (n = 16, ▪). b) Baseline values. A significant difference between patient groups was found only in baseline Rrs, Rrs sd and the change in Rrs sd with BD, with significant differences between the groups indicated by * and # (p<0.05).
DISCUSSION
The principal findings of the current study were that: 1) variations in Rrs were greater in children with asthma; 2) administration of a BD caused a greater decrease in variation of Rrs in asthmatics compared with controls; and 3) the reduction in variability of Rrs exceeded the change in Rrs or FEV1 following BD. These findings have significant implications for airway function in asthma.
Spirometry and Rrs
In all subjects, baseline measurements of FEV1 and FEF25–75% were within the normal range as commonly found in stable subjects with asthma 18, 19. Only four asthmatics had an FEV1 <80% pred 20, 21. Rrs was found to be significantly elevated in asthmatics compared with controls as previously reported in adults and children 9, 22, 23 at all frequencies and showed similar frequency dependence (fig. 3⇑) to previous studies 24–26. Additionally, baseline Rrs values corresponded well to previous values obtained in asthmatic children 27, 28, but were slightly higher than those previously obtained in healthy children 3, 28, 29.
Healthy children and well-controlled asthmatic children do not show much change with BD in spirometric measures 30, in agreement with the present data (fig. 5⇑). Furthermore, while Rrs was found to decrease in asthma in response to a BD, it also decreased similarly in the healthy children by an amount consistent with previous results 28. Thus, neither the BD response in FEV1 nor Rrs distinguished between children with and without mild-to-moderate asthma. While Rrs and FEV1 have been used to assess function BD and have been used to distinguish disease 28, 31, there is no consensus on either the sensitivity or the correlation between methods in BD testing 15.
Variation in Rrs
While it is well established that variation in airway function is a central feature of the disease, this is largely based on long-term variability of airway obstruction from several diurnal measurements of FEV1 and peak expiratory flow rate (PEFR) over several weeks or months of measurement 32, 33. Indeed, high diurnal variation of PEFR is associated with a higher risk for exacerbation 32. Long-term variation has also been assessed by FOT showing that within-day and between-day variability in Rrs is elevated in asthma 34. Short-term variability in the time scale of minutes similarly finds Rrs to be elevated in both adult and childhood asthma 9, 35, in agreement with the current findings. Despite the similarities, it is unknown whether the mechanisms responsible for long-term variation in lung function are the same as those for short-term variation.
There are several sources of variation in Rrs in addition to airway smooth muscle activity 9, including, but not limited to, episodic movement of the glottis, changes in lung volume which act to dilate or narrow airway diameters, and noise at the transducers particularly due to breathing. Unlike mean Rrs, the effects of noise on Rrs sd cannot be reduced by averaging. However, the effects of breathing noise were minimised by shunting most of the breathing through the bias tubes which provided a low resistance at breathing frequencies, thereby decreasing flow and pressure swings due to breathing (fig. 2⇑). In the current study, noise was never >10% of the signal. A perturbation signal and analysis window of 1-s duration was used to estimate Rrs which, although if improved signal-to-noise ratio compared with shorter windows, limited the ability to track rapid variation in Rrs. This is likely to have led to the decreasing frequency dependence of Rrs sd and possibly the lack of sensitivity of Rrs sd to differences between groups and to BD-induced changes at high frequencies (figs 3⇑ and 5⇑). Longer windows and the presence of the upper airway shunt tend to underestimate breath-by-breath variation in Rrs 36. Shorter windows would improve the ability to track Rrs, but lead to overestimates of Rrs sd from increased noise contamination. This suggests that fewer or single signal frequencies should be employed to improve signal-to-noise ratio and enable shorter estimation windows.
A strong determinant of Rrs and thus Rrs sd are the changes in lung volume and flow that occur with breathing. Rrs changes with dilation and re-narrowing associated with breathing, but also with alterations in upper airway geometry associated with the glottis 9, 36, 37. Rrs also changes with flow associated with turbulence and other effects and in anaesthetised children can change two-fold with a three-fold change in flow under isovolumetric conditions 38. Agonists can modulate the volume dependence of Rrs 39, 40, which may have contributed to the changes in Rrs and Rrs sd in asthma and with BD. However, the effects of a BD on median Rrs were similar in both groups and no changes were observed in tidal volume with BD or between asthma and controls. Differences in Rrs could also be attributed to changes in functional residual capacity, which was not measured 9, 39.
If changes in airway smooth muscle activation are reflected in variation of Rrs, this can occur either by modulation of lung volume dependence as described previously, or by directly altering airway diameter and thus Rrs. The latter effects of BD on Rrs are well established and reproduced in the present study (figs 5⇑ and 6⇑), supporting the idea that some of the variation in Rrs reflects variation in airway smooth muscle activity and is potentially useful in understanding airway pathology. However, for the resistance to vary randomly and frequently, from breath-to-breath and even possibly within breaths, temporal variations in airway constriction must be occurring in a spatially heterogeneous fashion through the airway tree. It is now known that airway narrowing during constriction is markedly spatially heterogeneous, particularly in asthma, either inferred from FOT impedance data, or directly by imaging methods 41–44. It is reasonable to expect that these effects vary temporally as well as spatially, leading to variations in Rrs impedance data as suggested by the present and other studies 9, 35. However, temporal variation in airway diameter has yet to be examined with imaging methods.
Effect of a BD
In support of the concept that some of the variation in Rrs is due to changes in smooth muscle activation, the current authors have previously found that variation in Rrs was increased in asthma and could be increased with methacholine administration in subjects with asthma 9. The authors reasoned that if this were true, then Rrs sd should decrease in asthmatic subjects administered a BD as reported for the first time in the present study.
The current authors further found that Rrs sd and the response to BD were significantly different amongst subjects with different degrees of asthma severity, based on the current step in daily therapy prescribed according to GINA classification 16. However, the present sample is small and it is likely that some subjects were at a higher step in therapy relative to their symptoms. Also, the distinction of severity is problematic once treatment is initiated and some of the differences observed may be due more to therapy than to severity. Indeed, in a 20-month cross-over study by Taylor et al. 45, asthma symptoms and variation in PEFR were higher in asthmatic subjects receiving SABA compared with subjects receiving a LABA. Similarly, the current study found that asthmatics who were not taking LABA, but were taking ICS and could be classified as mild persistent asthma were the most variable, with highest baseline Rrs sd and greatest decrease in Rrs sd with BD. In contrast, subjects that received LABA with corticosteroids and could be classified as moderate persistent asthmatics had the lowest baseline Rrs sd of the asthma subjects and the smallest decrease with BD, perhaps indicating that LABA may contribute to reduced variability similar to reduced exacerbations reported in some other studies 45, 46. While a prospective study is needed to confirm a relationship of short-term variation in Rrs to long-term variation in airway function and symptoms, this may be important, especially since it has been recently shown that fluctuation analysis of variation in airway function can predict the risk of asthma exacerbations 8.
Geometric considerations
Due to the nonlinear inverse 4th power law dependence of Rrs on diameter, a change in Rrs sd can be shown to be due to either a change in the sd of airway diameters, but also due to a change in average airway diameter, with no change in diameter variation. If one assumes the time-averaged diameter (do) of an airway is perturbed by some random variation s(t) such that:
diameter = do+s(t) (3)
then, normalised to the average diameter:
R/Ro = 1/(1+s/do)4 (4)
where Ro is the resistance at the average diameter. If there is bronchodilation with no change in the per cent variation of airway diameter, which is the case for constant s/do (constant coefficient of variation), then the change in Rrs sd of the airway is equal to the change in Rrs (fig. 7⇓). This could conceivably occur with sufficient decreases in airway stiffness with little change in load. Another possibility is dilation without a change in airway diameter variation, which predicts a greater decrease in Rrs sd than Rrs (demonstrated by numerical simulation; fig. 7⇓). Any additional decrease in variation would lead to even larger decreases in Rrs sd. This analysis implies that Rrs sd is a more sensitive measurement than Rrs to the effects of a BD.

Individual percent change in airway resistance sd (Rrs sd) in all asthmatics plotted versus percent change in airway resistance (Rrs) at low frequencies (□: intermittent; ▴: mild persistent; and •: moderate asthma). The arrow indicates the line of identity analytically predicted for a single airway with an increase in mean diameter and no change in percent diameter variation. The dashed lines indicate the numerically predicted relations for simple dilation up to 30% with no change in variation of airway diameters with Gaussian distributed diameters and sd fixed at 0.1 (– – –) and 0.2 (- - - -) of baseline diameter. Most subjects were in the lower left quadrant, with most of these decreasing Rrs sd more than Rrs.
This geometric dependence of Rrs sd on Rrs predicts that Rrs sd should be correlated with Rrs. Indeed, in figure 4⇑ they are mildly correlated (r2 ∼ 0.4). However, in response to BD different behaviours were found: some subjects decreased Rrs more than Rrs sd, but most subjects decreased Rrs sd more than Rrs, with a few subjects decreasing Rrs sd substantially with very little change in Rrs (fig. 7⇑). Also, amongst asthma classifications, a greater proportion of mild persistent and moderate persistent asthmatics decreased Rrs sd more than Rrs. The greater change in Rrs sd than Rrs with BD implies that, while BD usually dilated the airways, it may also function to calm the airways, reducing the tug-of-war between airway constriction and dilation 9.
Conclusion
In line with recently visualised spatial heterogeneity in asthmatic airways, measurement of the standard deviation of airway resistance by the forced oscillation technique may provide a window onto temporal variation in airway function. It is an easily performed method that is more sensitive than both airway resistance and forced expiratory volume in one second for evaluating the effect of a bronchodilator, but its dependence on changes in lung volume needs further investigation before studies are developed to evaluate its clinical utility.
Acknowledgments
The authors would like to thank S. Fulton and the staff at Camp Treasure Chest (Picton, NS, Canada) for their assistance with the study.
- Received May 11, 2006.
- Accepted February 16, 2007.
- © ERS Journals Ltd
References


