Evidence against the proposition that “UK cancer survival statistics are misleading”: simulation study with National Cancer Registry data
BMJ 2011; 342 doi: https://doi.org/10.1136/bmj.d3399 (Published 09 June 2011) Cite this as: BMJ 2011;342:d3399
- Laura M Woods, lecturer in cancer epidemiology1,
- Michel P Coleman, professor of epidemiology and vital statistics1,
- Gill Lawrence, director2,
- Jem Rashbass, director3,
- Franco Berrino, director4,
- Bernard Rachet, senior lecturer in cancer epidemiology1
- 1Cancer Research UK Cancer Survival Group, Department of Non-Communicable Disease Epidemiology, London School of Hygiene and Tropical Medicine, London WC1E 7HT, UK
- 2West Midlands Cancer Intelligence Unit, University of Birmingham, Birmingham BT5 2TT, UK
- 3Eastern Cancer Registry and Information Centre, Cambridge CB22 3AD, UK
- 4Department of Predictive and Preventive Medicine, Fondazione IRCCS, Istituto Nazionale dei Tumori, Milan, Italy
- Correspondence to: L M Woods laura.woods{at}lshtm.ac.uk
- Accepted 18 April 2011
Abstract
Objectives To simulate each of two hypothesised errors in the National Cancer Registry (recording of the date of recurrence of cancer, instead of the date of diagnosis, for registrations initiated from a death certificate; long term survivors who are never notified to the registry), to estimate their possible effect on relative survival, and to establish whether lower survival in the UK might be due to one or both of these errors.
Design Simulation study.
Setting National Cancer Registry of England and Wales.
Population Patients diagnosed as having breast (women), lung, or colorectal cancer during 1995-2007 in England and Wales, with follow-up to 31 December 2007.
Main outcome measure Mean absolute percentage change in one year and five year relative survival associated with each simulated error.
Results To explain the differences in one year survival after breast cancer between England and Sweden, under the first hypothesis, date of diagnosis would have to have been incorrectly recorded by an average of more than a year for more than 70% of women known to be dead. Alternatively, under the second hypothesis, failure to register even 40% of long term survivors would explain less than half the difference in one year survival. Results were similar for lung and colorectal cancers.
Conclusions Even implausibly extreme levels of the hypothesised errors in the cancer registry data could not explain the international differences in survival observed between the UK and other European countries.
Introduction
International disparities in survival after cancer have repeatedly been shown between European countries of comparable wealth and development in the EUROCARE studies.1 2 3 4 Survival for many cancers has often been lower in both the United Kingdom and Denmark than in other Nordic and western European countries. The International Cancer Benchmarking Partnership (ICBP) study of survival after cancer up to 2007 in Australia, Canada, Denmark, Norway, Sweden, and the UK suggests that these differences in survival still exist.5 The EUROCARE results and the data on which they are based have been criticised, particularly in the UK.6 Such results have nevertheless contributed to the evidence base for the NHS cancer plan (2000) and the cancer reform strategy (2007) in England,7 8 as well as cancer plans in Denmark, Finland, France, Norway, and Australia. A recent editorial, published while the ICBP study was in progress, again calls international comparisons of survival into question.9 Entitled “UK cancer survival statistics are misleading and make survival look worse than it is,” its subject was a report that mortality from breast cancer fell more rapidly in England and Wales than in other large European countries between 1989 and 2006.10
In their editorial,9 Beral and Peto interpreted trends in mortality from breast cancer in Europe as incompatible with survival after breast cancer being lower in the UK than in other countries.4 11 The authors hypothesise instead that the low reported survival in the UK could arise as an artefact from two main errors. Firstly, they propose that because registration of cancer is not statutory in England and Wales, a large proportion of cases are registered only because death certificates mentioning cancer are routinely provided to the registries. They infer that when a registration initiated by a death certificate is traced back to obtain clinical data from a hospital, the registry will incorrectly record the date of a recurrence of breast cancer shortly before death, not the correct date of the initial diagnosis. The true survival time for that patient would then be misrepresented in the registry data, thus reducing the overall estimate of survival in the population. Secondly, they suggest that UK survival statistics are falsely low because some long term survivors are never registered. This implies the existence of a substantial pool of women who are diagnosed as having breast cancer, are treated, and survive without any of their clinical information reaching the cancer registry, and who later die of something else with no mention of breast cancer on their death certificate. We have examined how national estimates of survival would change if each of these errors actually occurred.
Methods
We used data on patients registered in the National Cancer Registry of England and Wales in 1995-2007 with follow-up to 31 December 2007.12 In addition to breast cancer in women (the topic of the editorial), we analysed survival for cancers of the lung and colorectum (both sexes) to assess how the effect of the errors might vary with the lethality of the cancer.
In analysing the survival of a group of patients with cancer, describing the survival that is related directly to the disease is preferable to describing the observed (crude) survival of the group of patients. This concept is known as net survival: the survival that would occur if mortality from other causes of death was removed. Relative survival is the most defensible method of estimating net survival in population based studies, as it does not rely on accurate reporting of cause of death.13 Survival is traditionally estimated for a single cohort of patients followed through time (the cohort approach). However, survival in the near future can also be predicted by using probabilities of death derived from patients who were being followed up during the most recent time period for which mortality data are available (the period approach).14
Firstly, we estimated relative survival up to five years after diagnosis with the maximum likelihood approach for individual records,15 implemented with the open source algorithm strel.16 We used the cohort approach for patients diagnosed as having cancer during 1995-9; this was the period covered by EUROCARE-4,4 the results of which were criticised in the editorial. We used the period approach to produce short term predictions of survival for patients diagnosed as having cancer during 2005-7, as in the International Cancer Benchmarking Partnership study.5 Table 1⇓ shows the differences in one year and five year survival between Sweden and England observed in these two studies. We then simulated each of the hypothesised errors and estimated the change in survival that would arise if they occurred to varying degrees.
Absolute difference (percentage) in age standardised relative survival between Sweden and England in published studies
Cancer registrations assigned date of recurrence, instead of date of diagnosis
This hypothesis suggests that, for a proportion of those cancer registrations that are initiated by a death certificate and then successfully traced back to a clinical record, the true date of diagnosis is actually much earlier than the date recorded in the cancer registry, which might instead represent the date of recurrence. To simulate the effect on national estimates of survival of the registered date of diagnosis being more recent than it should be, we extended survival time for randomly selected separate samples of 5%, 10%, 20%, 30%, 50%, and 70% of deceased patients. This is an extreme range of possible error because the proportion of such cases ranged from 9.7% for breast cancer to 18.3% for lung cancer in the West Midlands region during 2001-8 (table 2⇓). We randomly selected the extensions of survival from Poisson distributions with means of 6, 12, 18, 24, 36, 48, 60, 84, and 120 months; this was again an extreme range of possible error, because the median survival time for women registered with metastatic disease in the West Midlands during 1995-2002 was less than nine months. We applied each combination of the proportion of deceased patients affected by the error and the simulated mean extension of survival for those patients iteratively to the national data and estimated relative survival in each of 100 resulting datasets: the survival averaged on these datasets flattened from about the 60th replication. We show the mean and the range of the 100 survival estimates.
Cancer registrations initiated by death certificate, for which date of diagnosis was actively sought by registry staff: West Midlands, England, 2001-8
In the preceding simulation, we assumed that erroneous recording of the date of diagnosis was equally probable for any patient who had died. In fact, as the error supposes that the recorded date is the date of a recurrence, assuming that patients with a recurrence are likely to have shorter recorded survival times is logical. We reproduced this with two further sensitivity analyses that involved changing the characteristics of the sample of women selected. Firstly, we determined the distribution of age at death for women who died during 1995-9 and who had been notified to the registry only because “breast cancer” was mentioned on their death certificate. We have previously shown that such cases have much shorter survival than do those notified to the registry by other means.1 We then replicated this age distribution when selecting our samples. Within each single year of age, the women were randomly selected. Secondly, and separately, we selected a sample of women whose mean survival time, as recorded in the registry, was very short: only one tenth of that of all deceased patients. In each of the two sensitivity analyses, we attributed additional survival time to the sample and did a full set of simulations as described above.
Failure to register long term survivors (five years or more)
To simulate failure to register patients with cancer who survived at least five years after diagnosis (long term survivors), we duplicated the records of various proportions (5%, 10%, 20%, 30%, and 40%) of randomly selected long term survivors who had in fact been registered. For example, if 30% of long term survivors were supposedly unknown to the registry, we duplicated 43 randomly selected long term survivors for every 100 long term survivors actually registered (100/143=70%).
Long term survivors unknown to the registry are likely to be younger than those who are registered. This is because to have survived for the full 13 year period covered by the study, their mean survival would have to be substantially greater than five years (whereas that of registered five year survivors would not), so unregistered long term survivors would be expected to be younger than registered long term survivors. To reproduce this, we repeated the process by skewing the probability of the cancer not being registered by age (skewed to the younger ages). We used a simple approach to examine two different levels of age skew: moderate, in which we calculated the probability of not being registered as inversely proportional to age at diagnosis to the power of 3, and extreme (to the power of 10). We then estimated relative survival in 100 simulated datasets, by age group, for each level of under-registration.
Results
Cancer registrations assigned date of recurrence, instead of date of diagnosis
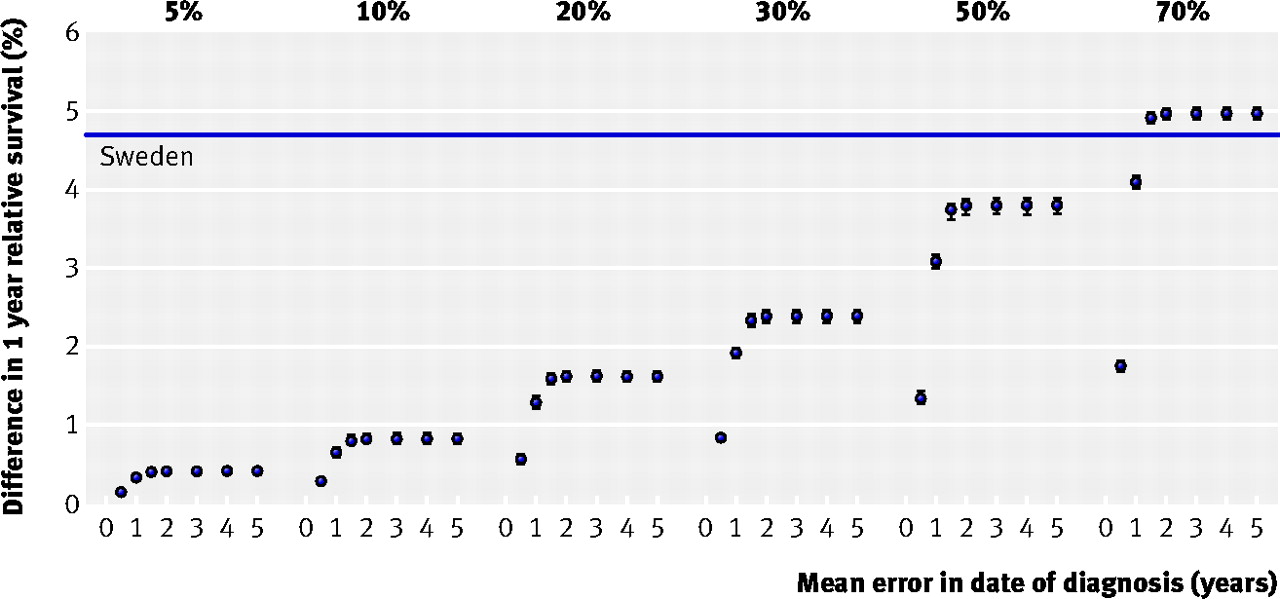
Simulating errors in the date of diagnosis changed the estimates of survival, but the observed difference in survival between England and Sweden could be explained only if very large proportions of patients were affected by large errors (fig 1⇓). For example, for women diagnosed with breast cancer in 1995-9, the survival time of 70% of women known to be dead would have to have been incorrectly recorded by an average of at least one year to increase one year survival after breast cancer by 4%, whereas the difference in one year survival between Sweden and England reported in EUROCARE-4 was 4.7% (table 1⇑).17 Similarly, to explain the 7.3% difference in five year survival between Sweden and England, 30% of women known to be dead would have to have had their survival time incorrectly shortened by an average of at least five years (fig 2⇓). For women diagnosed with breast cancer in 2005-7, the difference in five year relative survival between Sweden and England is predicted to be 6.9% (table 1⇑).5 Again, this difference could only be fully explained if the survival time of 30% of women known to be dead had been incorrectly shortened by an average of five years (data not shown).

Fig 1 Simulated increase in one year relative survival in England and Wales by percentage of deceased patients whose survival time was extended, and mean extension of their survival: women with breast cancer diagnosed 1995-9. Baseline estimate is relative survival estimate in observed data before any simulated changes in survival time. Data points represent absolute percentage change in relative survival from baseline estimate (zero). Absolute difference in relative survival observed between age standardised survival in England and Sweden in EUROCARE-4 (table 1) is represented by horizontal line above baseline

Fig 2 Simulated increase in five year relative survival in England and Wales by percentage of deceased patients whose survival time was extended, and mean extension of their survival: women with breast cancer diagnosed 1995-9. Baseline estimate is relative survival estimate in observed data before any simulated changes in survival time. Data points represent absolute percentage change in relative survival from baseline estimate (zero). Absolute difference in relative survival observed between age standardised survival in England and Sweden in EUROCARE-4 (table 1) is represented by horizontal line above baseline
The addition of a mean of seven or 10 years (84 or 120 months) of extra survival time did not result in increases in survival greater than those seen for five years (60 months, data not shown). Neither of the scenarios examined in the sensitivity analysis resulted in larger increases in survival (data not shown).
Results were similar for colorectal and lung cancers. To “eliminate” the differences in five year survival between Sweden and England reported in EUROCARE-4 (table 1⇑), the recorded survival time for deceased patients in England would have to have been incorrectly shortened by an average of four years or more for 20% of patients who died of colorectal cancer and for 10% of those who died from lung cancer (15 000 people, data not shown).
Failure to register long term survivors (five years or more)
Simulated failure to register long term survivors also led to underestimation of relative survival, especially at five years after diagnosis (table 3⇓). However, even if 40% of women with breast cancer who had survived five or more years were missing from the registry (that is, if long term survivors known to the registry represented only 60% of those actually living in the population), one year survival after breast cancer would increase by only 2.1%, less than half the difference in survival between England and Sweden reported in EUROCARE-4 (table 1⇑). In this most extreme scenario, five year survival in England and Wales would be around 7.4% higher, similar to the level reported for Sweden in EUROCARE-4. The most recent estimate of the difference in five year survival between Sweden and England, a period estimate for 2005-7 (6.9%), would not be explained even by failure to register 40% of long term survivors, which would correspond to an increase in five year survival of 3.5% (period estimations, table 3⇓). The difference in five year survival for colorectal and lung cancer would imply around 30% under-registration for colorectal cancer and in excess of 40% under-registration for lung cancer (data not shown).
Absolute increase (percentage) in relative survival resulting from addition of putative unregistered long term survivors (≥5 years): women diagnosed as having breast cancer in England and Wales during 1995-9
Introducing an age bias in the simulated failure to register long term survivors did not change the overall effect. It did, however, affect the age specific estimates. When we assumed the probability of long term survivors being unregistered to be the same at all ages, the addition of up to 40% of long term survivors increased the estimated five year survival for women aged under 50 years at diagnosis by around 13%. However, only a small increase (less than 1%) in these values occurred when we assumed unregistered long term survivors to be much younger (the extreme age skew). In contrast, in women aged 50 and over the effect of failure to register 40% of long term survivors was an 8% increase in survival, falling to 6% if we assumed unregistered patients to be much younger (extreme age skew).
Combining effects of both biases
Both of the proposed biases could, potentially, be present and act together to explain the overall effect. The combined effect would be entirely additive, because the biases affect different people: a patient with cancer cannot be a deceased person whose survival has been underestimated and at the same time an unregistered long term survivor.
Misclassification of the date of diagnosis is relevant only for deceased patients whose date of diagnosis was sought by the registry after receipt of a death certificate (table 3⇑). For breast cancer, this is around 9%. If in half of these cases the date of diagnosis was erroneously recorded by an average of five years, under-registration of long term survivors would have to be in excess of 40% to explain all the UK-Sweden difference in one year survival and in excess of 30% to explain the difference in five year survival. The same logic, applied to the results for colorectal cancer, implies that under-registration would need to be 20% to explain the difference in one year survival and 10% to explain the difference in five year survival (data not shown). For lung cancer, which is much more lethal, almost all the difference between Sweden and England would be accounted for if the date of diagnosis was erroneously recorded for half of the deceased patients by an average of two years (data not shown).
Discussion
The simulations we report show that even if extreme proportions of registrations of breast cancer initiated by a death certificate contained the date of recurrence instead of the true date of diagnosis, or if selective failure to register long term survivors reached extreme levels, these errors could not explain the difference in survival after breast cancer between England and Sweden reported in the EUROCARE studies. Even considering that the two proposed errors might work together, the errors would still need to be implausibly extensive to explain the full difference.
If under-registration of long term survivors from breast cancer was as extreme as 40%, and those women were much younger than those who were registered, two conclusions would follow. Firstly, the international differences in survival among older women would be less likely to be attributable to this artefact, because the simulated increases in survival were much smaller for older women, whereas the differences in survival observed in the EUROCARE studies between the UK and other countries were much greater among older women. Secondly, the age profile of women with breast cancer in the UK would change markedly, and the incidence among young women would be much higher than currently recorded. Incidence by age in England is currently very similar to that in Sweden (fig 3⇓) and in most other Western countries. If under-registration of younger breast cancer patients in England was as extreme as would be needed to explain the survival deficit with Sweden, the incidence of breast cancer by age in England would have a completely different, unique pattern (fig 3⇓).

Fig 3 Age specific incidence rates for breast cancer (women) in England and Sweden, with incidence by age that would be observed in England if 20%, 30%, or 40% of putatively unregistered long term survivors were added to data, with “extreme” age skew (see text)
The BMJ editorial discussed only two of three problems with the quality of data that might lead to underestimation of survival: inaccurate date of diagnosis and incomplete ascertainment of patients with cancer. The third is completeness of the ascertainment of death in patients with cancer in countries other than the UK. We consider each of these in turn.
Inaccurate date of diagnosis
The likelihood that a patient’s medical history gives rise to a cancer registration initiated by a death certificate is a function of how information is obtained and processed by the cancer registry. In many UK registries, death certificates mentioning cancer are received and added to the registry’s database within a week or so of the date of death, whereas information on pathology may be processed with a time lag of three months or more, and information on the first course of treatment may not be fully captured for up to nine months after diagnosis. If the patient dies shortly after diagnosis and the death certificate mentions cancer, the certificate may reach the registry several months before the routine process of data capture is completed. When a death certificate remains the only source of information after a period of months, additional details then have to be actively traced by registry staff. Only these cases could be subject to the erroneous recording of the date of diagnosis suggested by Beral and Peto.9
Table 2⇑ shows the proportion of such registrations for breast, lung, and colorectal cancer in the West Midlands regions of England in 2001-8. For breast cancer, the date of diagnosis was actively traced by the registry in 2.2% and 1.8% of all registrations, which corresponds to 9.7% and 6.8% of women with breast cancer who had died. By contrast, to explain the difference in one year survival between England and Sweden observed in EUROCARE-4, 70% of all women with breast cancer who had died would have to have been subject to an average error of one year in the date of diagnosis (fig 1⇑). Among the 7-10% or so of deceased women for whom the proposed error is actually possible, even an average error of five years in the date of diagnosis would explain only a small proportion of the total difference in survival. Erroneous recording of the date of diagnosis for cancer registrations initiated by a death certificate is thus high unlikely to play a significant role in the international differences in survival after breast cancer.
The results for colorectal cancer are similar but of smaller magnitude. The conclusion is a little different for lung cancer—the difference in survival between Sweden and the UK would be entirely eliminated if the date of diagnosis was erroneously recorded by an average of two years for as many as half the deceased lung patients. However, this is principally a result of the difference in the disease: survival after breast cancer is very good, whereas survival after lung cancer is very poor. The recorded date of diagnosis of lung cancer is highly unlikely to be the date of recurrence, because late recurrence of lung cancer is rare—most patients die within one year of diagnosis.18
The proposition becomes more implausible when one considers the gross error that pathologists and cancer registry staff would have to have been making, for thousands of patients each year, consistently over many years, and in each of the cancer registries across all four UK nations, to explain the longstanding survival deficit between the UK and other European countries. New, primary, invasive breast cancers typically present as a lump in the breast. They are usually treated by surgery. Confirmation of the diagnosis of primary cancer from pathological examination is available for more than 90% of women. In contrast, recurrent breast cancer often presents with local extension or metastatic deposits in bone, liver, lung, or brain or more rarely in the contralateral breast; breast tissue pathology is examined less often. Recurrence would often prompt palliative treatment, often without surgery to the breast. Such a distinctive clinical picture would be unlikely to lead to misclassification of recurrence as a new primary cancer in more than rare instances. Similar remarks apply to colorectal and lung cancers. Furthermore, this error would have to be made only by British pathologists and registrars.
Beral and Peto note that most of the differences in survival arise in the first year after diagnosis and assert that this could also be explained by misclassification of a recurrence as a new diagnosis.9 Even among women diagnosed as having breast cancer during 1992-4 who survived the first year after diagnosis, however, a 5.7% difference in five year survival existed between West Midlands (England) and New South Wales (Australia).19 The difference in this conditional five year survival between England and Sweden for women diagnosed during 1995-9 was 6.3%.5 In other words, a substantial deficit in survival after cancer in the UK remains well beyond the first year after diagnosis.
Completeness of ascertainment of patients with cancer
We have shown that the difference between Sweden and the UK in five year survival after breast cancer could not be explained even if UK registries had registered only 60% of all long term survivors (that is, if 40% of long term survivors were never registered). If under-registration was as extreme as that, more than one in four of all women diagnosed as having breast cancer in the UK would be unknown to the cancer registries. This would mean that the true incidence of breast cancer in the UK is actually more than 30% higher than currently recorded, and thus at least 10% higher than in any other European population.20
The existence of such a large pool of unregistered long term survivors is not compatible with a large study showing that the incidence of breast cancer in the National Cancer Registry was very similar to that recorded independently in primary care in 1990-6.21 As long term survivors are more likely to have been diagnosed as having cancer at younger ages, this would also imply that the pattern of incidence of breast cancer by age in the UK is completely different from that currently seen.22 One clinical audit study suggests the opposite: namely, that unregistered patients with breast cancer tend to be older, short term survivors, whose inclusion in the registry would reduce the overall survival observed, rather than increase it.22 This is also likely to be true for lung and colorectal cancers, which have poorer prognosis than breast cancer.
Beral and Peto suggest that the difference in survival between Sweden and the UK depends on the fact that cancer registration is statutory in Sweden. This is irrelevant: European countries with statutory, national cancer registration have survival that is higher than (Finland), similar to (Denmark), and lower than (Slovenia) survival in the UK.4
Completeness of ascertainment of death in cancer patients
Artefactual differences in survival could also arise if information on the death of patients with cancer was substantially incomplete in one population. To produce lower survival in the UK, this would imply that registries elsewhere in Europe are less successful at linking diagnoses of cancer with the death certificate of the same patient. We have shown that the size of this bias is small,23 and its effect is greatest for the most lethal types of cancer, rather than for cancers with a good prognosis such as breast cancer. It can be important for comparisons of long term survival (10 years or more) but less so for short and medium term survival. Even if 5% of deaths among registered breast cancer patients were missed, five year survival would increase by a relatively modest 1.7%.24 The equivalent increases would be greater for the other sites examined owing to their greater lethality: around 4% for colorectal cancer and 5.9% for lung cancer.
Beral and Peto assert that the quality of death certification is sufficiently robust as the basis for trends in mortality. They do not consider contrary evidence, either on the quality of medical certification of the cause of death or on international differences in the selection and coding of the underlying cause of death,25 26 27 from which cause specific death rates are constructed. By contrast, most incident cancers are registered on the basis of histological evidence of the primary malignancy; several complementary sources of information are used, and quality control at the time of cancer registration is rigorous28: extensive, quantitative evidence of this exists, both in the UK and internationally.20 29 Furthermore, estimation of relative survival does not require the cause of death. Unlike trends in cancer mortality, therefore, trends in relative survival are not affected by international differences or trends in the comparability of death certification.
Possible causal explanations
Breast cancer mortality has fallen more steeply in the UK than in Sweden because it was so much higher in the 1980s (42 v 26 per 100 000 woman years10). The 10% increase in five year survival seen in the UK between 1986-90 and 1996-9 represents around a 33% decrease in lethality, consistent with the 35% drop in mortality over a similar period.10 Contrary to the assertion of Beral and Peto, therefore, the trends in the incidence of, mortality from, and survival after breast cancer in the UK are, in fact, coherent. Nevertheless, breast cancer mortality up to 2006 in the UK was still higher,10 and survival up to 2007 was lower,5 than in countries such as Sweden. Good evidence from medical records (not cancer registry data) shows that this is partly attributable to differences in stage at diagnosis and treatment.30 Comparative data on healthcare provision are consistent with poorer outcomes after cancer in the UK. The UK still spends a smaller proportion of its gross national product on healthcare than do other developed nations. The UK has fewer doctors,31 in particular general practitioners,32 per head of population than in many other similarly developed countries, which may lead to delays in diagnosis, lower usage of radiotherapy,33 and longer waiting times.34 35
Conclusions
The simulations we report here provide evidence that the errors conjectured by Beral and Peto are not plausible explanations for the deficit in survival after cancer between the UK and many similarly developed countries. The findings support a large body of evidence that survival after cancer in the UK is indeed lower and that this is likely to be related to delay in diagnosis, lower investment in healthcare, and suboptimal care.
The quality of cancer registry data should certainly be considered when making survival comparisons. However, purely hypothetical concerns about the quality of data should not be used as an excuse to dismiss substantial and persistent differences in survival without quantitative examination.
The question has long since ceased to be whether such unacceptable differences in cancer survival exist. The question is what the underlying mechanisms are and what can be done to improve the outcomes for patients with cancer in the UK.
What is already known on this topic
Population based survival after cancer estimated from cancer registry data is often lower in the UK than in other equally developed nations
The extent to which these patterns are due to real differences in the treatment of cancer patients has been debated for more than a decade
A recent BMJ editorial asserted that lower survival in the UK is due to two specific errors in the cancer registration process
What this study adds
A comprehensive simulation using the entire National Cancer Registry data has shown that neither of the errors proposed in the BMJ editorial can plausibly explain low survival after breast cancer in England and Wales
These analyses highlight the need to examine what can be done to improve the outcomes for patients with cancer in the UK
Notes
Cite this as: BMJ 2011;342:d3399
Footnotes
Contributors: LMW did all the analyses, interpreted the results, and co-wrote the manuscript. MPC had strategic input into analyses, interpreted the results, and co-wrote the manuscript. GL, JR, and FB contributed to the interpretation of the analyses and commented on the manuscript. BR conceived the study, assisted with the analyses, interpreted the results, and co-wrote the manuscript. All authors had full access to the results of all analyses. LMW, MPC, and BR are the guarantors.
Funding: None.
Competing interests: All authors have completed the Unified Competing Interest form at www.icmje.org/coi_disclosure.pdf (available on request from the corresponding author) and declare: no support from any organisation for the submitted work; no financial relationships with any organisations that might have an interest in the submitted work in the previous three years; no other relationships or activities that could appear to have influenced the submitted work.
Ethical approval: The Medical Research Division at the Office for National Statistics gave permission for the use of data from the National Cancer Registry data for England and Wales; the ethics committee at the London School of Hygiene and Tropical Medicine approved the study.
Data sharing: No additional data available.
This is an open-access article distributed under the terms of the Creative Commons Attribution Non-commercial License, which permits use, distribution, and reproduction in any medium, provided the original work is properly cited, the use is non commercial and is otherwise in compliance with the license. See: http://creativecommons.org/licenses/by-nc/2.0/ and http://creativecommons.org/licenses/by-nc/2.0/legalcode.