Article Text

Abstract
To investigate whether valid respiratory data can be extracted from the pulse oximeter plethysmographic (pleth) trace in healthy newborn infants, pleth data were collected from the foot, and respiratory airflow was simultaneously measured using a facemask. The pleth waveform was analysed using fast Fourier transform (FFT), low-pass filtering (LPF), and by plotting the peak-to-peak amplitude variation (PtP). Using FFT in 14 term infants, the median (range) respiratory rate from the pleth signal was 43 (30–65) breaths/min, and from the flow signal it was 44 (30–67) breaths/min (median difference 0.01 breaths/min, p>0.05). Both LPF and PtP analysis yielded waveforms with a frequency similar to the respiratory rate. Respiratory information, including respiratory rate and a respiratory-like waveform, can reliably be extracted from the pleth trace of a standard pulse oximeter in newborn infants. Such analysis may be clinically useful for non-invasive assessment of respiratory problems in infants and young children.
Statistics from Altmetric.com
Respiratory measurements in infants are important but challenging; the techniques are time-consuming and require sedation, which precludes their use in epidemiological studies or in sick children. Even tidal flow analysis, a promising indirect marker of respiratory function,1 requires placing a facemask over the infant’s nose and mouth, which may not be tolerated and may alter respiratory pattern.
Pulse oximetry is a widely used non-invasive technique for measuring arterial oxygen saturation, which generates a photoelectric plethysmographic signal—that is, an index of the volume of blood in the local vascular bed. Usually this signal is used only to assess the validity of the arterial oxygen value, but it has also been shown to reflect arterial blood pressure and respiratory variations in pulse pressure.2 Analysis of the plethysmograph (pleth) signal from pulse oximeters by a variety of signal-processing techniques has been shown to yield respiratory components,3 4 probably because of cardiorespiratory interaction.
The aim of this study was to examine if valid respiratory data can be derived from the pleth trace in spontaneously breathing newborn infants by comparing them with directly measured flow data.
METHOD
Subjects
Full-term (⩾36 weeks’ gestation) healthy newborn (⩽7 days) infants were recruited from the postnatal ward of the Royal Sussex County Hospital, Brighton with informed parental consent. The study was approved by the Brighton Research Ethics Committee.
Equipment
Pulse oximetry was carried out using a Nonin 4100 Digital Pulse Oximeter (Nonin Medical Inc, Plymouth, Minnesota, USA) connected via “Bluetooth” to a notebook computer. The pleth signal was displayed in real time using Nonin OEM software and simultaneously saved.
Respiratory airflow was measured using a low-deadspace ultrasonic flowmeter (Exhalyzer; EcoMedics AG, Durnten, Switzerland) connected to a facemask. The airflow signal was displayed in real time on a separate, synchronised notebook computer, and both flow and derived volume signals were saved.
Data collection
Data were collected during natural quiet sleep after a feed. A “wrap-around” oximeter probe was applied to the infant’s foot, using ultrasound gel, a double-sided adhesive disc and “Hospifix” (Paul Hartmann Ltd, Heywood, Lancashire, UK) stretch bandage. The facemask was then placed over the nose and mouth. After confirmation of a good-quality pleth signal and a good-quality leak-free airflow signal, data collection of both signals was started simultaneously for 2 min. Pleth data were sampled at 75 Hz, and flow at 200 Hz.
Analysis
Pleth and airflow traces were inspected visually, and a period free from obvious artefact (minimum 20 s) was selected for analysis. Pleth and flow signals were analysed with software that we developed using MATLAB (MathWorks Inc, Natick, Massachusetts, USA) in the following ways.
Fast Fourier transform (FFT) analysis. FFT, a method of identifying the component frequencies of a complex waveform, was computed for both pleth and flow. Peaks representing the component frequencies were identified using the software and checked visually.
Low-pass filter (LPF) analysis. Three Kaiser Window LPFs were applied separately to the pleth signal with cut-offs at 0.75, 1.0 and 1.25 Hz (ie, 45, 60 and 75/min), and the filtered signal was plotted against time. The aim was to filter out the higher-frequency (pulse) components and potentially allow lower-frequency (eg, respiratory) components to be seen.
Peak-to-peak (PtP) analysis. After smoothing with a 10 Hz Kaiser Window LPF, the changing PtP amplitude of the pleth waveform was calculated across the trace and plotted against time, to potentially reveal respiratory-related changes in pulse volume.
Respiratory rates measured from the flow trace and estimated by analysis of the pleth trace as above were compared using the paired Wilcoxon test (Minitab V15) and Bland–Altman analysis.
RESULTS
For 14 infants, of median (range) age 2 (0–4) days and birth weight 3300 (2700–4000) g, there were data that met the criteria for analysis. In a further two infants, a 20 s artefact-free period of recording was not available.
FFT
Figure 1 shows a section of pleth and flow recording with corresponding spectra obtained using FFT. The pleth spectrum shows a clear peak at 1.5 Hz (90/min), which corresponds to the pulse rate, and a lower peak at 0.6 Hz (36/min), which is consistent with the respiratory rate peak from the flow data. (Further high-frequency peaks are harmonics of pulse rate.) In recordings from 12 babies, visual assessment suggested that there was also a regular slow variation (frequency 3–6/min) in pleth amplitude.

Example of plethysmographic (pleth) and flow traces and the corresponding spectra below. The spectrum of the pleth trace shows a peak at ∼1.5 Hz (90/min, dotted line arrow) corresponding to the pulse rate, and a further peak at ∼0.6 Hz (36/min, solid line arrow), which corresponds to a peak on the flow spectrum (solid line arrow), thus indicating the respiratory rate. The pleth spectrum also indicates higher-frequency harmonics of the pulse rate. arb, arbitrary.
LPF
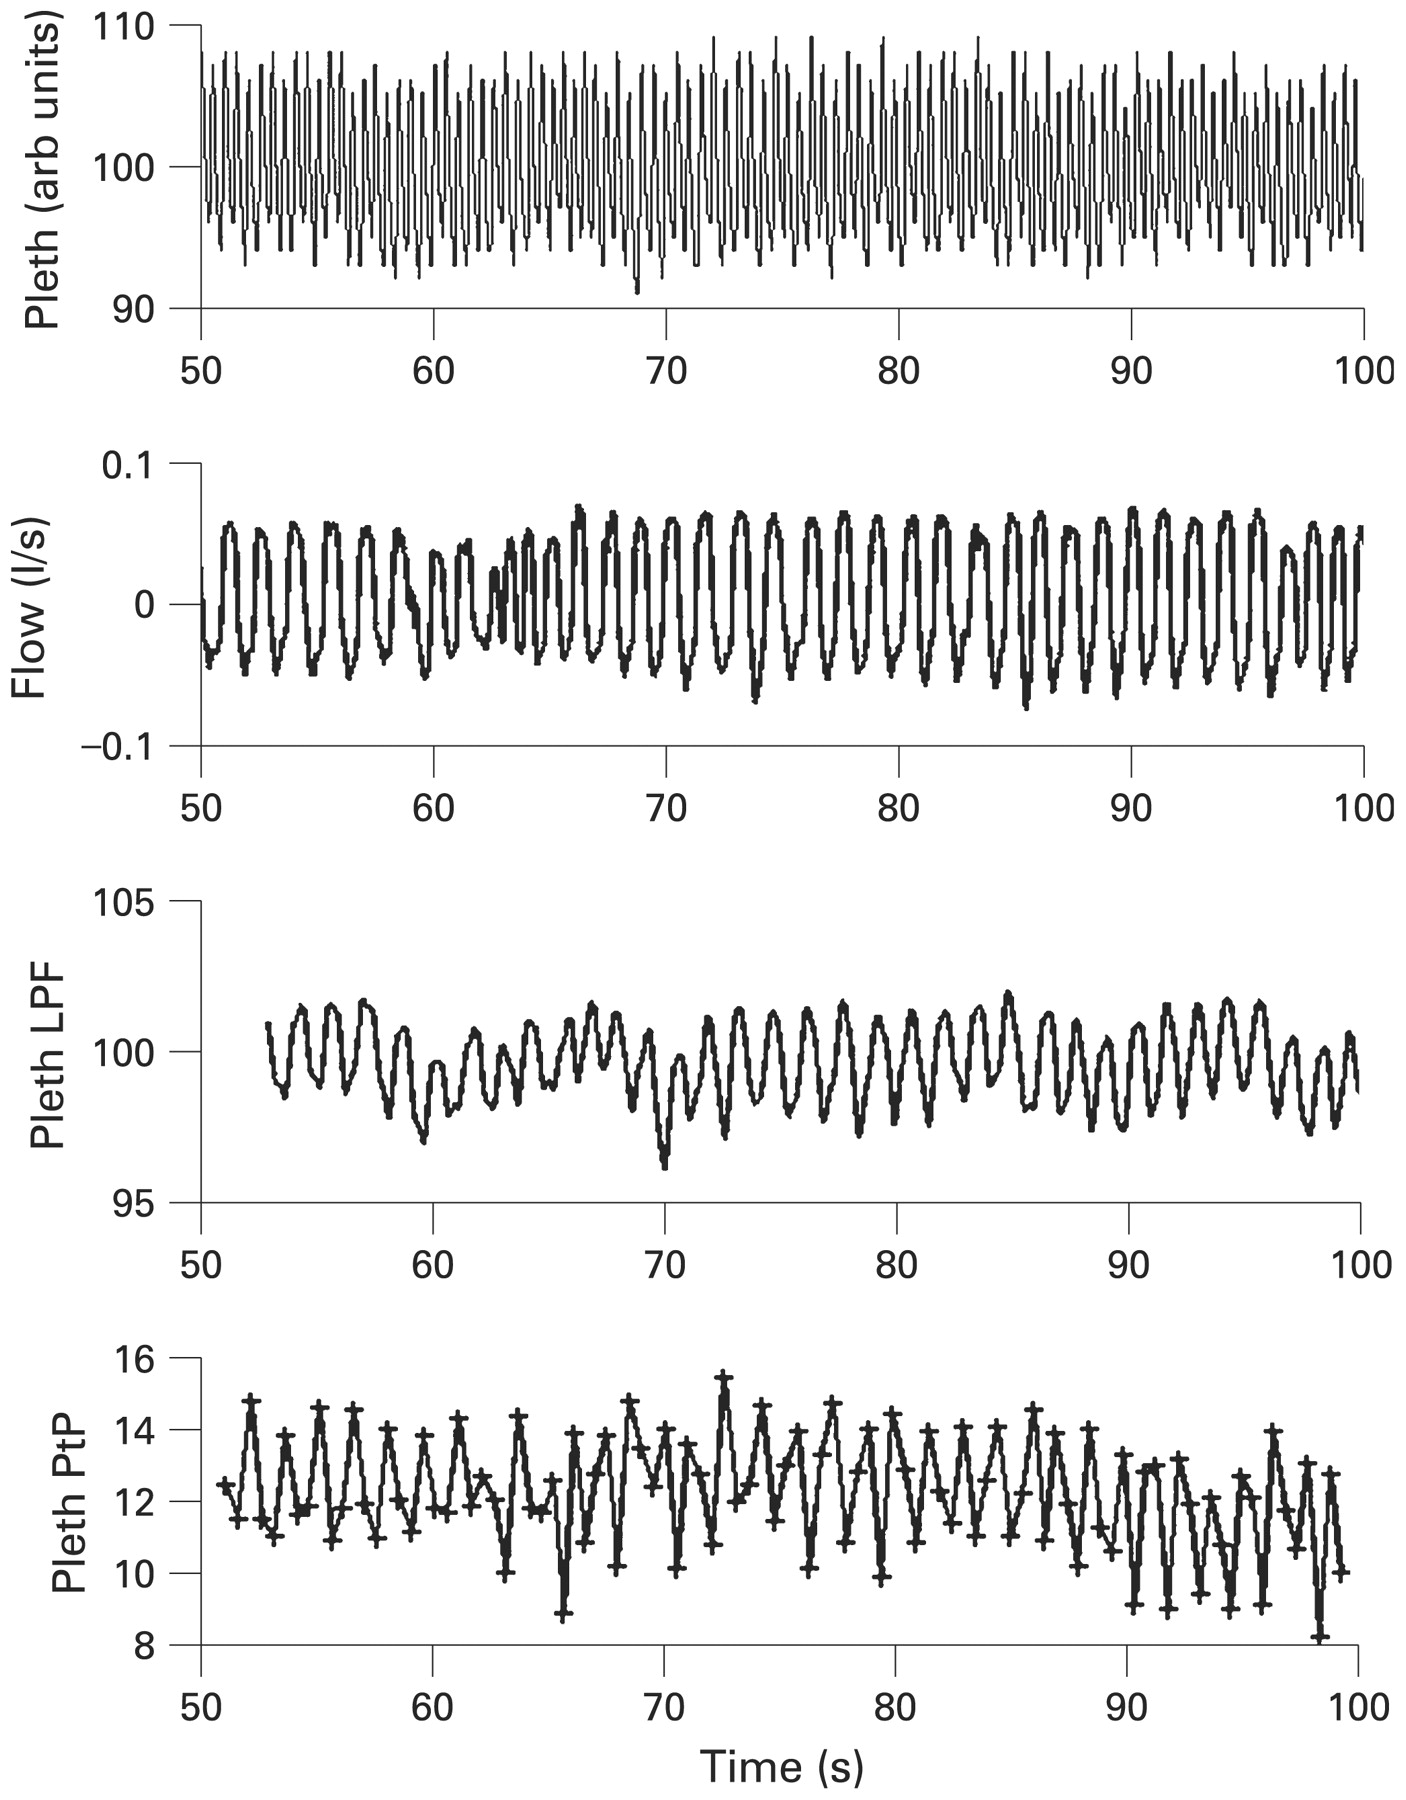
LPF with an appropriate cut-off resulted in a trace with a similar frequency to that of the flow data but with a phase shift (fig 2).
Example of plethysmographic (pleth) and flow data and the corresponding low-pass-filtered (LPF; 1.25 Hz) pleth waveform and peak-to-peak (PtP) waveforms. The filtered and PtP data are similar in frequency to the flow data. The PtP data points are shown with cross markers. Slow variations (∼6/min) in the pleth amplitude can also be seen. arb, arbitrary.
PtP
In 11 of the 14 infants, plotting the PtP amplitude of the pleth signal produced a waveform of the same frequency as the respiratory waveform (fig 2).
Comparison with respiratory rate obtained from flow recording
Using FFT, in all 14 infants a peak in the pleth spectrum was observed at a frequency consistent with the respiratory rate from the flow recordings. Median (range) respiratory rate from the pleth trace was 43 (30–65) breaths/min, and that from the flow recording was 44 (30–67) breaths/min. The median difference (pleth – flow) was −0.01 breaths/min (range −5.84 to +0.76, p = 0.802). On Bland–Altman analysis, the mean difference (pleth – flow) was −0.82 breaths/min, with 95% limits of agreement −4.63 to +3.09. Using a 1 Hz LPF to generate a respiratory-like trace, the median (range) respiratory rate was 44 (30–67) breaths/min, and the median difference was small but just significant at −0.89 breaths/min (range −8.41 to +0.38, p = 0.038).
CONCLUSIONS
This study shows that it is feasible to extract respiratory information from the pleth trace of a commercially available pulse oximeter in healthy newborn infants. Firstly, applying FFT analysis yielded a frequency peak below heart rate that corresponded closely to respiratory rate, which is in accordance with previous studies in adults4 and older children.3 5 Secondly, simple filtering of the pleth waveform resulted in a trace that was similar in pattern to the respiratory flow data. Thirdly, visual inspection of the pleth trace revealed both variations in amplitude at respiratory frequency (analogous to pulsus paradoxus) and slower variations of uncertain origin. This is the first study, to our knowledge, to extract detailed respiratory data from the pleth signal in neonates and validate it directly against respiratory airflow.
We speculate that such analysis could be clinically useful for non-invasive assessment of respiratory problems in infants and young children, including tidal flow analysis to make inferences about lung mechanics and quantification of pulsus paradoxus in infants with increased work of breathing. Further work to explore these possibilities is needed in children with respiratory disease.
Acknowledgments
We are grateful for assistance received from the staff on the postnatal ward at the Royal Sussex County Hospital, and to Dr Heike Rabe (Royal Sussex County Hospital), Dr Holger Jungmann (Institute of Cancer Research, University of Witten/Herdecke, Germany) and Mr Joe Crackel (Nonin Medical Inc, USA) for valuable suggestions. This work was funded by the NHS National Institute for Health Research (Research for Patient Benefit Programme). This paper presents independent research commissioned by the National Institute for Health Research (NIHR). The views expressed are those of the authors and not necessarily those of the NHS, the NIHR or the Deparment of Health.
Footnotes
Competing interests: None.
Ethics approval: Obtained.
Patient consent: Parental consent obtained.
Linked Articles
- Fantoms