Article Text

Abstract
Data from healthy children are needed to evaluate bone mineralisation during childhood. Whole body bone mineral content (BMC) and bone area were examined by dual energy x ray absorptiometry (Hologic 1000/W) in healthy girls (n=201) and boys (n=142) aged 5–19 years. Centile curves for bone area for age, BMC for age, bone area for height, and BMC for bone area were constructed using the LMS method. Bone mineral density calculated as BMC/bone area is not useful in children as it is significantly influenced by bone size. Instead, it is proposed that bone mineralisation is assessed in three steps: height for age, bone area for height, and BMC for bone area. These three steps correspond to three different causes of reduced bone mass: short bones, narrow bones, and light bones.
- dual energy x ray absorptiometry
- bone mineral content.
Statistics from Altmetric.com
Osteoporosis is a growing health problem in Western countries.1-4 It is generally accepted that those who achieve a higher peak bone mass are less at risk of having an osteoporotic fracture later in life.1 5 Recent studies have shown that peak bone mass can be achieved by the early 20s, and possibly even earlier in women.6-9 It is therefore of interest to study the pattern of bone mineralisation in children.
Several studies have presented normative data for regional bone mineralisation (wrist or lumbar spine) in children and adolescents, measured by single photon absorptiometry or dual energy xray absorptiometry (DXA).10-15 The possibility of whole body DXA scanning is relatively new, and there are only a few studies in children with data on whole body bone mineralisation, some including only girls.6 8 9 15-17 In the present study we consider whole body mineralisation for both girls and boys aged 5–19 years.
Bone mass (bone mineral content, BMC) depends on both the size and density of skeletal bone, and a difference in BMC may reflect a difference in either bone size or bone density. However it is not possible to measure true bone density—DXA measures only the cross sectional area of the scan (bone area) not the bone volume, and without the bone volume the bone density cannot be calculated. The index BMC/bone area is commonly called bone mineral density (BMD), but it is not a density at all—to measure this it needs dividing by the (unknown) bone depth.
A low BMC (adjusted for sex and age) in an ill person18 19 may be a reflection of a small skeleton (that is small bone area). It is important to know whether a small bone area, or a low BMC corrected for bone area, is the cause of the low BMC. This leads to the concept of ‘BMC adjusted for bone area’. In clinical terms this is more useful than ‘bone density’, however derived, as it is a measure of bone mineral that is uncorrelated with bone area—something which BMD itself is not.20
Here we describe bone mineralisation in growing individuals in terms of the three components: BMC adjusted for bone area (BMC for bone area), bone area adjusted for height (bone area for height), and height adjusted for age (height for age). In non-technical terms these components can be thought of as ‘light bones’, ‘narrow bones’, and ‘short bones’, respectively. Taken in reverse order they provide a logical sequence of possible explanations for the finding of a low BMC in a patient.
The aim of the present study was to provide centile curves for bone size and BMC for use in both research and clinical practice.
Subjects and methods
SUBJECTS
Schoolchildren from five schools in Copenhagen participated in the study. A letter of information was given to their parents, who completed an informed consent form before examination. Adolescents aged 18 years or older completed the consent form themselves. The study was approved by the ethics committee for Copenhagen and Frederiksberg. Among those who were approached, 219 (27%) of 798 girls and 155 (22%) of 701 boys agreed to participate. For this analysis, 31 were excluded because of non-white origin (n=17), chronic disease (n=8), medication that might affect bone mineralisation (n=2), incomplete DXA scanning (n=2) or a large metal ornament, that could not be removed, interfering with the DXA results (n=2). The remaining 201 females (age 4.9–19.3 years) and 142 males (age 5.6–19.1 years) participated in the study. The sex and age specific medians and ranges of height and weight are shown in table 1.
Age, height, and weight according to gender and age group (median, range)
ANTHROPOMETRY
Height and weight were measured before DXA scanning. Height was determined to the nearest 1 mm using a stadiometer. Weight was measured to the nearest 0.1 kg using a digital electronic instrument. Subjects wore only pants and a cotton T-shirt when weighed.
BONE MINERAL ASSESSMENT
Whole body BMC measured in g hydroxyapatite and bone size expressed as anterior-posterior projected bone area measured in cm2 was determined by DXA scanning using a Hologic 1000/W (Hologic Inc, Waltham, MA). For analysis, software version 5.61 was used. Subjects wore only pants and a cotton T-shirt during the scan. For quality control, spine phantoms were scanned daily. The coefficient of variation for these BMC and bone area measurements on a spine phantom over a period of two years (n=358) was 0.37% and 0.28%, respectively. The entrance radiation dose level was 15 μSv, with an effective dose not more than 10 μSv, equal to about one day’s background radiation in Denmark.
STATISTICAL METHODS
The weight for height and the height for age distribution of the individuals was compared graphically with a Danish sex specific standard.21 The fractions of the data in each of the six groups delimited by the 10th, 25th, 50th, 75th, and 90th centile in the weight for height standard were compared with the theoretical probabilities by a χ2 test with five degrees of freedom. The height for age SD score (Z score) was symmetrically distributed when plotted against age in both sexes (data not shown) and the sex dependent overall mean and SD of the Z scores were calculated.
Smooth cross sectional centile curves for bone area and BMC versus age, bone area versus height, and BMC versus bone area were derived using the LMS method.22 This summarises the distribution of the dependent variable given the covariate by a Box-Cox power (L) depending on the skewness of the distribution, the median (M), and coefficient of variation (S) giving smooth curves for the dependence of L, M, and S on the covariate. The present data seemed to be fairly symmetrically distributed given the value of the covariate. Therefore, the value of L was fixed to 1 corresponding to the normal distribution, while the curves of M and S were estimated. The Z score of an observed value of for example, BMC may be calculated in the usual way as Z = (BMC-mean)/SD using the mean (mean = M) and SD (SD = M*S) based on the estimated M and S curves. The ranges of the covariates were reduced in order to eliminate edge effects due to single extreme values. Thus we considered the age interval 6–19 years (both sexes), height intervals 120–181 cm (girls) and 120–190 cm (boys), and bone area intervals 700–2400 cm2 (girls) and 700–2500 cm2 (boys).
To test whether BMD calculated as BMC/bone area provides an adequate correction of BMC for bone area, the regression coefficients of BMC on bone area (both log transformed), were compared to 1 by Wald’s test. Confidence intervals for parameter estimates were based on Wald’s test.
Results
Both girls and boys were heavier for height and heigher for age than the present Danish standards based on data from 1974.21 The numbers of individuals in each of the six groups delimited by the 10th, 25th, 50th, 75th, 90th centile in the weight for height standard were 18, 21, 37, 46, 48, 31 and 15, 22, 32, 33, 20, 20, for girls and boys, respectively. The difference from the expected distribution was significant for the girls (χ2(5) = 23.3, p<0.001) but not the boys (χ2(5) = 3.0, p>0.2). The mean (SD) of the height for age Z scores was 0.35 (0.99) for girls and 0.45 (1.04) for boys, both significantly different from zero (both p<0.001).
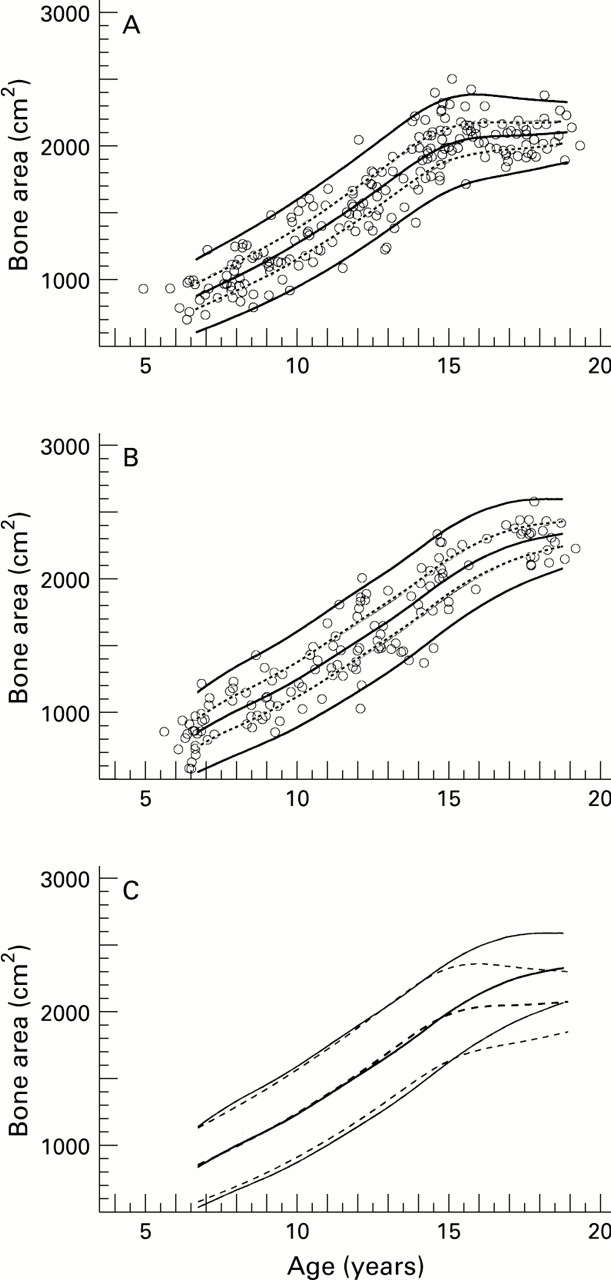
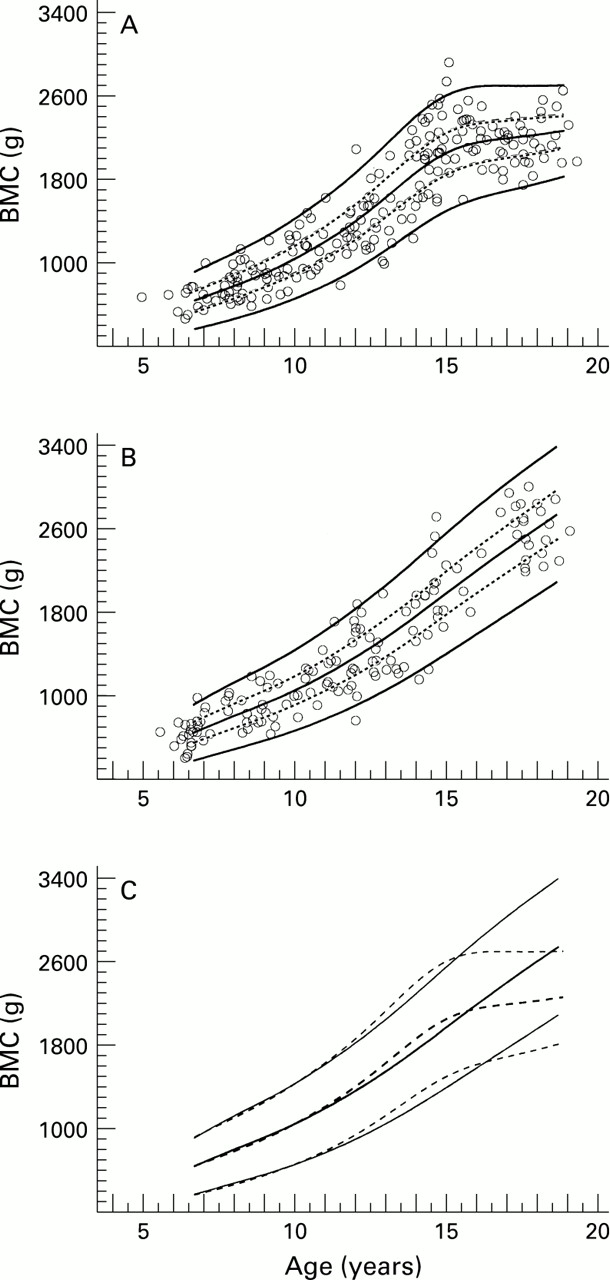
The sex specific age dependent centile curves for bone area (fig 1) and BMC (fig 2) showed a large variation around the median. The curves were very similar for the two sexes from 6 to 11 years of age for both bone area (fig 1C) and BMC (fig 2C). From 11 to 15 years of age the BMC for age curves were slightly higher for the girls than for the boys (fig2C). However, the main sex difference was an earlier flattening of the girls’ curves around the age of 15 years for both bone area (fig 1C) and BMC (fig 2C). The bone area and BMC curves were of similar shape except that bone area was flatter at the top end. Thus there was a distinct flattening of the bone area curve for boys after the age of 16 years, whereas for BMC the deflection was less evident. At 18.5 years, the median bone area was 12% higher in boys than in girls (2335 cm2 v 2083 cm2), and the median BMC was 21% higher in boys than in girls (2698 g v 2238 g). The estimated mean and SD values by sex and age appear in table 2for bone area and in table 3 for BMC.

Centile curves for whole body bone area according to age in girls (A) and boys (B). The solid curves are the median and the 3rd and 97th centiles of the normal distribution with mean and SD as shown in table 2. The dotted lines show the interquartile ranges. The median and outer centiles for girls (dashed lines) and boys (solid lines) are shown together in (C).

Centile curves for whole body BMC according to age in girls (A) and boys (B).The solid curves are the median and the 3rd and 97th centiles of the normal distribution with mean and SD as shown in table 3. The dotted lines show the interquartile ranges. The median and outer centiles for girls (dashed lines) and boys (solid lines) are shown together in (C).
Bone area for age. Estimated mean and SD for bone area (cm2) by sex and age. The mean and SD are estimated for each sex by the LMS method (see methods)
BMC for age. Estimated mean and SD for BMC (g) by sex and age. The mean and SD are estimated for each sex by the LMS method (see methods)
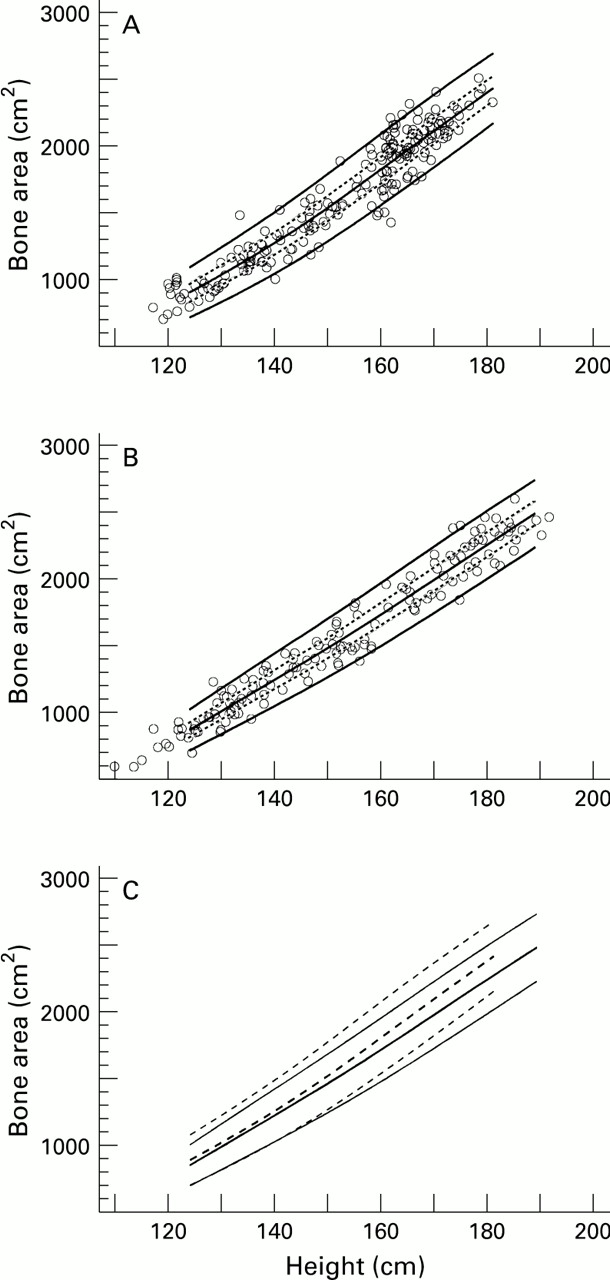
The sex specific height dependent centile curves for bone area (fig 3) showed that bone area was much closer associated with height than with age for both girls (figs 1A and 3A) and boys (figs 1B and 3B). Bone area for height was higher in girls than boys (fig 3C). Table 4 shows the estimated mean and SD values for bone area for height by sex.

Centile curves for whole body bone area according to height in girls (A) and boys (B).The solid curves are the median and the 3rd and 97th centiles of the normal distribution with mean and SD as shown in table 4. The dotted lines show the interquartile ranges. The median and outer centiles for girls (dashed lines) and boys (solid lines) are shown together in (C).
Bone area for height. Estimated mean and SD for bone area (cm2) by sex and height. The mean and SD are estimated for each sex by the LMS method (see methods)
The sex specific bone area dependent centile curves for BMC (fig 4) showed a very close association between BMC and bone area for both girls and boys, especially for the smaller values of bone area. For bone area above 1500 cm2, BMC for bone area was higher for girls than boys (fig 4C). Table 5 shows the estimated mean and SD values of BMC for bone area by sex.

Centile curves for whole body BMC according to bone area in girls (A) and boys (B). The solid curves are the median and the 3rd and 97th centiles of the normal distribution with mean and SD as shown in table 5. The dotted lines show the interquartile ranges. The median and outer centiles for girls (dashed lines) and boys (solid lines) are shown together in (C).
BMC for bone area. Estimated mean and SD for BMC (g) by sex and bone area. The mean and SD are estimated for each sex by the LMS method (see methods)
The regression coefficient of BMC on bone area was 1.43 (95% confidence interval (CI) 1.41 to 1.46) for the girls and 1.37 (95% CI 1.34 to 1.40) for the boys.
Discussion
We have presented centile curves of whole body bone area and whole body BMC for healthy school age children. We have chosen not to use BMD calculated as BMC/bone area because BMD measured with anterior-posterior osteodensitometry represents a mixture of true density and skeletal size.20 23 24 Note that the regression coefficient for log transformed BMC on log transformed bone area may be interpreted as a power for bone area. In the present data, the regression coefficient was highly significantly different from 1, indicating that the use of BMD would only partially adjust for bone area.
We suggest that our data are used as a reference for assessing bones of children for clinical or research purposes. To our knowledge it is the most comprehensive data on whole body measurements available at present, but there are some limitations to the use of this data set as a reference. Due to the limited number of children in each age and sex group, we cannot evaluate the tail probabilities of the distributions, indicated by the outer centiles in figs 1-4. Only 25% of the children approached agreed to participate. We have no data to compare the social background of participating and non-participating children, but it is our impression that there were no major differences. In a study that also measured weight and body composition, we had expected that overweight children would be less inclined to participate, that is that overweight children would be under-represented. The weight for height distribution indicated that this was probably not the case. The children were heigher for age and heavier for height compared with the reference data of Andersen et al,21 in accordance with the general pattern that both the height of children and the number of overweight children has increased in Scandinavia.25-27 The sex specific height for age and weight for height standards of Andersen et al are 20 years old, but they are the only Danish standards available.
Three studies have previously reported data on children’s whole body BMC measured with the Hologic 1000/W. Lloyd et al found a median BMC of 1218 g (range 799–2083 g) and an average BMC of 1276 g (SEM 26 g) in American girls whose median age was 11.9 years (range 10.7–13.3 years).28 Considering the girls of the same age range in our data (median age 12.2 years), the median BMC was 1300 g (range 779–2080 g), and the average BMC was 1352 g (SEM 46 g). The difference in average BMC was not significant, and the direction was in accordance with the slightly higher median age in our data. Faulkneret al published data for whole body BMC in Canadian girls and boys aged 8–16 years.16 Our age specific averages of whole body BMC were within 267 g below and 173 g above the average values of Faulkner et al, with no systematic age dependent difference, and the individual differences were not significant (Wald’s test with Bonferroni correction). Hannan et alreported regression models for the dependence of BMC on age alone and on age, height, and weight simultaneously in 11–18 year old Scottish girls.17 We have re-estimated the coefficients in their regression models based on those of our girls aged 11–18 years who were within the ranges of height, weight, and body mass index of their data (n=115). For the model consisting only of a second degree polynomial in age, our coefficients were not significantly different from those of Hannan et al, whereas for the model including weight and height, the two sets of coefficients were significantly different. Thus the relation between BMC and age may not be very different between countries, partly because of the large variation in BMC at each age.
The lower trend in whole body BMC with age in girls during the years after puberty in our study corresponded with other cross sectional studies of whole body BMC6 8 17 and lumbar BMC.7 It has previously been shown that lumbar BMC (L2–L4) in boys, in contrast to girls, continues to rise after puberty.7 29 In a cross sectional study (age 4–26 years), Ogle et al found that whole body BMC increased until the late teens with a flattening after 17.4 years in males while peak BMC was attained at 15.7 years in females.8 This is in agreement with our results for girls, while the flattening for boys was less clear, possibly because of our narrower age range. In a cross sectional study, Mosekilde found sex differences in vertebral bone growth in adults, as men but not women have a continued periostal bone growth.29 The modest increase in BMC after puberty in girls indicates that prepuberty and puberty, especially in girls, are important periods for achieving optimal peak bone mass.
Bonjour et al have previously published data on lumbar bone area by age in boys and girls aged 9–18 years.30 To our knowledge, data on whole body bone area have not been published previously. The pattern of bone area by age was similar to that of BMC in both girls and boys, except for a more pronounced levelling off of the bone area curves after puberty. Apparently, bone area peaks earlier than BMC in both girls and boys. The narrowing of the centiles for higher ages for girls may be an artifact due to edge effects.
The BMC for bone area curves were fairly similar for the two sexes, with little variation in BMC for given bone area. Thus it seems that the differences in BMC in these healthy children to a large extent is due to differences in bone size.
In clinical paediatric practice, it is insufficient to express BMC according to age alone, both because of the considerable variation in bone and body size for a given age, and because chronic disease affecting bone mineralisation often affects body and bone size as well. Several studies have shown that it is unsatisfactory and might lead to misinterpretation if BMC is expressed according to age only. Atkinsonet al found that preterm infants had lower BMC growth than term infants at the same gestational age, but when corrected for weight, there was no difference.31 Issenman et al found that bone density (radius) in children with Crohn’s disease was less abnormal when compared with height matched references than when compared with age matched references.32 Younget al found a lower bone density in the arm in both ballet dancers and girls with anorexia compared with normal girls of the same age, but the difference disappeared when they corrected for weight.33 Russell-Aulet et al found that the difference in BMC between white and Asian women could be explained by body size.34
The centile curves presented here can be used to validate whether a reduced whole body BMC is primarily due to a reduction in bone size or primarily due to a reduction in size adjusted BMC. A reduced bone mass may be due to short bones, narrow bones, or light bones, possibly with different health implications. We, therefore, recommend that evaluation of whole body BMC for children be separated into three parts as outlined in the appendix: (1) Is the child’s height appropriate for age? (‘short bones’); (2) Is the bone size (bone area) appropriate for height? (‘narrow bones’); (3) Is the BMC appropriate for bone area? (‘light bones’). For daily clinical use, an individual may be plotted on centile charts like figs 1-4. Single copies of large centile charts may be obtained from the authors. If a more accurate centile or Z score is required, the Z score may be calculated in the usual way using the estimated mean and SD values presented in tables2-5. An example of calculation of Z scores and centiles is presented in the , evaluating the BMC of a young man with galactosaemia and a girl with myositis treated with corticosteroid. Note, the latter example shows that a normal BMC for age does not preclude an abnormally low BMC for bone area, if the bone size of the individual is above average.
In conclusion, BMC depends on bone length, bone width, and bone density. The health implication of a reduced value is likely to depend on which of the three factors is responsible for the reduction. Therefore, it may be valuable to distinguish between these three factors, both when bone mass is assessed, and when the effect on BMC of some independent variables like nutrition, physical activity, etc is examined.
Acknowledgments
This study was financed by FØTEK (Food Technology Research and Development Programme) and the Danish Dairy Research Foundation. We thank M Andersen, Department of Biostatistics, University of Copenhagen for modifying the LMS computer program for the DOS platform. We thank J Müller, Department of Growth and Reproduction GR, Rigshospitalet, Copenhagen for useful comments on earlier versions of the manuscript and S Atkinson, McMaster University, Canada, for valuable help during the early phases of the project.
Appendix
Examples of calculation of Z scores:
EXAMPLE 1:
Male with galactosaemia age 18.5 years, height 164.9 cm, weight 57 kg, BMC 1916 g, and bone area 1977 cm2.
BMC for age: M and SD values for age 18.5 years in table 3: M=2698 g, SD=345. Z = (1916-2698)/345 = -2.27 corresponding to the 1st centile in a standard normal distribution.
Height for age: Calculated from the reference data of Andersen et al 21 : Z= -2.26 corresponding to the 1.2th centile in a standard normal distribution.
Bone area for height: M, and SD values for height 164.9 cm are calculated by linear interpolation from values in table 4: M = 1845 g, SD=128.5. Z = (1977-1845)/128.5 = 1.03 corresponding to the 85th centile.
BMC for bone area: M and SD values for bone area 1977 cm2 are calculated by linear interpolation from values in table 5: M = 1918 g, SD=105. Z = (1916-1918)/105 = -0.02 corresponding to the 49th centile.
Conclusion: The man with galactosaemia has an abnormally low whole body BMC for age, but this is due mainly to a reduced height.
EXAMPLE 2:
Girl with a corticosteroid treated myositis age 12.6 years, height 148.8 cm, BMC 1266 g, and bone area 1641 cm2.
BMC for age: M and SD values for age 12.6 years are calculated by linear interpolation from values in table 3: M=1528 g, SD=258. Z = (1266-1528)/258 = -1.02 corresponding to the 15th centile in a standard normal distribution.
Height for age: Calculated from the reference data of Andersen et al 21 : Z= -0.75 corresponding to the 23th centile in a standard normal distribution.
Bone area for height: M and SD values for height 148.8 cm are calculated by linear interpolation from values in table 4: M = 1494 cm2, SD=132. Z = (1641-1494)/132 = 1.11 corresponding to the 87th centile.
BMC for bone area: M and SD values for bone area 1641 cm2 are calculated by linear interpolation from values in table 5: M =1493 g, SD=73. Z = (1266-1493)/73= -3.11 corresponding to the 0.1th centile.
Conclusion: The girl has an abnormally low BMC for bone area, but because she has wide bones BMC for age is within the normal range. The low BMC for bone area might be a consequence of the corticosteroid treatment.