


Abstract
Background: The aim of this study was to investigate the association of childhood and adulthood social class with the occurrence of specific diseases, including those not associated with a high mortality rate, and to investigate daily stress as the mechanism for that part of any association which cannot be accounted for by established risk factors. Methods: This was a prospective cohort study with 25 years of follow-up for cause-specific morbidity and mortality. A total of 5577 Scottish men were recruited from 27 workplaces in the West of Scotland. Childhood social class was determined from the occupation held by the individual's father, and adulthood social class from the individual's occupation at enrolment. Daily stress was measured at enrolment using the Reeder Stress Inventory. Results: Health differentials were found for cardiovascular diseases, lung cancer, peptic ulcer, asthma, accidents and violence, alcohol-related diseases, and perhaps psychiatric illness. Adulthood circumstances were associated with the incidence of most diseases in adulthood, the exception being stroke, which was strongly associated with less privileged circumstances in childhood. Both childhood and adulthood circumstances contributed to the incidence of coronary heart disease. Daily stress did not underlie any of these associations once the influence of established risk factors had been taken into account. Conclusions: Socioeconomic circumstances in childhood and adulthood both contribute to health differentials in adulthood, the relative contributions depending upon the particular disease. Where known risk factors explained only part of the excess of a disease among individuals raised or living in less-privileged circumstances, there was no evidence to suggest that daily stress was the reason for the unexplained excess.
In nineteenth and twentieth century Britain, evidence accumulated of higher mortality among individuals living in socioeconomically deprived circumstances.1–6 Such individuals also experience greater exposure to risk factors for the predominant causes of death [smoking, high alcohol consumption, low physical activity, impaired lung function, high blood cholesterol, high diastolic blood pressure and high body mass index (BMI)].2,4,7,8 More recently, evidence has been presented which suggests that socioeconomic deprivation during childhood is associated with higher mortality,9–12 morbidity11,13,14 and exposure to some risk factors during adulthood;7,11 these associations existing independently of the effects of adulthood circumstances.
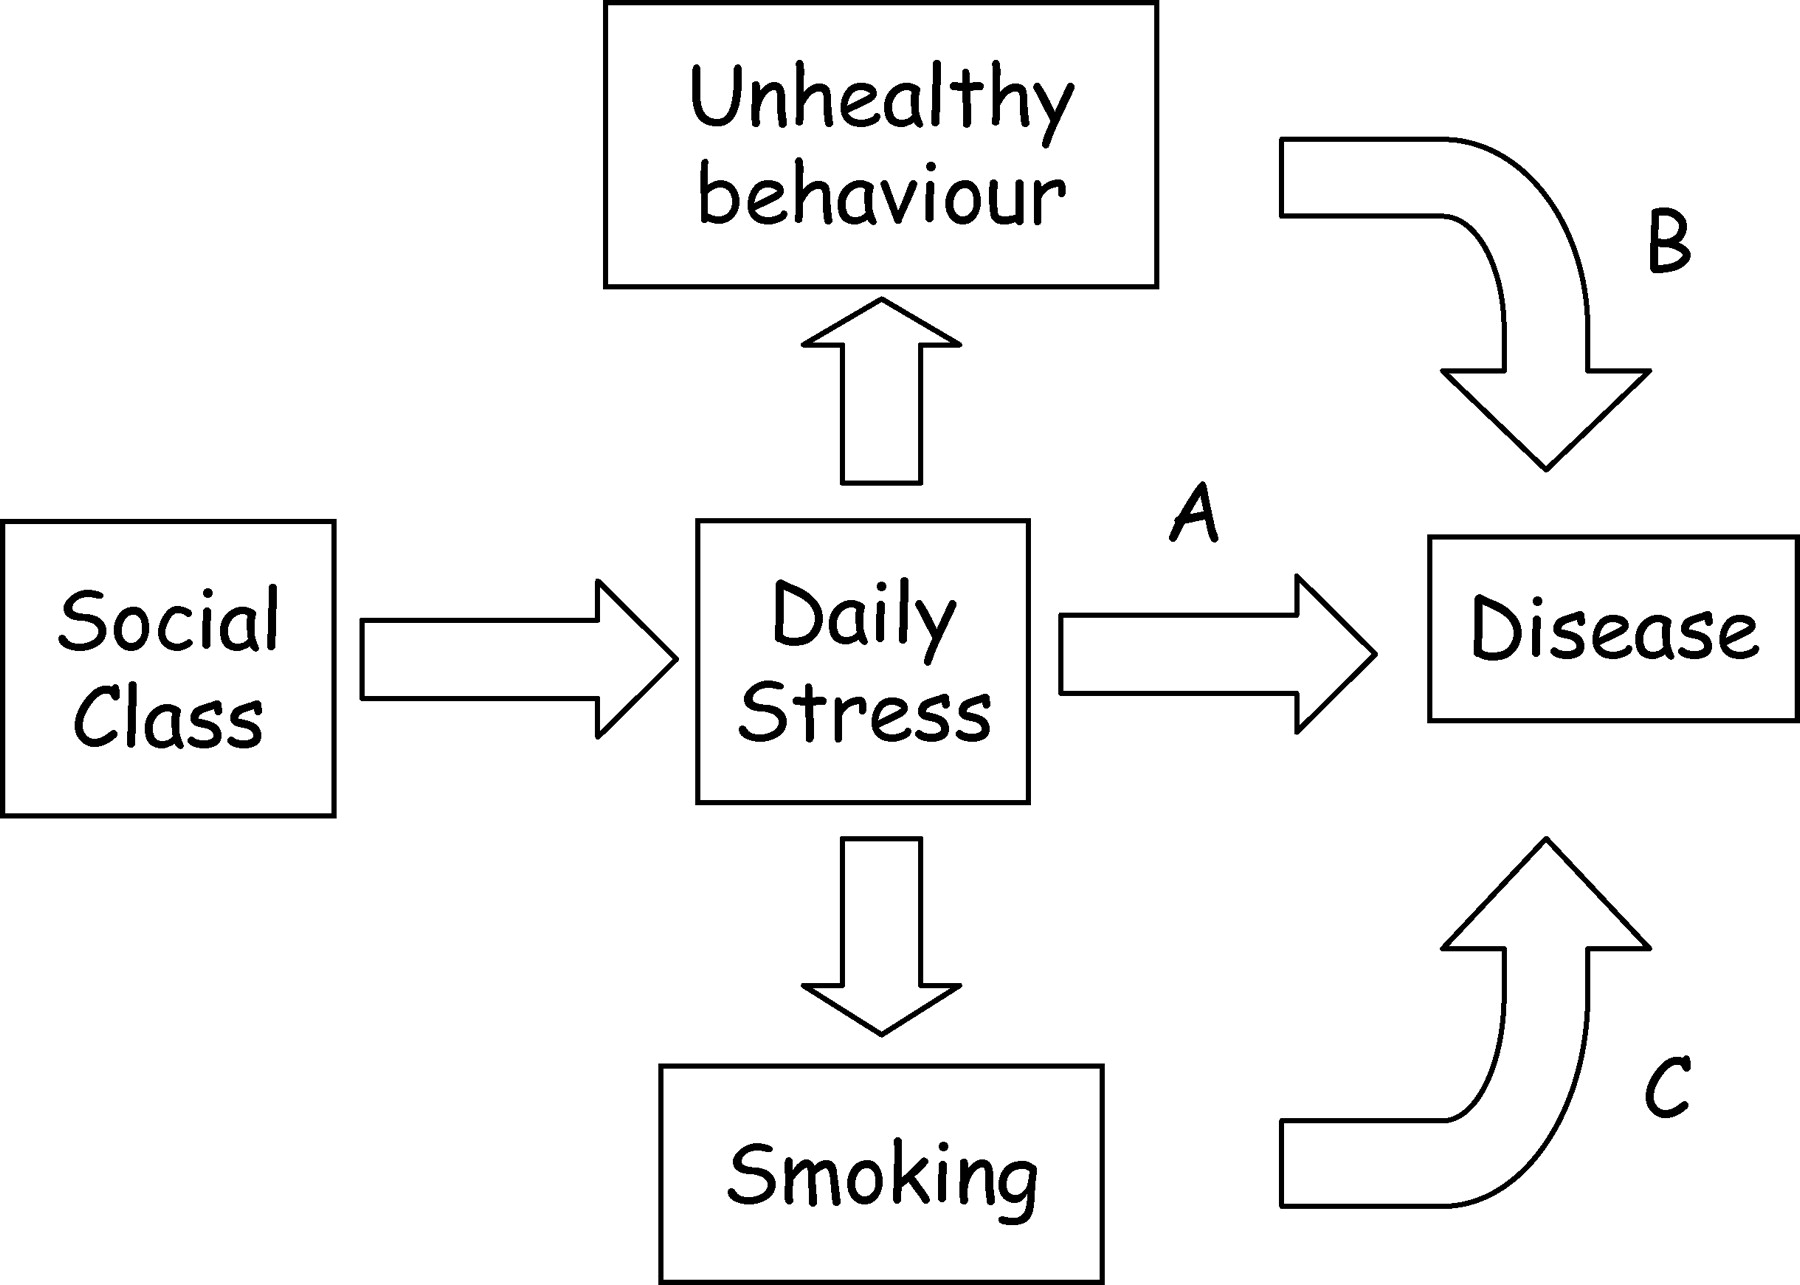
Known risk factors only partly explain the association between disease in adulthood and circumstances during childhood10,11,13 and adulthood.15,16 This has prompted the proposal that higher exposure to psychological factors, such as stress, makes an additional contribution to the association.17,18 Higher levels of daily stress have been hypothesized to arise from a higher occurrence of negative life events among those living in relatively deprived circumstances,17,18 and from the development of poorer coping mechanisms among those growing up in such circumstances.19 While stress affects unhealthy behaviour (figure 1, pathway B),17 such as cigarette smoking (figure 1, pathway C), it is the possible direct impact upon health through a neuroendocrine pathway (figure 1, pathway A) that may allow stress to make an additional contribution to the social circumstances—disease association, beyond that attributable to known risk factors.
This study is of a cohort of working males for whom hospital admissions and deaths have been observed over 25 years. Hospital admissions data provide information on all diseases diagnosed during inpatient stays and allow investigation of diseases that are rarely reported as the principle cause of death. This allows us to build upon work that has used mortality data for the same cohort.7,9,10,20,21 As in those studies, this paper aims to quantify the separate effects of childhood and adulthood socioeconomic circumstances on disease in adulthood, and to uncover the mechanisms underlying these associations. Beyond the known risk factors for each disease group, this study investigates the additional role of daily stress.
Methods
Participants
The study cohort has been described previously.7,9,10,22 Employees were recruited between 1970 and 1973 from 27 work places in the West of Scotland. Some 6022 men (∼70% of those invited) completed a questionnaire and attended a health examination. This study is based on 5577 men, aged between 35 and 64 years, for whom complete data are available.
In all, 188 men were excluded due to missing at least one baseline measure, this being father's occupational class in 112 cases, plasma cholesterol in 39 cases and stress in 19 cases. Bias is unlikely to have resulted from the exclusion of these men. They were of the same average age as men with complete data, and were no more likely to hold a manual occupation. Comparing the incidence of the nine disease outcomes gave only weak evidence of a higher incidence of all-cause death (45% versus 40%; P=0.19) and peptic ulcers (8.0% versus 4.7%; P=0.040) among the excluded men.
Baseline measures
Sociodemographic data. Father's main occupation and participant's occupation at enrolment were used to determine social class using the Registrar General's classification.23
Health-related behaviours. Participants are divided into those who never smoked cigarettes, ex-cigarette smokers who stopped >1 year before enrolment and those who were smoking 1–14, 15–24 and 25 or more cigarettes per day. With lung cancer as the disease outcome, the age at which current smokers had started smoking, whether they inhaled and whether they smoked filtered cigarettes are also recorded as additional risk factors. Current alcohol consumption was categorized as none, 1–7, 8–14, 15–21, 22–34 and ≥35 units in a week. Physical exercise was categorized into those who exercised outside work for <5, ≥5 but <10, and ≥10 h per week.
Daily stress. The Reeder Stress Inventory was included in the baseline questionnaire as a measure of daily stress.24 There are four statements: ‘In general, I am usually tense or nervous’, ‘There is a great deal of nervous strain connected with my daily activities’, ‘At the end of the day I am completely exhausted mentally and physically’ and ‘My daily activities are extremely trying and stressful’. The respondent indicates whether each statement described them ‘exactly’, ‘to some extent’, ‘not very accurately’ or ‘not at all’. Scores range from 1 to 8, with 8 indicating high stress.24,25 Despite its age, the factor structure,26 content validity and test–retest reliability25 of the Reeder Stress Inventory support its continued use as a measure of daily stress.
Physical examination. Height, BMI, diastolic blood pressure, lung function (forced expiratory volume in 1 s, FEV1) and plasma cholesterol concentration data were obtained by physical examination. FEV1 was recorded as a percentage of that predicted for a healthy subset of the cohort.10
Summary data for baseline measures of risk factors have been reported previously. In brief, there were gradients across social classes such that men in manual occupations were on average older, had higher systolic and diastolic blood pressure, lower cholesterol, similar BMI and poorer lung function, and were more likely to be current smokers.20 Similar gradients were seen with social class based upon the fathers' occupation, other than the absence of a gradient in age and higher BMI among men with fathers in manual work.10
Outcome measures
For a 25-year follow-up period, mortality was monitored at the National Health Service central registry. Death certificates coded the primary cause of death according to the ninth revision of the International Classification of Diseases (ICD-9). Hospital admissions for the same period are taken from the Scottish Morbidity Records of acute hospital discharges (SMR1).27 Up to six diagnoses were recorded for each discharge, these being coded according to the contemporaneous revision of the International Classification of Diseases (ICD-8, ICD-9 or ICD-10). Cancer registrations until the end of 1996 were available from SMR6, cancer site being recorded according to the ICD-9. SMR4 was used to provide information on admission to psychiatric hospital, but with cases of ‘non-organic psychosis and neurosis’ also being retrieved from SMR1.
These different sources of information were used to determine the age at which a man was first diagnosed with each diseases of interest (see tables 2, and 4 for ICD codes). These diseases have a purported role for psychological stress in their aetiology, with the consequent possibility that stress may underlie an unexplained excess incidence of the disease among men raised or living in relatively deprived circumstances.
Statistical analysis
Analyses were performed using Stata statistical software, version 8 (StataCorp, College Station, TX, USA). With age at disease onset as the outcome measure, Cox's proportional hazards regression was used with date of birth as the time scale origin, and allowing for different ages at enrolment. Mortality was also investigated in this way when the disease-specific rate was sufficiently high. While a gradient in incidence was apparent across the range of social class (I + II, IIIN, IIIM, IV + V) for most outcomes, the distinction between non-manual and manual classes invariably captured the greater part of the association and so is used here for clarity of presentation. Separate analyses were carried out investigating the links between having a father in a manual occupation and disease outcome, and between current manual occupation and disease outcome. Secondly, for each of those two analyses, current social class and father's social class, respectively, were controlled, each being included in the regression models as four categories (I + II, IIIN, IIIM, IV + V). This allowed evaluation of the specific effects of social class during childhood and during adulthood. A third analysis also controlled for exposure to known risk factors, to examine the role of these risk factors in mediating the effects of childhood and adulthood social class. Finally, we additionally controlled for reported stress, to investigate whether stress mediated that part of the effect of socioeconomic position that could not be explained by known risk factors (figure 1, pathway A).
Results
Median age at recruitment among the 5577 men was 48 years. Table 1 shows that men in non-manual occupations report higher mean Reeder Stress Inventory scores, corresponding to higher levels of stress. This pattern is replicated when father's occupation is considered. Looking at circumstances over the life-course, the mean Reeder Stress Inventory score was higher for individuals with longer and more recent exposure to relatively privileged circumstances.
Table 2 presents evidence of associations between working in a manual occupation and higher rates of all-cause death, coronary heart disease and stroke. A comparable and independent effect of socioeconomic circumstances in childhood was observed for all-cause death and coronary heart disease. The association between social class and stroke incidence appears to originate in childhood, with little evidence of an additional effect of adulthood social class. Known risk factors mediated only part of these associations, with no evidence of an additional role for stress.
Table 3 shows the effect of childhood and adulthood circumstances on lung cancer, gastric and duodenal ulcer, and asthma. Social class in adulthood is particularly important for the incidence of lung cancer, much of this association being mediated by known risk factors, with no evidence of an additional role for stress. The association between childhood circumstances and gastric and duodenal ulcer is entirely mediated by adulthood circumstances. Known risk factors mediate part of this association, with stress playing no additional role. For asthma, a manual occupation in adulthood is associated with a higher hospital diagnosed incidence. In contrast, there is weak evidence that, conditional on adulthood social class, a father in a manual occupation will protect the individual from asthma in adulthood. Known risk factors explain part of the association between asthma and adulthood circumstances, while stress plays no part in either association.
Accidents and violence, alcohol-related disease and psychiatric illness are considered in table 4. Manual work in adulthood is associated with a higher rate of death or hospitalization due to accidents and violence, with no additional effect of childhood circumstances. Alcohol consumption accounts for part of this association, but with no additional role for stress. The same pattern is apparent for death or hospitalization due to alcohol-related causes, with alcohol consumption accounting for almost all of the association. There is no evidence in these data of an influence of father's manual occupation on the incidence of admission for psychiatric illness, but weak evidence that an individual's own manual occupation may increase the risk. Adjustment for stress strengthens this relationship suggesting that variations in stress may be obscuring the association.
Discussion
Diseases vary in whether exposure to less-privileged circumstances during childhood, adulthood or both is associated with a higher risk. In this study we have found the risk of stroke to be most closely associated with childhood circumstances, the risks of lung cancer, gastric and duodenal ulcers, asthma, accidents and violence, alcohol-related disease, and non-organic psychosis and neurosis to be associated with circumstances in adulthood, and the risks of coronary heart disease to be associated with circumstances in both childhood and adulthood. Possible reasons for this include disease-specific susceptibility to exposure being restricted to a particular period of maturation, and exposure to mediating factors being restricted to particular age groups. There was no evidence in this male cohort for daily stress being responsible for any unexplained excess of disease among those exposed to less-privileged circumstances.
This study provides further evidence that socioeconomic conditions in both childhood and adulthood are important for coronary heart disease risk in adulthood. This finding has been discussed previously.28,29 Established risk factors for coronary heart disease did not fully account for these associations, and despite a large literature supporting a role for daily stress in mediating the link between deprived circumstances and coronary heart disease,30,31 no evidence of such a role was found in this study. This study also provides further evidence that it is socioeconomic circumstances in childhood that are associated with stroke in adulthood.14,29 Consistent with a recent Danish study,32 there is no evidence that daily stress mediates this association.
The present study found manual work in adulthood to be associated with a higher risk of lung cancer, with traditional risk factors accounting for a large part of this association. There was no evidence of a role for stress in explaining the remainder of the association (Table 3). Furthermore, despite high daily stress being associated with higher cigarette consumption in the current cohort,26 repeating the analysis without controlling the effects of smoking (so allowing investigation of pathway C in figure 1) did not give evidence that stress-induced smoking was behind the excess of lung cancer among men in manual occupations.
Peptic ulcer is a classic stress-related illness.33 While Helicobacter pylori infection is now known to underlie most peptic ulcer disease, a role for psychological stress through an interaction with such infection has recently been proposed.34 While H. pylori infection usually occurs among those whose childhood home was shared with several siblings,35,36 in the present study manual occupation in adulthood was associated with a higher incidence of gastric and duodenal ulcers, with no independent influence of a having a father in manual work. The findings may have been different if a direct measure of crowding in childhood had been taken as the risk factor; a large number of siblings being associated with a higher risk of peptic ulcer in the current cohort.37 There was no evidence of daily stress underlying the unexplained excess of peptic ulcers in men in manual occupations, and this remained the case with the addition of the interaction between daily stress and number of siblings.
A role for psychological stress in the aetiology of asthma has been hypothesized.38 Asthma is associated with manual occupation in adulthood,39 with evidence of early determinants of adulthood lung function7,40,41 and the childhood origins of much adulthood asthma42 suggesting a role for childhood circumstances. Examining the independent effects in the present study, having a father in a manual occupation seems protective of asthma, while an individual in a manual occupation appears to be at higher risk. These results are difficult to reconcile with the finding that asthma begins in childhood and persists into adulthood, especially without evidence of an impact of asthma upon occupation.42 In any case, there is no evidence in this cohort to suggest that daily stress is behind either association between socioeconomic position and asthma. Perhaps the relationship between psychological stress and asthma is too complex to be apparent from the small number of cases in this cohort,38 especially if subtypes of asthma must be distinguished.43
The pattern of deaths resulting from accidents or violence in the current cohort is primarily related to socioeconomic circumstances in adulthood.10 This finding was replicated when deaths and hospital admissions were considered. Recent alcohol consumption plays a large part in the occurrence of accidents and violence,44 and is observed here to underlie part of the association with adulthood circumstances. Looking specifically at alcohol-related disease, again it is an individual's own manual occupation that raises the risk of illness, this association being entirely mediated by alcohol consumption with no role for daily stress. Furthermore, despite high daily stress being associated with greater alcohol consumption in the current cohort,26 repeating the analysis without controlling the effects of alcohol consumption (so allowing investigation of pathway B in the figure 1) gave no evidence for stress-associated heavy drinking being behind the higher incidence of alcohol-related illness among men in manual occupations.
While there is evidence that hardship in childhood has long-term consequences for mental health,45,46 the present study failed to provide any evidence of an effect of childhood circumstances on non-organic psychosis and neurosis in adulthood. Perhaps few individuals with psychiatric illness originating in childhood remain in the labour market long enough to be recruited to a study such as the present one. There was weak evidence of an association between an individual's own manual occupation and psychiatric hospital admission. Stress did not mediate this relationship despite behavioural and biological models that suggest it should,19,47 and a strong association in the current cohort between perceived daily stress and risk of admission for psychiatric illness.48
Consistent with the observation of greater daily stress among individuals with non-manual occupations in the current cohort, and previous work which failed to demonstrate associations between high stress and greater risks of cause-specific mortality,48 we found no evidence of daily stress accounting for any deprivation-linked excess of disease in men beyond what could be explained by known risk factors. This finding does not discount a role for stress in influencing exposure to those known risk factors, and associations with greater cigarette consumption, greater alcohol consumption, less recreational exercise and higher blood pressure have been demonstrated in the current cohort.26 However, we found no evidence of stress-associated heavy smoking and drinking being behind the excesses of lung cancer and alcohol-related illness among men in manual occupations.
This study has used the combination of diagnoses made in hospital, cancer registration and causes of death, to allow consideration of social class variations in diseases that rarely lead to death. However, in addition to influencing the occurrence of disease, it is possible that an individual's socioeconomic position will influence the timing and nature of diagnosis and treatment,49,50 necessitating a more cautious interpretation of disease rates when cases detected in hospital are included. Additional caution is needed for outcomes represented by only a modest number of events (e.g. asthma), as the obtained results for these outcomes are subject to a greater degree of sampling error.
This study supports a widespread association of socioeconomic circumstances with health, but with variability across diseases in whether it is exposure to less-privileged circumstances during childhood, adulthood or both that elevates risk. For each disease, known risk factors mediate only part of the relationship with socioeconomic circumstances, with no role for daily stress in accounting the remainder.
It has been proposed that greater daily stress in individuals of manual social class may explain the higher rates of disease and mortality experienced by those individuals. Higher daily stress may directly affect disease and mortality through a neuroendocrine mechanism (pathway A) or indirectly through its influence on known risk factors (pathway B), particularly smoking (pathway C).
Daily stress according to participant's current and their father's social class
| Reeder stress inventory | P for trend | |||||
|---|---|---|---|---|---|---|
| n | Mean (SD) | |||||
| Own social class | <0.001 | |||||
| I/II | 1814 | 4.34 (1.38) | ||||
| IIIN | 1002 | 3.73 (1.60) | ||||
| IIIM | 1603 | 3.62 (1.74) | ||||
| IV/V | 1158 | 3.27 (1.74) | ||||
| Father's social class | <0.001 | |||||
| I/II | 773 | 4.24 (1.49) | ||||
| IIIN | 572 | 4.03 (1.59) | ||||
| IIIM | 2431 | 3.83 (1.63) | ||||
| IV/V | 1801 | 3.52 (1.72) | ||||
| Social class over the life-course | ||||||
| Father and participant non-manual occupation | 1135 | 4.24 (1.49) | <0.001 | |||
| Father manual, participant non-manual occupation | 1681 | 4.05 (1.48) | ||||
| Father non-manual, participant manual occupation | 210 | 3.67 (1.67) | ||||
| Father and participant manual occupation | 2551 | 3.46 (1.75) | ||||
Hazard ratios and confidence intervals (CI) for mortality, and for mortality or hospital admission for men with fathers of manual social class compared with a baseline of men with fathers of non-manual social class, and for men of adulthood manual social class compared to a baseline of men with adulthood non-manual social classa
| Cause and outcome | Controlling for | Father's manual social class | Own manual social class | |||||||
|---|---|---|---|---|---|---|---|---|---|---|
| Hazard ratio | 95% CI | Hazard ratio | 95% CI | |||||||
| All causes (ICD-9: 001–995) | ||||||||||
| Death | Age | 1.49 | 1.34–1.65 | 1.41 | 1.30–1.54 | |||||
| (n=2255) | Age, social class at other time point | 1.29 | 1.15–1.44 | 1.29 | 1.17–1.41 | |||||
| Age, social class at other time point, risk factorsb | 1.23 | 1.10–1.38 | 1.13 | 1.02–1.24 | ||||||
| Age, social class at other time point, risk factors,b stress | 1.23 | 1.10–1.38 | 1.12 | 1.02–1.23 | ||||||
| Coronary heart disease (ICD-8 and ICD-9: 410–414; ICD-10: I20–I25) | ||||||||||
| Death | Age | 1.56 | 1.31–1.85 | 1.39 | 1.21–1.59 | |||||
| (n=868) | Age, social class at other time | 1.37 | 1.13–1.65 | 1.23 | 1.06–1.42 | |||||
| Age, social class at other time point, risk factorsb | 1.33 | 1.10–1.61 | 1.21 | 1.04–1.41 | ||||||
| Age, social class at other time point, risk factors,b stress | 1.33 | 1.10–1.61 | 1.20 | 1.03–1.41 | ||||||
| Death/hospitalization | Age | 1.50 | 1.31–1.71 | 1.38 | 1.24–1.53 | |||||
| (n=1449) | Age, social class at other time point | 1.30 | 1.13–1.50 | 1.23 | 1.10–1.38 | |||||
| Age, social class at other time point, risk factorsb | 1.28 | 1.10–1.47 | 1.22 | 1.08–1.37 | ||||||
| Age, social class at other time point, risk factors,b stress | 1.28 | 1.10–1.47 | 1.22 | 1.08–1.38 | ||||||
| Stroke (ICD-8 and ICD-9: 430–438; ICD-10: G45, I60–I69) | ||||||||||
| Death | Age | 2.11 | 1.41–3.18 | 1.32 | 0.99–1.76 | |||||
| (n=189) | Age, social class at other time point | 2.05 | 1.32–3.16 | 1.08 | 0.79–1.46 | |||||
| Age, social class at other time point, risk factorsb | 1.90 | 1.23–2.95 | 0.88 | 0.64–1.21 | ||||||
| Age, social class at other time point, risk factors,b stress | 1.88 | 1.22–2.92 | 0.86 | 0.62–1.19 | ||||||
| Death/hospitalization | Age | 1.68 | 1.31–2.15 | 1.41 | 1.17–1.70 | |||||
| (n=444) | Age, social class at other time point | 1.47 | 1.13–1.92 | 1.23 | 1.00–1.51 | |||||
| Age, social class at other time point, risk factorsb | 1.39 | 1.07–1.82 | 1.02 | 0.83–1.27 | ||||||
| Age, social class at other time point, risk factors,b stress | 1.40 | 1.07–1.83 | 1.04 | 0.84–1.29 | ||||||
Analyses are adjusted for combinations of socioeconomic indicators and other risk factors.
Number of cigarettes smoked, whether or not an ex-smoker, units of alcohol in a typical week, physical exercise outside work, diastolic blood pressure, plasma cholesterol, body mass index, forced expiratory volume in 1 s.
Hazard ratios and confidence intervals (CI) for mortality, and for mortality or hospital admission (or cancer registration where appropriate), for men with fathers of manual social class compared to a baseline of men with fathers of non-manual social class, and for men of adulthood manual social class compared to a baseline of men with adulthood non-manual social classa
| Cause and outcome | Controlling for | Father's manual social class | Own manual social class | |||||||
|---|---|---|---|---|---|---|---|---|---|---|
| Hazard ratio | 95% CI | Hazard ratio | 95% CI | |||||||
| Lung cancer (ICD-8 and ICD-9: 162; ICD-10: C33, C34) | ||||||||||
| Death | Age | 1.85 | 1.32–2.60 | 1.96 | 1.52–2.54 | |||||
| (n=255) | Age, social class at other time point | 1.43 | 0.99–2.06 | 1.81 | 1.38–2.39 | |||||
| Age, social class at other time point, risk factorsb | 1.27 | 0.84–1.90 | 1.42 | 1.04–1.94 | ||||||
| Age, social class at other time point, risk factors,b stress | 1.26 | 0.84–1.89 | 1.40 | 1.02–1.92 | ||||||
| Death/hospitalization/ registration (n=325) | Age | 1.70 | 1.27–2.27 | 2.07 | 1.65–2.60 | |||||
| Age, social class at other time point | 1.25 | 0.91–1.72 | 1.97 | 1.54–2.53 | ||||||
| Age, social class at other time point, risk factorsb | 1.18 | 0.82–1.69 | 1.43 | 1.08–1.89 | ||||||
| Age, social class at other time point, risk factors,b stress | 1.18 | 0.82–1.69 | 1.42 | 1.07–1.88 | ||||||
| Gastric and duodenal ulcers (ICD-8 and ICD-9: 531–534; ICD-10: K25–K28) | ||||||||||
| Death/hospitalization | Age | 1.30 | 0.97–1.75 | 1.78 | 1.39–2.29 | |||||
| (n=263) | Age, social class at other time point | 0.88 | 0.63–1.22 | 1.70 | 1.29–2.24 | |||||
| Age, social class at other time point,risk factorsc | 0.84 | 0.60–1.17 | 1.30 | 0.97–1.73 | ||||||
| Age, social class at other time point,risk factors,c stress | 0.84 | 0.60–1.17 | 1.31 | 0.98–1.75 | ||||||
| Asthma (ICD-8 and ICD-9: 493; ICD-10: J45, J46) | ||||||||||
| Death/hospitalization | Age | 0.89 | 0.47–1.70 | 2.10 | 1.15–3.84 | |||||
| (n=47) | Age, social class at other time point | 0.56 | 0.27–1.14 | 2.52 | 1.28–4.97 | |||||
| Age, social class at other time point, risk factorsd | 0.59 | 0.29–1.22 | 1.86 | 0.94–3.69 | ||||||
| Age, social class at other time point, risk factors,d stress | 0.59 | 0.29–1.22 | 1.81 | 0.91–3.61 | ||||||
Analyses are adjusted for combinations of socioeconomic indicators and other risk factors.
Number of cigarettes smoked, whether or not an ex-smoker, age at starting smoking, inhalation when smoking, use of filtered cigarettes, body mass index, forced expiratory volume in 1 s (FEV1).
Number of cigarettes smoked, whether or not an ex-smoker, body mass index, FEV1, units of alcohol in a typical week.
Number of cigarettes smoked, whether or not an ex-smoker, body mass index, FEV1.
Hazard ratios and confidence intervals (CI) for mortality, and for mortality or hospital admission for men with fathers of manual social class compared to a baseline of men with fathers of non-manual social class, and for men of adulthood manual social class compared to a baseline of men with adulthood non-manual social classa
| Cause and outcome | Controlling for | Father's manual social class | Own manual social class | |||||||
|---|---|---|---|---|---|---|---|---|---|---|
| Hazard ratio | 95% CI | Hazard ratio | 95% CI | |||||||
| Accidents and violence (ICD-8 and ICD-9: 800–995; ICD-10: V01–Y89) | ||||||||||
| Death | Age | 1.62 | 0.85–3.11 | 2.34 | 1.38–3.98 | |||||
| (n=63) | Age, social class at other time point | 1.02 | 0.50–2.07 | 2.21 | 1.23–3.98 | |||||
| Age, social class at other time point, risk factorsb | 0.99 | 0.49–2.03 | 1.87 | 1.02–3.41 | ||||||
| Age, social class at other time point, risk factors,b stress | 0.98 | 0.48–2.01 | 1.79 | 0.97–3.28 | ||||||
| Death/hospitalization | Age | 1.27 | 1.10–1.46 | 1.48 | 1.31–1.66 | |||||
| (n=1157) | Age, social class at other time point | 1.04 | 0.89–1.21 | 1.44 | 1.27–1.64 | |||||
| Age, social class at other time point, risk factorsb | 1.02 | 0.87–1.19 | 1.30 | 1.14–1.48 | ||||||
| Age, social class at other time point, risk factors,b stress | 1.02 | 0.88–1.20 | 1.32 | 1.15–1.50 | ||||||
| Alcohol related causes (ICD-8 and ICD-9: 291, 303, 571; ICD-10: F10, K70, K74) | ||||||||||
| Death/hospitalization | Age | 1.56 | 1.01–2.40 | 1.84 | 1.31–2.60 | |||||
| (n=139) | Age, social class at other time point | 1.21 | 0.75–1.95 | 1.71 | 1.17–2.48 | |||||
| Age, social class at other time point, risk factorsb | 1.06 | 0.64–1.75 | 0.91 | 0.62–1.33 | ||||||
| Age, social class at other time point, risk factors,b stress | 1.11 | 0.67–1.83 | 0.96 | 0.65–1.41 | ||||||
| Non-organic psychosis and neurosis (ICD-8: 295–302, 305–307; ICD-9: 295–298, 300–302, 306–309, 311, 312; ICD-10: F20–F69) | ||||||||||
| Hospitalization | Age | 1.07 | 0.75–1.52 | 1.26 | 0.93–1.71 | |||||
| (n=168) | Age, social class at other time point | 0.91 | 0.62–1.34 | 1.26 | 0.90–1.77 | |||||
| Age, social class at other time point, stress | 0.92 | 0.62–1.36 | 1.35 | 0.97–1.90 | ||||||
Analyses are adjusted for combinations of socioeconomic indicators and other risk factors.
Alcohol consumption.
Less-privileged circumstances in both childhood and adulthood were associated with a greater chance of hospital admission in adulthood.
The reason for hospital admission varied according to the age at exposure to less-privileged circumstances.
Daily stress played no role in mediating the associations between socio-economic circumstances and hospital admission.
Health inequalities may best be reduced by programmes aimed at improving the socio-economic circumstances of both children and adults.
We thank Charles Gillis, Victor Hawthorne, David Hole and Pauline MacKinnon, whose work provided the data for this study, and thank David Walsh and David Murphy who gave assistance with the use of the Scottish Morbidity Records data. The UK Economic and Social Research Council Health Variations Programme funded this work.
References
Pamuk ER. Social class inequality in mortality from 1921 to 1972 in England and Wales.
Marmot MG, Davey Smith G, Stansfeld S, et al. Health inequalities among British civil servants: the Whitehall II study.
Townsend P, Davidson N, Whitehead M. Inequalities in health: The Black Report and The Health Divide. Penguin: Harmondsworth,
Shaw M, Dorling D, Gordon D, et al. The widening gap: Health inequalities and policy in Britain. Bristol: The Policy Press,
Blane D, Hart CL, Davey Smith G, et al. Association of cardiovascular disease risk factors with socioeconomic position during childhood and during adulthood.
Lynch JW, Kaplan GA, Cohen RD, et al. Childhood and adult socioeconomic status as predictors of mortality in Finland.
Davey Smith G, Hart C, Blane D, et al. Lifetime socioeconomic position and mortality: prospective observational study.
Davey Smith G, Hart C, Blane D, et al. Adverse socioeconomic conditions in childhood and cause specific adult mortality: prospective observational study.
van de Mheen H, Stronks K, Looman CWN, et al. Does childhood socioeconomic status influence adult health through behavioural factors?
Galobardes B, Lynch JW, Davey Smith G. Childhood socioeconomic circumstances and cause-specific mortality in adulthood: systematic review and interpretation.
Kaplan GA, Salonen JT. Socioeconomic conditions in childhood and ischaemic heart disease during middle age.
Hart CL, Hole DJ, Davey Smith G. Influence of socioeconomic circumstances in early and later life on stroke risk among men in a Scottish cohort study.
Davey Smith G, Neaton JD, Wentworth D, et al. Socioeconomic differentials in mortality risk among men screened for the Multiple Risk Factor Intervention Trial: I. White men.
Lynch JW, Kaplan GA, Cohen RD, et al. Do cardiovascular risk factors explain the relation between socioeconomic status, risk of all-cause mortality, cardiovascular mortality, and acute myocardial infarction?
Stronks K, van de Mheen H, Looman CWN, et al. The importance of psychosocial stressors for socio-economic inequalities in perceived health.
Bowlby J, Salter Ainsworth MD. Child care and the growth of love. 2nd edition. Penguin: Harmondsworth,
Davey Smith G, Hart C, Hole D, et al. Education and occupational social class: which is the more important indicator of mortality risk?
Hart CL, Davey Smith G, Blane D. Social mobility and 21 year mortality in a cohort of Scottish men.
Hart CL, Davey Smith G, Hole DJ, et al. Alcohol consumption and mortality from all causes, coronary heart disease, and stroke: results from a prospective cohort study of Scottish men with 21 years of follow up.
Reeder LG, Chapman JM, Coulson AH. Socioenvironmental stress, tranquilizers and cardiovascular disease.
Metcalfe C, Davey Smith G, Wadsworth E, et al. A contemporary validation of the Reeder Stress Inventory.
Heslop P, Davey Smith G, Carroll D, et al. Perceived stress and coronary heart disease risk factors: The contribution of socio-economic position.
Davey Smith G. Socioeconomic differentials. In: Kuh D, Ben-Shlomo Y, Editors. A life course approach to chronic disease epidemiology. Oxford: Oxford University Press,
Davey Smith G, Gunnell D, Ben-Shlomo Y. Life-course approaches to socio-economic differentials in cause-specific adult mortality. In: Leon D, Walt G, Editors. Poverty, inequality and health: an international perspective. Oxford: Oxford University Press,
Greenwood DC, Muir KR, Packham CJ, et al. Coronary heart disease: a review of the role of psychosocial stress and social support.
Hemingway H, Marmot M. Psychosocial factors in the aetiology and prognosis of coronary heart disease: systematic review of prospective cohort studies.
Truelsen T, Nielsen N, Boysen G, et al. Self-reported stress and risk of stroke. The Copenhagen City Heart Study.
Hamilton M. The personality of dyspeptics with special reference to gastric and duodenal ulcer.
Mendall MA, Goggin PM, Molineaux N, et al. Childhood living conditions and Helicobacter pylori seropositivity in adult life.
Whitaker CJ, Dubiel AJ, Galpin OP. Social and geographic risk factors in Helicobacter pylori infection.
Hart CL, Davey Smith G. The relationship between number of siblings and adult mortality and stroke risk: 25 year follow up of men in the Collaborative study.
Wright RJ, Rodriguez M, Cohen S. Review of psychosocial stress and asthma: An integrated biopsychosocial approach.
Eachus J, Williams M, Chan P, et al. Deprivation and cause specific morbidity: Evidence from the Somerset and Avon survey of health.
Prescott E, Lange P, Vestbo J. Socioeconomic status, lung function and admission to hospital for COPD: Results from the Copenhagen City Heart Study.
Ross S, Godden D, McMurray D, et al. Social effects of wheeze in childhood: A 25 year follow up.
Chen JT, Krieger N, Van Den Eeden SK, et al. Different slopes for different folks. Socioeconomic and racial/ethnic disparities in asthma and hayfever among 173,859 U.S. men and women.
Mäkelä P, Valkonen T, Martelin T. Contribution of deaths related to alcohol use to socioeconomic variation in mortality: register based follow up study.
Marmot M, Shipley M, Brunner E, et al. Relative contribution of early life and adult socioeconomic factors to adult morbidity in the Whitehall II study.
Gilman SE, Kawachi I, Fitzmaurice GM, et al. Socioeconomic status in childhood and the lifetime risk of major depression.
Macleod J, Davey Smith G, Heslop P, et al. Psychological stress and cardiovascular disease: Empirical demonstration of bias in a prospective observational study of Scottish men.

Comments