Article Text

Abstract
Background Lung function is a major criterion used to assess asthma control. Fluctuation analyses can account for lung function history over time, and may provide an additional dimension to characterise control. The relationships between mean and fluctuations in lung function with asthma control, exacerbation and quality of life were studied in two independent data sets.
Methods Data from 132 adults with mild to moderate asthma and 159 adults with severe asthma were analysed separately. Fluctuations in twice-daily peak expiratory flow (PEF) over 6 months were measured by α, representing the strength of correlation with past lung function and potentially asthma stability. α and mean percentage predicted PEF (%predPEF) were plotted with and compared between patients grouped by asthma control defined by recent GINA (Global Initiative for Asthma) guidelines, the Asthma Control Questionnaire score, exacerbations and Asthma Quality of Life Questionnaire score. Associations of α and %predPEF with these outcomes were examined using multiple regression analyses.
Results Both α and %predPEF differed with and were significantly associated with GINA-defined asthma control in both the mild to moderate and severe asthma groups. Only α was related to whether or not exacerbations occurred in mild to moderate asthma, while %predPEF was more significantly related than α in severe asthma. In those with severe asthma, only %predPEF was significantly related to Asthma Control Questionnaire and Asthma Quality of Life Questionnaire scores.
Conclusion Lung function history quantified by fluctuation analysis provides additional information to mean lung function, and may help characterise the current state of asthma control. It may also potentially aid in phenotyping clinical asthma.
- Peak expiratory flow rate
- detrended fluctuation analysis
- patient monitoring
- respiratory physiology
- asthma
- respiratory measurement
Statistics from Altmetric.com
- Peak expiratory flow rate
- detrended fluctuation analysis
- patient monitoring
- respiratory physiology
- asthma
- respiratory measurement
Key messages
What is the key question?
Is fluctuation analysis of past lung function history useful in assessing asthma control?
What is the bottom line?
In two separate populations of subjects with asthma, history of lung function fluctuations was related to asthma control measures and exacerbations, independently of mean lung function.
Why read on?
For the patient, the ability to assess asthma control using home-monitored peak flow fluctuations facilitates self-management of asthma; for the clinician, it suggests lung function fluctuations should be additionally considered in the phenotyping of asthma.
Introduction
Asthma control has most recently been defined as the extent to which the various components comprising asthma—that is, symptoms, variable airway obstruction, airway hyper-responsiveness and inflammation—are improved in the presence of treatment.1 2 Despite the existence of numerous research studies and clinical trials including a number of recent collaborative publications, there are still no definitive guidelines for the assessment of asthma control, which includes an assessment of current state as well as future risk.3 4 This highlights the difficulty of characterising such a heterogenous, multidimensional condition as asthma,5 complicated by the existence of different phenotypes which are themselves not yet fully described. What is clear, however, is that no single parameter is adequate to assess asthma control.3 4
Lung function, as an assessment of variable airway obstruction, is one of the objective measures to assess asthma control. Recent guidelines recognise the need to assess control over periods of weeks rather than just at the moment of assessment,4 6 7 and home monitoring of lung function provides one avenue by which this can be done.4 8 Single points of assessment or mean values are frequently used to quantify lung function, which remove a great deal of information which might be derived from assessing changes over time. In this regard, techniques such as fluctuation analyses may account for changes in lung function history over time.5 9 These techniques have been introduced to determine the presence of certain correlation patterns in twice-daily peak expiratory flow (PEF), which in turn have been shown to vary with short- and long-acting β2-agonist treatment.9 Past lung function history, assessed by such correlation patterns, has already been shown to be useful in the assessment of future risk for exacerbations.10 It may provide an additional dimension to characterise the current state of asthma control.
In this study, we examined the respective changes and associations of mean and history of PEF fluctuations with asthma control. This was assessed using both composite measures and their subcomponents such as exacerbations and quality of life. We investigated these relationships separately in two independent populations from past clinical trials consisting of those with mild to moderate and severe asthma, respectively. We hypothesised that past history of fluctuations in lung function provides additional information to mean lung function for the assessment of asthma control.
Methods
A detailed description of the original data sets and methods can be found in the Online Supplement.
Original data sets
In Study 1, a total of 165 adults with mild to moderate asthma were randomised to receive placebo, salbutamol (400 μg four times a day) or salmeterol (50 μg twice daily) over three 24-week treatment periods, each followed by a 4-week washout in a crossover design.11 For the present analysis, twice-daily PEF data (mini-Wright PEF meter) were taken from all patients during the placebo treatment period of the study. Inhaled corticosteroid use followed a personalised Action Plan, with changes and rescue bronchodilator use when required.
In Study 2, a total of 309 adult patients with severe uncontrolled asthma were randomised to receive monthly subcutaneous injections of placebo or 50, 100 or 200 mg of a trial anti-tumour necrosis factor α asthma treatment over 52 weeks.12 For the present analysis, twice-daily PEF data (Jaeger AM2+, VIASYS Healthcare, Hoechberg, Germany) were taken from all patients, regardless of treatment, during weeks 0–24, where patients maintained the same constant dosage of inhaled and/or oral corticosteroids as during the 2-week run-in period, with changes when required.
Both studies were approved by the relevant ethics committees.
Detrended fluctuation analysis
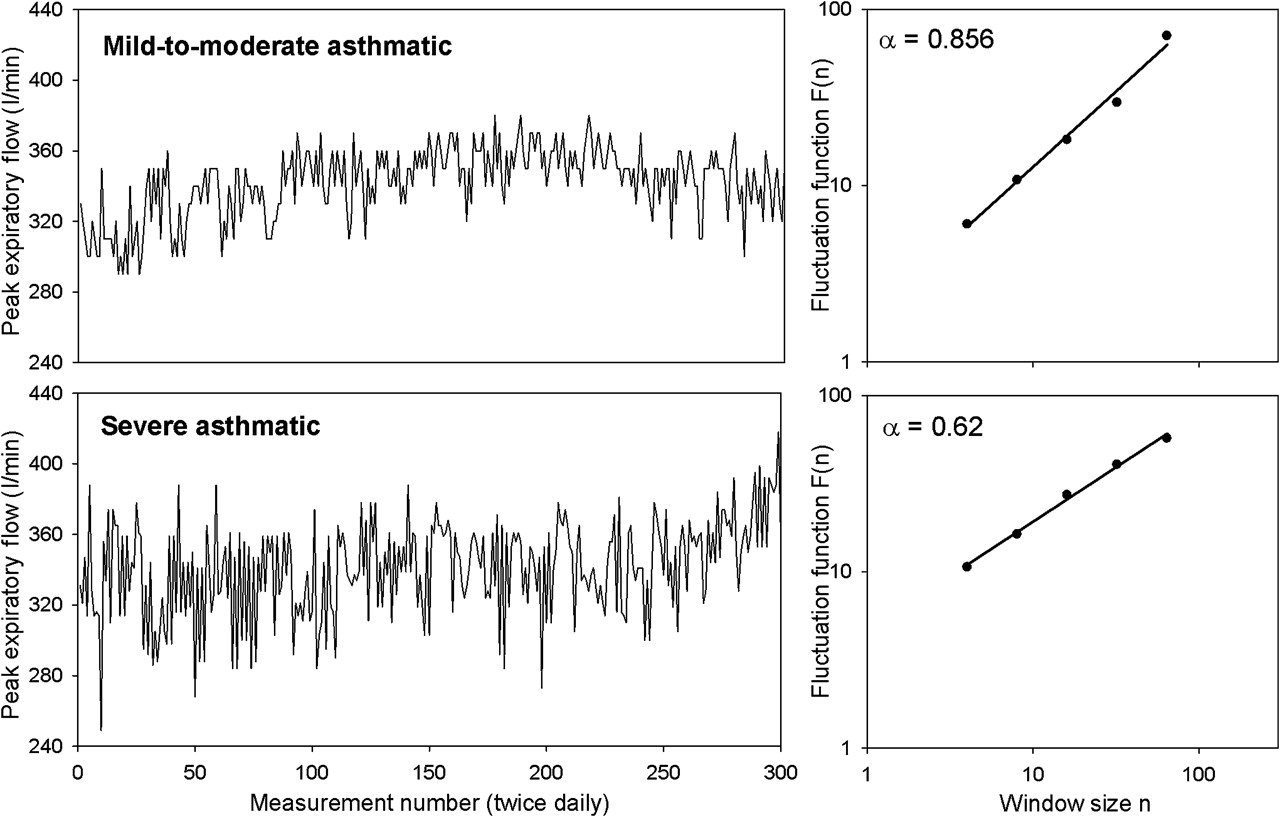
Fluctuation analysis9 13 14 was performed to determine the presence of long-range correlated patterns in PEF data. Data with >10% missing values were excluded for quality control reasons. The analysis end point is the correlation exponent α—that is, the slope of the log–log relationship between fluctuations F(n) 9 13 14 within an observation time window and the size of that time window n (figure 1). While simple measures of variability such as the coefficient of variation quantify the extent to which PEF values change within a period, the exponent α describes the texture of the behaviour of PEF over time—that is, whether random or correlated. Data exhibiting no correlations yield α=0.5, with increasing α indicating that any given point in the data is more closely related to past points (i.e, stronger long-range correlations). Thus, α is thought of variously as a measure of ‘memory’, determinism and possibly clinical control.

Two examples of twice-daily peak expiratory flow (PEF) series in a subject with mild to moderate asthma (top left panel) and a subject with severe asthma (bottom left panel), with the same mean values over time but different correlation properties, quantified by the correlation exponent α calculated using fluctuation analysis. The right panels show the log–log plots of fluctuation function F(n) versus observation window size (n) from which the slope α is obtained. A steeper slope—that is, a higher α—indicates stronger long-range correlations in the PEF data. Note though that the group means for α in those with mild to moderate and severe asthma did not differ significantly.
Composite measures of asthma control
Two outcomes of asthma control were examined: using the GINA (Global Initiative for Asthma) guidelines2 15 and the Asthma Control Questionnaire (ACQ) score.16 GINA scores were calculated weekly, with a week classified as controlled, 0; partly controlled, 1; or uncontrolled, 2. The scores were then averaged over all weeks and reclassified as controlled (≤1), partly controlled (between 1 and 2) and uncontrolled (=2). The ACQ score was assessed as the mean of all available assessments over weeks 4–24, using a score of 0–6 (increasingly poorer control). The ACQ was not available for the group with mild to moderate asthma.
Exacerbations
The same criteria for determining exacerbations (table 1), taken from the more recent study,12 were applied to both data sets over the observation period. Baseline referred to the run-in periods of both studies. For the present analysis, all exacerbations were considered regardless of severity.
Exacerbation criteria applied to both studies for the present analysis
Quality of life
The Asthma Quality of Life Questionnaire (AQLQ) score17 was assessed as the mean over all available assessments over weeks 12–24, using a score of 1–7 (increasingly better quality of life). The AQLQ score was not available for the group with mild to moderate asthma.
Statistical analysis
All relationships were examined separately in the mild to moderate and severe asthma data sets. Changes in α and PEF expressed as a percentage of predicted (%predPEF) in relation to each of the different outcome measures above (GINA, ACQ score, exacerbations and AQLQ score) were first examined. Comparisons between levels of outcomes were made using one-way analysis of variance (ANOVA; on ranks for non-normally distributed data) for outcome measures with three levels adjusting for pairwise comparisons using the Bonferroni method (Dunn method for non-normally distributed data), and t tests for exacerbations (Mann–Whitney rank sum test for non-normally distributed data). GINA score was expressed using the three predefined categories of controlled, partly controlled and uncontrolled, ACQ and AQLQ scores as tertiles, and exacerbations as occurrence or not during the observation period.
Respective associations of α and %predPEF with these outcomes were then examined together in multiple regression analyses. Multinomial logistic regression was used for the GINA, ACQ and AQLQ outcomes, while logistic regression was used for the exacerbation outcome. For each outcome, the ‘best’ category was chosen as baseline for comparisons—that is, ‘controlled’ for GINA, the lowest tertile for the ACQ, no occurrence for exacerbation and the highest tertile for the AQLQ. Results were expressed as RR ratios (for multinomial logistic regression) and ORs (for logistic regression) of falling into a category per 0.1 change in α and per 10% change in %predPEF, compared with the baseline category. In those with severe asthmas, adjustments for the effect of treatment were made by considering treatment group as a categorical variable (placebo or 50, 100, or 200 mg of study drug) and including this in the regression analyses. All statistical analyses were performed using Sigmaplot (version 11, Systat Software) and Intercooled Stata (version 10, Stata Corporation).
Results
Summary of study population and outcomes
One hundred and thirty-two (80%) subjects with mild to moderate asthma and 158 (51%) subjects with severe asthma had sufficient PEF data for analysis, satisfying the quality control criteria. Subject demographics and baseline data can be found in table 2.
Subject demographics and baseline characteristics for the two data sets
Figure 1 shows example PEF data (left panels) from two subjects with asthma from the mild to moderate and the severe groups, respectively, and illustrates the distinction between mean and correlations in PEF. The two PEF series have similar means, but the pattern of PEF variability over time differs, with the severe example showing a greater tendency towards random behaviour. This is deduced from the correlation exponent α, calculated as the slope of the relationship between fluctuations and the observation window size (right panels). Note, however, that we found no differences in α but significant differences in mean PEF and %predPEF between the mild to moderate and severe asthma groups regardless of asthma control, exacerbations or quality of life outcomes. A summary of PEF-derived variables and asthma control outcomes is presented in table 3.
Summary of peak expiratory flow (PEF)-derived variables, asthma control, exacerbations and quality of life indices during the observed period in the two studies
Study 1: mild to moderate asthma
Composite measures of asthma control
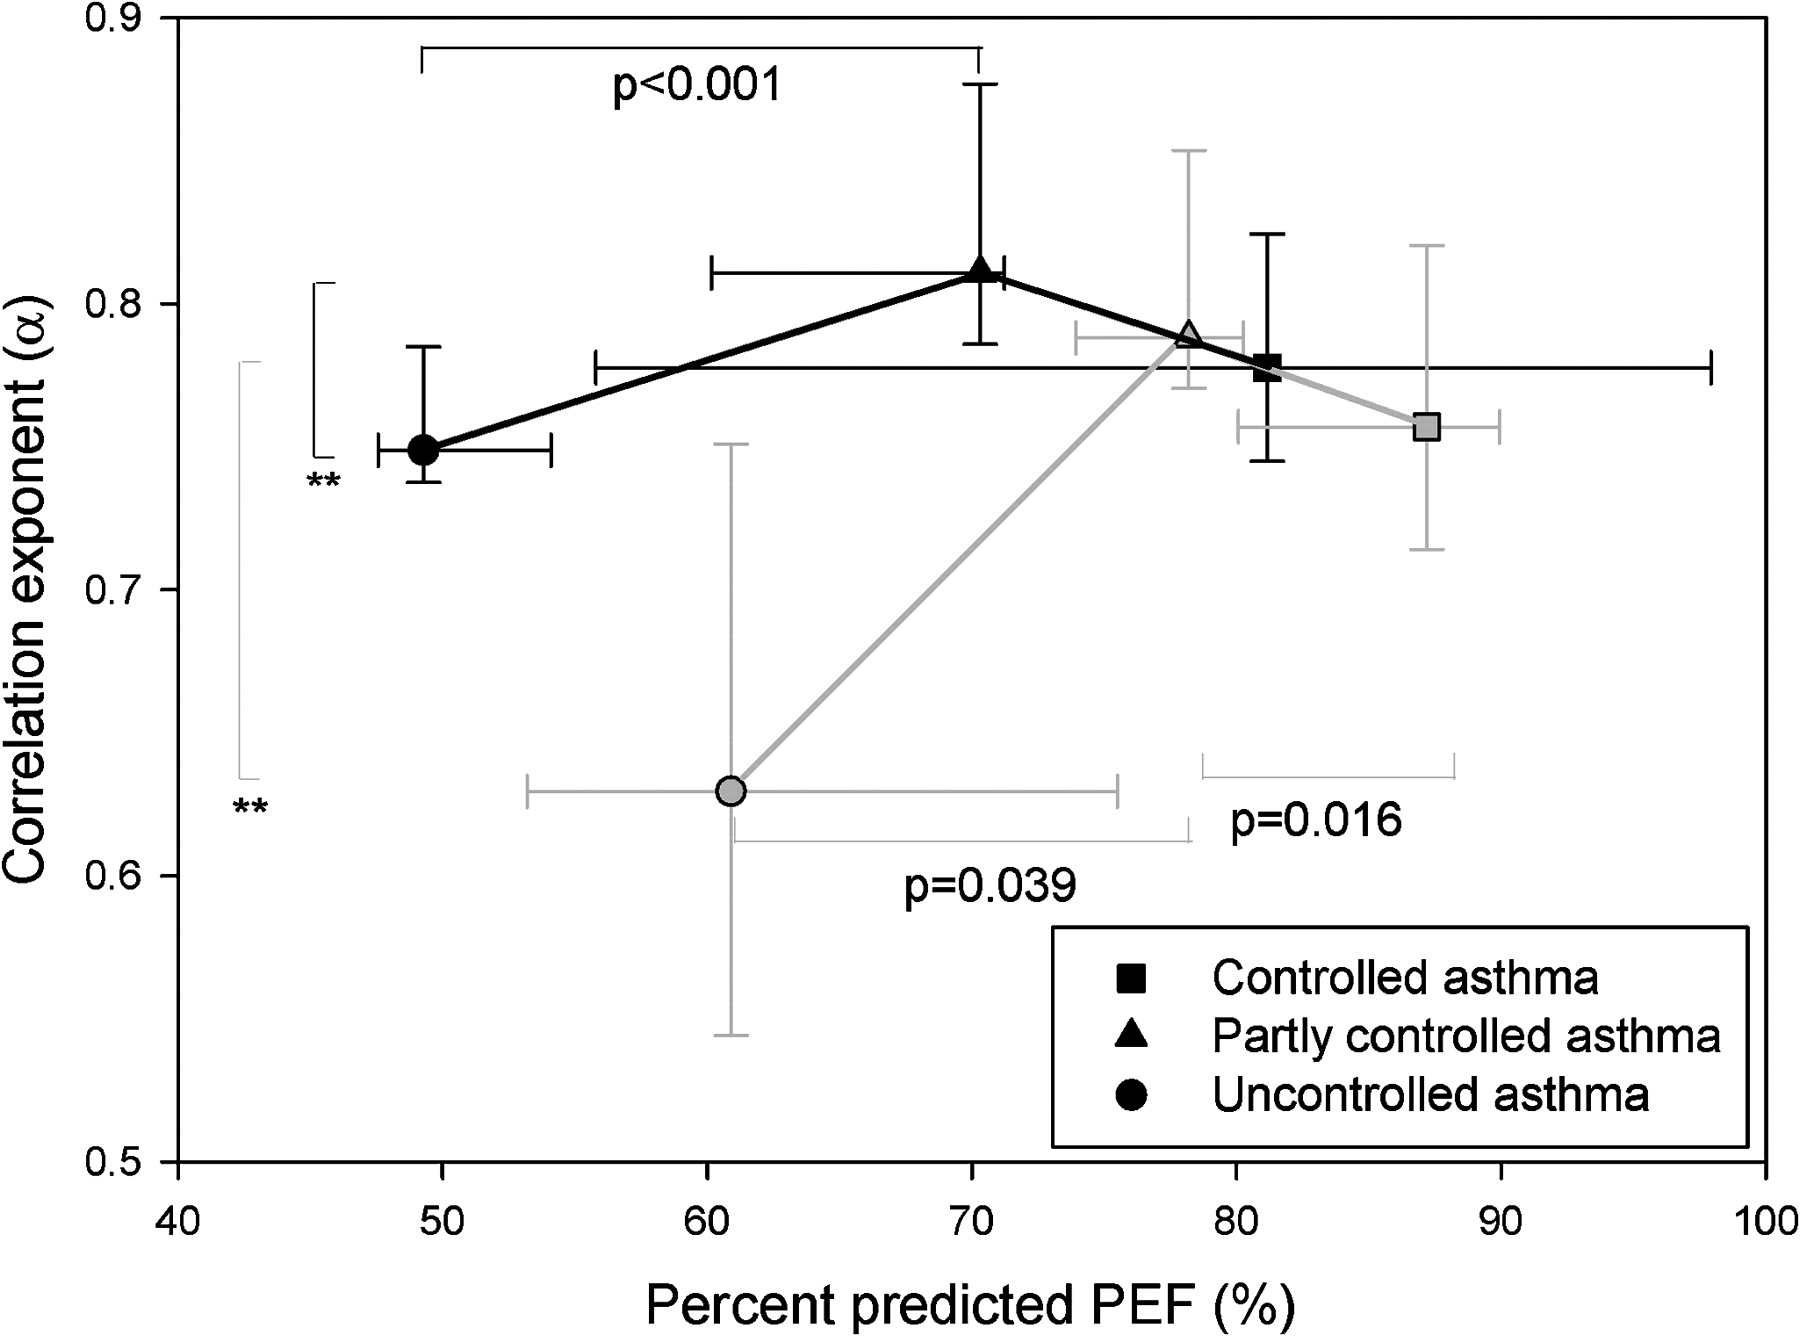
Figure 2 shows α and %predPEF in subjects within the different categories of control assessed by mean GINA scores. α (vertical axis) tended to be lower both in controlled and uncontrolled asthma compared with partly controlled asthma, although this was only significant in the uncontrolled case. In contrast, increasing %predPEF (horizontal axis) corresponded consistently to improved asthma control. Associations of α and %predPEF with asthma control, expressed as RR ratios of falling into one of the GINA categories compared with the controlled category, are shown in table 4 (with the univariable associations for α and %predPEF shown in Table E1 in the Online Supplement). As an example, from table 4, for every 0.1 increase in α, a patient with mild to moderate asthma was 1.27 (95% CI 1.01 to 1.60, p=0.040) times more likely to have partly controlled than controlled asthma. For every 10% increase in %predPEF, the risk was 0.65 (95% CI 0.50 to 0.86, p=0.001) times. In general, both α and %predPEF were significantly associated with GINA-defined asthma control.

Plot of the correlation exponent α and percentage predicted peak expiratory flow (PEF) for the different levels of asthma control, as assessed by the mean score over all weeks within the observation period as per the GINA (Global Initiative for Asthma) guidelines (controlled asthma corresponds to a mean GINA score ≤1, partially controlled asthma to a score between 1 and 2, and uncontrolled asthma to a score of 2). Subjects with mild to moderate asthma are shown as grey symbols and those with severe asthma as black symbols. For consistency, all symbols and error bars denote the median and 95% CIs. p Values correspond to multiple comparison tests (Bonferroni method) following a one-way analysis of variance (ANOVA), while ** indicate significance assessed by multiple comparison tests (Dunn method) following a one-way ANOVA on ranks when data were not normally distributed. For simplicity, only significant comparisons between adjacent levels are displayed.
Associations of the correlation exponent (α) and mean peak expiratory flow (PEF) with asthma control from multiple regression analyses.
Exacerbations
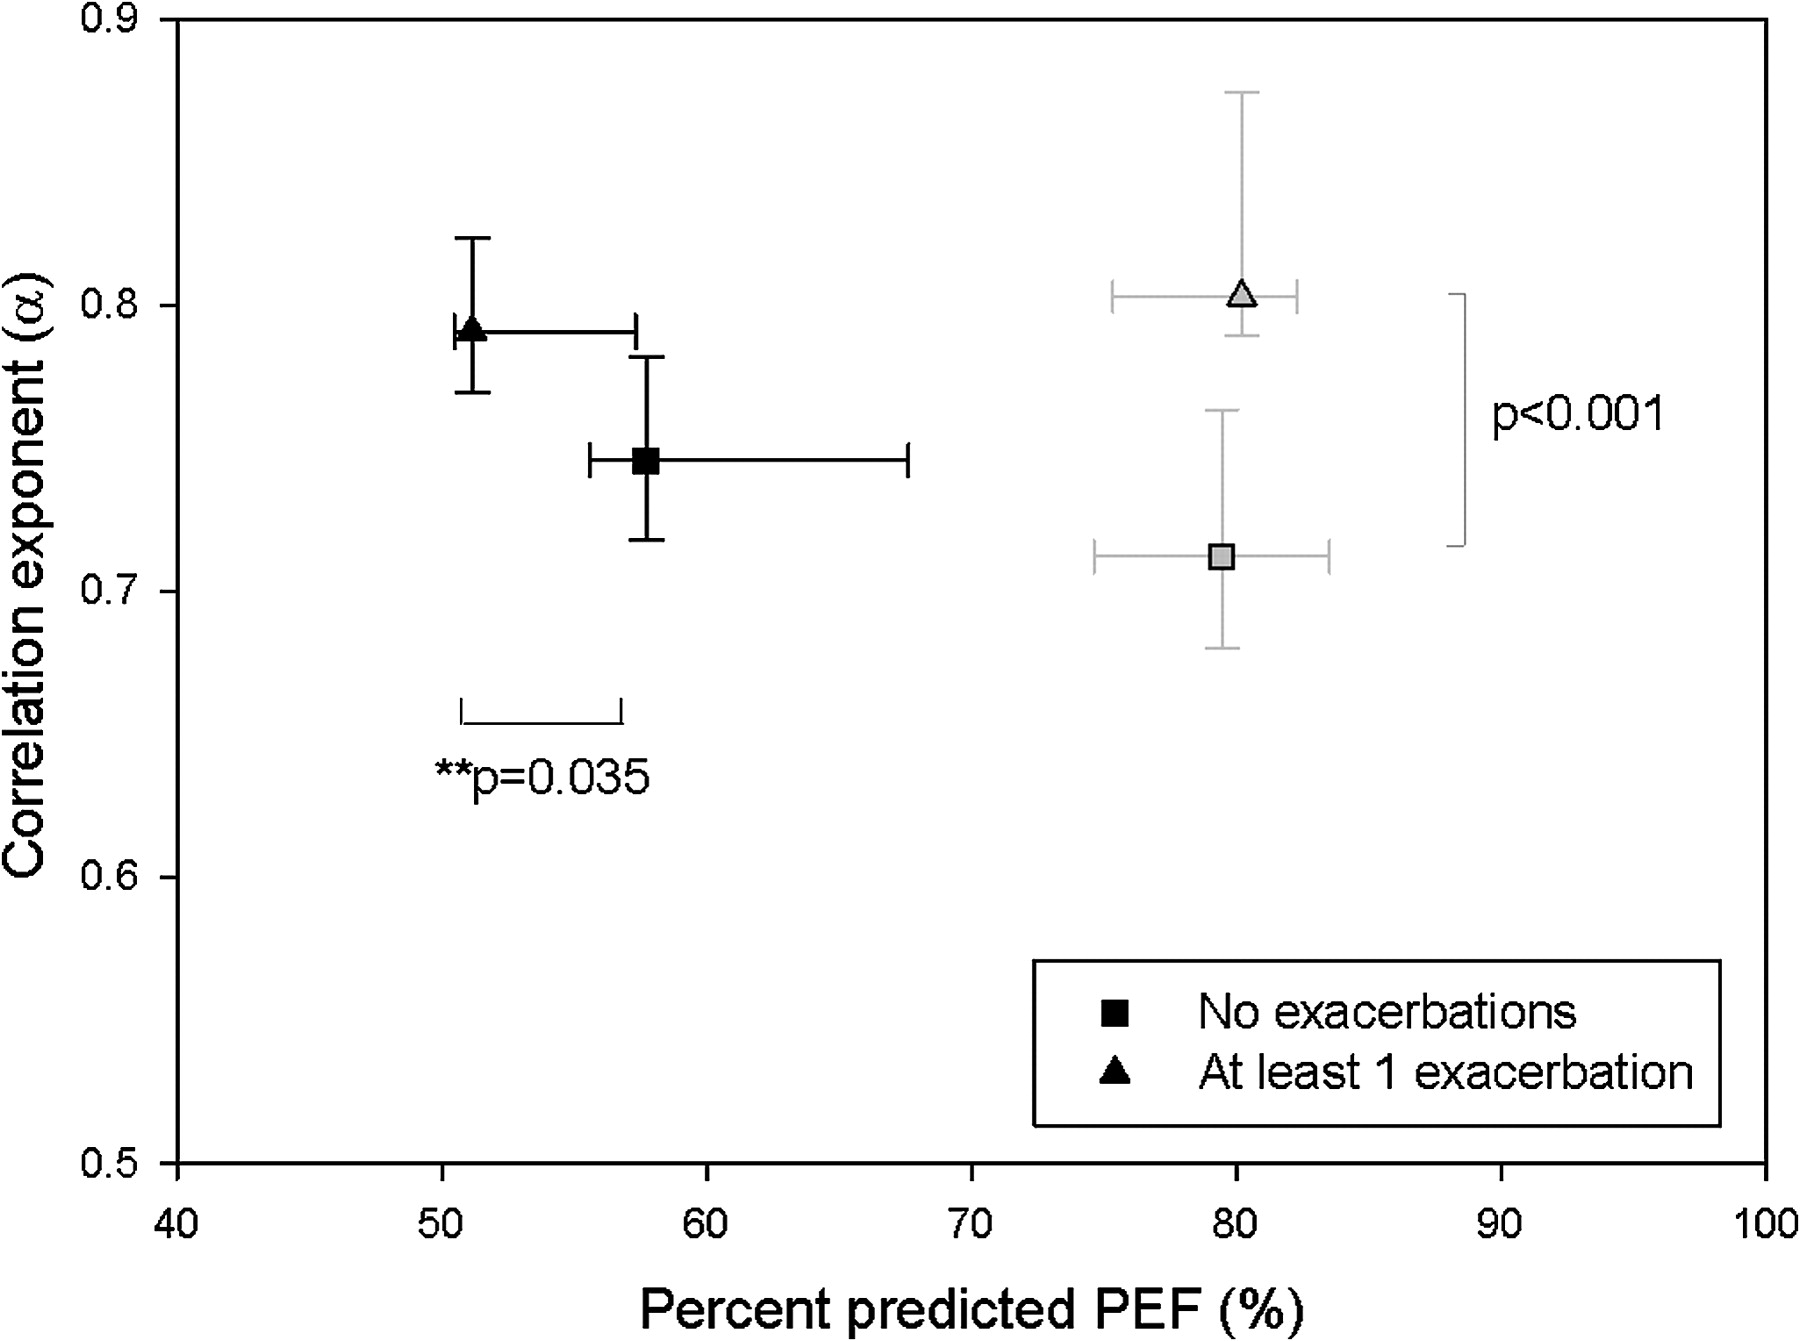
Figure 3 shows α and %predPEF in subjects without versus with at least one exacerbation during the observation period, for both those with mild to moderate and those with severe asthma. α was significantly higher in those patients with mild to moderate asthma who had an exacerbation compared with those who did not, whereas %predPEF was not significantly different. Associations of α and %predPEF with exacerbation were expressed as ORs of having an exacerbation during the observation period, for every 0.1 increase in α or 10% in %predPEF (table 4). Only α was significantly related to exacerbation status in mild to moderate asthma.

Plot of the correlation exponent α and percentage predicted peak expiratory flow (PEF) for patients in whom no exacerbations occurred within the observation period and those in whom at least one exacerbation occurred. Subjects with mild to moderate asthma are shown as grey symbols and those with severe asthma as black symbols, with symbols and error bars denoting median and 95% CIs. p Values correspond to t tests, with ** indicating Mann–Whitney rank sum test for non-normally distributed data.
Study 2: severe asthma
Composite measures of asthma control
For mean GINA scores (figure 2), changes in α with category of control again tended to be lower in controlled and uncontrolled asthma compared with partly controlled asthma, significant only in the uncontrolled case (note though that there were only three patients with severe asthma whose asthma was controlled). Increasing %predPEF again corresponded consistently to improved asthma control. In terms of statistical associations (table 4), again both α and %predPEF were significantly associated with GINA-defined asthma control categories. Note that in those with severe asthma the partly controlled category formed the baseline for comparisons, due to the low numbers in the controlled category.
For ACQ score, there were no significant differences in α between the tertiles, although the relative differences between the low, medium and high tertiles were comparable with those seen with the GINA categories. %predPEF decreased significantly from the low to medium tertile (median (95% CI): 70.3% (65.1% to 75.5%) to 51.0% (46.4% to 55.6%), p<0.001) and from the medium to high tertile (45.6% (41.1% to 50.2%), p=0.009). In terms of associations, %predPEF but not α was significantly associated with ACQ score (table 4).
Exacerbations
In contrast to those with mild to moderate asthma, α was not different between exacerbation status, whereas %predPEF was significantly lower in those who have had an exacerbation (figure 3). In terms of associations, both α and %predPEF together were significantly related to whether or not an exacerbation occurred (table 4).
Quality of life
There were no significant differences in α between AQLQ tertiles. %predPEF increased significantly with improved quality of life from the low to medium tertile (median (95% CI): 45.8% (40.6% to 50.9%) to 51.4% (46.7% to 56.0%), p=0.028) and from the medium to high tertile (65.9% (60.6% to 71.2%), p=0.014). In terms of associations, %predPEF but not α was significantly related to AQLQ (table 4). Similar results were obtained when assessed as change from baseline AQLQ (not shown).
Discussion
Summary of results
In this study, we investigated the changes in and associations of lung function and its history with composite measures as well as subcomponents of asthma control. For GINA-defined asthma control, both α and PEF differed from and were significantly related to control in two independent data sets consisting of patients with mild to moderate (Study 1) and severe asthma (Study 2), respectively. However, for ACQ score, studied only in those with severe asthma, only %predPEF but not α was significantly related to control. For exacerbation status, α but not %predPEF was related to whether or not an exacerbation occurred in mild to moderate asthma, while %predPEF was more significantly related than α in severe asthma. For quality of life, studied only in those with severe asthma, only %predPEF was significantly related to AQLQ scores.
Interpretation
Differences in α distinguished between different levels of asthma control, and this was the case in both the mild to moderate and the severe asthma data sets, suggesting that α is an objective assessor of control regardless of severity. Furthermore, α was found to differ from and relate to asthma control as measured by GINA criteria, but not by the ACQ score in those with severe asthma. Both are weekly composite measures of control and comprise similar criteria (symptoms, activity limitation, nocturnal waking, rescue bronchodilator use, lung function). The shortcoming of the GINA assessment is that it is less well validated than the ACQ, has a lower resolution owing to its categorical classification, and the role of exacerbations in its published definition is still open to interpretation.18 For this study, we used the second definition employed by Thomas and co-workers—that is, patients were classified as having uncontrolled asthma when at least one exacerbation had occurred in the previous 7 days.18 However, the GINA control score was calculated using daily diary data, whereas the ACQ score was based on patient recall over the previous 7 days. This may explain the closer relationship between GINA score and day to day PEF variability.
α was significantly associated with occurrence of exacerbations, particularly in those with mild to moderate asthma. While the association is strong, at present we cannot say for certain whether a higher α necessarily represents better asthma control. However, previous work has suggested the idea of an ‘optimum’ value for α,9 14 below which the fluctuations in lung function are too uncorrelated and unpredictable, and above which they are too rigid and deterministic. This is supported by the results of the present study, in which a non-linear relationship between α and GINA-defined asthma control was seen. Also, we observed that PEF but not α differed significantly between exacerbation status in the subjects with severe asthma. Here, the very low PEF probably dominates the patients' asthma state, such that α plays less of a role. The dual contribution of α and PEF as descriptors of asthma control has previously been hypothesised.5
With regards to quality of life, PEF but not α was found to be a significantly related to the Juniper AQLQ in the subjects with severe asthma. The former finding is consistent with studies where the AQLQ has shown mild but significant relationships to forced expirotary volume in 1 s (FEV1)19–21 and/or PEF.19 22 The lack of association with PEF history may lend support to the idea that single measures of lung function are distinct from dynamic measures of lung function history.
Significance
In two independent data sets of patients with different severity of asthma, the association between α and GINA-defined asthma control and, even more so, with exacerbations was significant even when adjusted for PEF. Thus, the results of this study confirm that the history of PEF variability has a significant role to play in asthma control, independently of and additional to PEF per se, as has been suggested by recent work using fluctuation analysis5 9 14 and discussed in recent guidelines.3 4 A study using factor analysis has also found that PEF variability (assessed by a much simpler measure; ie, difference between morning and evening PEF) represented a factor separate from FEV1 or PEF measurements alone, and was much more related to asthma symptoms.23
While we cannot directly compare the results from the mild to moderate and severe asthma data sets (see Limitations), the perceived differences seen between those with mild to moderate and severe asthma in these associations also suggest a role for fluctuation analysis in phenotyping asthma. Current statistical methods to classify asthma, such as factor analysis, cluster analysis24 or principle component analysis,25 enable us to determine the relative importance of potential factors in the phenotyping of asthma. Here, we show that lung function history as quantified by fluctuation analysis should be an additional candidate for consideration for such classifications. Future prospective studies should include a wide range of patients using common, updated definitions for severity.26
Fluctuation analysis can be implemented wherever day to day home monitoring of PEF is performed. Conversely, it also provides additional value to PEF monitoring, as it makes use of all the data points collected, instead of just single averaged values, and can be updated on a day to day basis. It is a measure which can be obtained independently of clinic visits.
Another potential advantage conferred by use of fluctuation analysis to assess current clinical status in asthma is that it may also be used to predict future risk, which is now recommended as an additional aspect of asthma control assessment.3 4 The presence of correlations of PEF data has recently been shown to facilitate the prediction of later symptoms and exacerbations, particularly in individuals.5 10 14
Limitations
There are several limitations to our study. First, it is difficult to make direct comparisons between the results of the two data sets, due to the fact that they came from different clinical trials with different inclusion criteria and severity definitions. However, we were able to show consistent associations with control and exacerbations regardless of severity. Any differences seen in the associations of α with control between the two groups cannot be attributed to differences in duration of asthma, smoking status or baseline corticosteroid use between the two groups, as α was not related to any of these factors (not shown). Secondly, PEF data from the subjects with mild to moderate asthma were recorded on paper diaries, whereas those from those with severe asthma were electronically collected. Paper diaries are known to have lower adherence and higher susceptibility to data fabrication.8 We attempted to limit the effect of lack of adherence by excluding patients with >10% data missing; however, the possibility of data fabrication, which may alter correlation patterns, cannot be excluded. Thirdly, exacerbation criteria taken from the severe asthma data set had to be retrospectively applied to the mild to moderate data set, to allow comparison between the studies. Thus, some of the measures used had to be interpreted differently in the two studies, for example the use of oral corticosteroids to define severe exacerbations, or the resolution with which symptoms were recorded. For this reason, we also did not examine mild and severe exacerbations more closely, and also chose to examine exacerbations as a binary variable. Note that under the new recommendations,4 the classification of a mild exacerbation is no longer considered justifiable. Finally, other measures of asthma control such as airway hyper-responsiveness and inflammation biomarkers were not examined in this study, though there is recent work now showing the value of daily fluctuations in exhaled nitric oxide in asthma phenotyping.27
Conclusions
In this study, we have shown the additional and independent value of lung function history (α) to lung function per se (PEF) in assessing the current state of asthma control and exacerbations, though not to quality of life which was only related to lung function. These measures are obtainable via home monitoring of PEF, are not subject to patient recall and do not require clinic visits. The use of fluctuation analysis also enables the assessment of individual future risk. These findings suggest that with advances in user-friendly internet-based technology, there is the potential to enhance asthma self-management, particularly in patients with difficult asthma. Furthermore, the differences in the associations observed between those with mild to moderate and those with severe asthma suggest lung function history as an additional criterion to mean lung function for asthma phenotyping.
References
Supplementary materials
Web Only Data thx.2010.156489
Files in this Data Supplement:
Footnotes
See Editorial, p 1019
Funding Respiratory Research Fellowship from Allen & Hanburys/Thoracic Society of Australia and New Zealand to CT.
Competing interests RAW and SF are employed by Johnson & Johnson. Centocor R&D, a fully owned subsidiary of Johnson & Johnson, is the owner of the data set of Study A, whereas Study B was funded by Glaxo Wellcome Research and Development UK. Both RAW and SF assisted with interpretation of the original data sets but did not influence the aims and analyses of this study.
Ethics approval The current manuscript is a retrospective analysis of two past clinical trials. For the first trial, approval was obtained from the Otago and Canterbury ethics committees. For the second trial, approval was obtained from the independent Ethics Committee or Institutional Review Board at each study site.
Provenance and peer review Not commissioned; externally peer reviewed.