Article Text

Abstract
Background Emphysema and small airway disease both contribute to chronic obstructive pulmonary disease (COPD), a disease characterised by accelerated decline in lung function. The association between the extent of emphysema in male current and former smokers and lung function decline was investigated.
Methods Current and former heavy smokers participating in a lung cancer screening trial were recruited to the study and all underwent CT. Spirometry was performed at baseline and at 3-year follow-up. The 15th percentile (Perc15) was used to assess the severity of emphysema.
Results 2085 men of mean age 59.8 years participated in the study. Mean (SD) baseline Perc15 was −934.9 (19.5) HU. A lower Perc15 value correlated with a lower forced expiratory volume in 1 s (FEV1) at baseline (r=0.12, p<0.001). Linear mixed model analysis showed that a lower Perc15 was significantly related to a greater decline in FEV1 after follow-up (p<0.001). Participants without baseline airway obstruction who developed it after follow-up had significantly lower mean (SD) Perc15 values at baseline than those who did not develop obstruction (−934.2 (17.1) HU vs −930.2 (19.7) HU, p<0.001).
Conclusion Greater baseline severity of CT-detected emphysema is related to lower baseline lung function and greater rates of lung function decline, even in those without airway obstruction. CT-detected emphysema aids in identifying non-obstructed male smokers who will develop airflow obstruction.
- CT
- chronic obstructive pulmonary disease
- emphysema
- lung function
- spirometry
- COPD epidemiology
- imaging/CT MRI etc
Statistics from Altmetric.com
- CT
- chronic obstructive pulmonary disease
- emphysema
- lung function
- spirometry
- COPD epidemiology
- imaging/CT MRI etc
Key messages
What is the key question?
Is the extent of CT-detected emphysema in male current and former heavy smokers associated with lung function decline?
What is the bottom line?
CT-detected emphysema is associated with lung function decline and development of airflow obstruction in male current and former heavy smokers.
Why read on?
The results of this study provide new insights into the relationship between smoking-related emphysema and the course of lung function over time in current and former male heavy smokers.
Introduction
Chronic obstructive pulmonary disease (COPD) is a common lung disease that is likely to become the fourth ranking cause of death worldwide by 2020.1 Unfortunately it often remains underdiagnosed, especially in elderly people.2 Tobacco smoking is the main risk factor for developing COPD, but not every smoker will develop the condition.3 Currently, it is hard to predict which persons are susceptible to smoking and will develop COPD. Factors predictive of future pulmonary function decline in subjects who do not yet have airflow obstruction may help to identify COPD patients in the early stages of their disease when treatment and stabilising the disease via smoking cessation are most effective.
COPD is characterised by a mixture of small airway disease (obstructive bronchiolitis) and parenchymal destruction (emphysema), and their relative contributions vary among patients with COPD.4 Signs of emphysema are frequently found on CT scans performed in lung cancer screening trials studying heavy smokers who are also at a great risk of developing COPD, but this CT-detected emphysema is often present without airway obstruction.5 Destruction of alveoli in persons with emphysema results in a lower lung density that can be quantified by lung densitometry, which assesses the relationship between tissue density and its x-ray attenuation on CT.
Whether the presence of low-attenuation areas is a risk factor for a greater decline in lung function has not been established to date. Yuan et al reported a significant relation between lung function decline and overinflation on the CT scan but not with the extent of low-attenuation areas (assessed from percentage lung volume <−950 HU).6 On the other hand, Remy-Jardin et al reported that subjects with visually scored emphysema showed a more rapid decline in pulmonary function than those without emphysema.7 Although the sample sizes of both studies were small (143 and 111 subjects, respectively), these results suggest that signs of emphysema on CT scans may be predictive of future lung function decline.
Since not all (heavy) smokers will develop COPD, factors predictive of lung function decline such as the extent of low-attenuation areas in, for example, individuals without airway obstruction, may help to identify smokers who will develop COPD. This is important since stabilising the disease via smoking cessation is a major component of COPD management.
The purpose of the study was to assess whether the presence/severity of low-attenuation areas at CT scanning as measured at the start of a lung cancer screening trial is associated with additional lung function decline in heavy (non-obstructive) smokers or the development of COPD.
Methods
Participants
The study was conducted among participants of the Dutch-Belgian Lung Cancer Screening Trial (NELSON) from the University Medical Centre Utrecht and the University Medical Centre Groningen, the Netherlands. The NELSON trial included subjects at high risk of developing lung cancer/COPD and is a population-based study.8 9 Detailed information on smoking habits (duration of smoking, number of cigarettes per day) and smoking status (current/former smokers) were collected from questionnaires at baseline. Participants meeting the inclusion criteria of having smoked a minimum of 16 cigarettes/day for 25 years or 11 cigarettes/day for 30 years and fit enough to undergo surgery were invited to participate. Those with moderate or poor self-reported health status or unable to climb two flights of stairs were excluded. Only men were included in the study based on the high risk of developing lung cancer/COPD as fewer women than men in the Dutch population have accumulated a long-term exposure to cigarettes.8 While heavy smokers participating in a lung cancer screening trial are also at high risk of developing COPD, participants in the NELSON trial also underwent spirometry to assess the prevalence and severity of airflow obstruction in the study population.
CT scanning and quantification of emphysema
All participants underwent low-dose CT scanning without intravenous contrast injection at baseline and after 3-year follow-up. At both screening sites, 16-detector MDCT scanners were used (M×8000 IDT or Brilliance 16P, Philips Medical Systems, Cleveland, OH, USA or Sensation-16 Siemens Medical Solutions, Forchheim, Germany). Scan data were obtained in spiral mode with 16×0.75 mm collimation and in full inspiration. No spirometric gating was applied since it has been reported that this does not improve repeatability of lung density measurements.10 11 Axial images were reconstructed with 1.0 mm thickness at 0.7 mm increments. All scans were reconstructed with a soft reconstruction filter (Philips B, Siemens B30f) at a 512×512 matrix. All scans were in spiral mode with 16×0.75 mm collimation and 15 mm table feed per rotation, pitch=1.3. Exposure settings were 30 mAs at 120 kVp or 140 kVp depending on participant's weight, resulting in CTDIvol values of 1.6 mGy and 3.2 mGy. The effective doses were <0.9 mSv and <1.6 mSv, respectively. This low-dose CT protocol was applied in order to reduce the risk of inducing a neoplasm from radiation and has previously been used to quantify emphysema in COPD patients and heavy smokers.12–14
All CT scans were automatically analysed with software developed in-house.15 The software allows for automatic high-precision three-dimensional image analysis by segmentation of the lungs with an algorithm based on region growing and morphological processing.15 Airways were excluded to ensure that only lung parenchyma was analysed.
Air calibration is critical in multicentre lung densitometry studies and incorporation of a correction factor is essential for quantitative image analysis.16 The CT examinations were therefore recalibrated using air in the trachea to ensure comparability between the two centres.
Severity of emphysema was estimated based on the 15th percentile (Perc15) technique. This technique provides the Hounsfield Units (HU) point below which 15% of the voxels are distributed (see figure E1 in online supplement). The lower the Perc15 values (ie, closer to −1000 HU), the more emphysema is present. This method of emphysema quantification has been validated against pathology17 and has been applied in numerous studies.18 A secondary analysis was done using the <−950 HU approach, defined as the proportion of low-density voxels below −950 HU, and the outcome is reported in the online supplement. The Perc15 technique is preferred to the <−950 HU measurement because the Perc15 value is the most robust measurement of emphysema and its progression (see figure E3 in online supplement).19
Spirometry
Spirometry included forced expiratory volume in 1 s (FEV1), forced vital capacity (FVC), FEV1/FVC ratio and maximum expiratory flow at 50% of FVC (MEF50). Bronchodilator response was not assessed. Spirometry was performed on the same day as the screening CT and was repeated after 3 years of follow-up. All participants with an FEV1/FVC ratio <70% at baseline were considered to have airflow obstruction.
Statistical evaluation
Mean and SD values were calculated for normally distributed data and median and IQR for non-normally distributed data. The Student t test and χ2 test were used to detect differences between groups as appropriate. Pearson correlations were used to establish associations between normally distributed variables at baseline.
Previous research has shown that lung function decline is linear over a time span of 3 years.20 FEV1, FEV1/FVC and MEF50 values over time were therefore analysed using random intercept, random slope linear mixed model analysis. The time of observation/intercept was chosen as random parameters; all other parameters were considered to be fixed. The choice of the covariance matrix fell on the unstructured one, based on a comparison of the −2 restricted log likelihood values. The results of the analyses for FEV1/FVC and MEF50 are shown in the online supplement. The baseline low-attenuation area at CT (Perc15) was the main explanatory factor. We adjusted for pack-years smoked, smoking status, centre, height, body mass index and age to obtain corrected lung function parameters. We inserted interactions between Perc15 and absence/presence of airflow obstruction, between Perc15 and smoking status and between Perc15 and pack-years to test whether the association between Perc15 and lung function decline was also dependent on the presence of baseline obstruction or on exposure to tobacco.21 Decline in lung function was calculated by subtracting corrected t=3 years lung function values from baseline values. The secondary analysis using the <−950 HU as the main explanatory factor followed the same approach. The results are shown in the online supplement.
A subanalysis was performed using logistic regression analysis in participants with an FEV1/FVC ratio >70% at baseline to examine the association between Perc15 and the probability of showing airflow obstruction after follow-up; p values <0.05 were considered significant. All statistical analyses were performed using SPSS Version 18 for Windows (SPSS, Chicago, Illinois, USA).
Results
Baseline demographic data
Baseline spirometry and CT scanning data were available for 3084 participants. A random sample of 2254 of these 3084 participants underwent follow-up spirometry. There were no relevant differences in baseline spirometry and Perc15 values between participants with baseline spirometry only and those with follow-up spirometry (see online supplement). Of these 2254 participants, 169 were excluded because the software failed to measure the Perc15 and/or information on covariates was missing.
A total of 2085 participants of mean (SD) age 59.8 (5.3) years and mean pack-years of smoking 40.3 (17.8) were included in the study. The majority of participants had an FEV1/FVC ratio >70% (66.4%). Further participant demographic data are shown in table 1. Median (IQR) follow-up time between the first and last lung function test was 3 years (2.9–3.1).
Demographic data at baseline for the cohort according to obstruction status
Baseline CT-quantified emphysema (Perc15)
Overall mean (SD) baseline Perc15 was −934.9 (19.5) HU. Participants with an FEV1/FVC ratio <70% had a mean (SD) Perc15 of −942.6 (17.6) HU compared with −931.0 (19.2) HU in those with an FEV1/FVC ratio >70% (p<0.001, figure 1). Increasing age was correlated with lower Perc15 values (r=−0.21, p<0.001). Current smokers had higher Perc15 values on average than former smokers (−929.7 (19.5) HU and −941.3 (17.3) HU, respectively, p<0.001). There was no significant correlation between baseline Perc15 and the number of pack-years of smoking (p=0.171). Baseline demographic characteristics stratified by quintiles of baseline Perc15 are shown in table 2.

Histograms of 15th percentile (Perc15) at baseline for participants (A) without and (B) with airflow obstruction. The vertical line indicates the mode in both histograms. Although the participants with chronic obstructive pulmonary disease (COPD: ratio of forced expiratory volume in 1 s to forced vital capacity (FEV1/FVC) <70%) had significantly lower Perc15 scores, a large overlap in baseline Perc15 values was found between participants with and without COPD. HU, Hounsfield Unit.
Participant demographics at baseline stratified by quintiles of baseline 15th percentile (Perc15) values
Baseline lung function
Mean (SD) baseline FEV1 was 3.4 (0.77) l or 98.5 (18.5)% of predicted, and FEV1/FVC was 72.2 (9.4)%. Participants with lower Perc15 values had lower lung function values (FEV1: r=0.12, p<0.001; FEV1/FVC: r=0.39, p<0.001).
Lung function decline
Mean (SD) FEV1 after the follow-up period was 3.21 (0.72) l or 95.4 (18.9)% of predicted, and mean FEV1/FVC was 69.3 (9.4)%. The mean (SD) decline in FEV1 in the total cohort during the follow-up period was 0.19 (0.07) l or 5.9 (2.1)% of predicted.
Lower Perc15 values at baseline were associated with significantly lower FEV1 at follow-up (p<0.001). The effect sizes of Perc15 and of the adjustment factors are shown in table 3 and can be illustrated as follows: when two individuals have an identical baseline FEV1, after 1 year the one with a 10 HU lower baseline Perc15 will have an FEV1 that is 47.5 ml (95% CI 33.0 to 61.0) lower (further details are shown in figure 2). The interaction between Perc15 and the absence/presence of airflow obstruction was not significant (p=0.276), which indicates that the association between Perc15 and decline in FEV1 did not differ between those with and without baseline airflow obstruction. The interaction between Perc15 and smoking status was not significant (p=0.704). The interaction between Perc15 and pack-years smoked was also not significant (p=0.106), indicating that the association between Perc15 and FEV1 decline is independent of the number of pack-years smoked.
Results of linear mixed models analysis for the cohort (change in FEV1 per unit change in covariable)

An example of the forced expiratory volume in 1 s (FEV1) after a 3-year follow-up period in a former and a current smoker. Baseline 15th percentile (Perc15) value is depicted on the x-axis and the FEV1 level at the end of the 3-year follow-up period on the y-axis. The reference is a subject with a starting age of 60 years, a height of 179 cm and 40 pack-years smoking, being the mean values of the cohort. As an illustration: a Perc15 value of −925 HU at baseline is associated with a follow-up FEV1 of 3.23 l in a current smoker while a Perc15 value of −975 HU at baseline is associated with a follow-up FEV1 of 2.91 l, reflecting an additional decline of 0.32 l despite similar age, height and pack-years of smoking in these individuals at baseline. HU, Hounsfield Unit.
The estimated effect of a difference of 10 HU in Perc15 on lung function was comparable to the estimated effect of 10 additional pack-years of smoking. The additional reduction in FEV1 elicited by 10 extra pack-years of smoking was 51.5 ml (95% CI 36.8 to 66.2).
The Perc15 was also significantly associated with a greater reduction in the FEV1/FVC ratio and MEF50 (see online supplement).
Non-obstructive participants who progressed to an FEV1/FVC ratio of <70%
At baseline, 1391 participants had an FEV1/FVC ratio of >70%. Of these 1391 non-obstructive participants, 21.9% (n=305) progressed to an FEV1/FVC ratio of <70% after a mean follow-up of 3 years. This group of participants who had developed airflow obstruction during the study had a mean baseline Perc15 score of −934.2 (17.1) HU, which was significantly lower than the baseline Perc15 of the participants who did not develop airflow obstruction (−930.2 (19.7) HU, p<0.001).
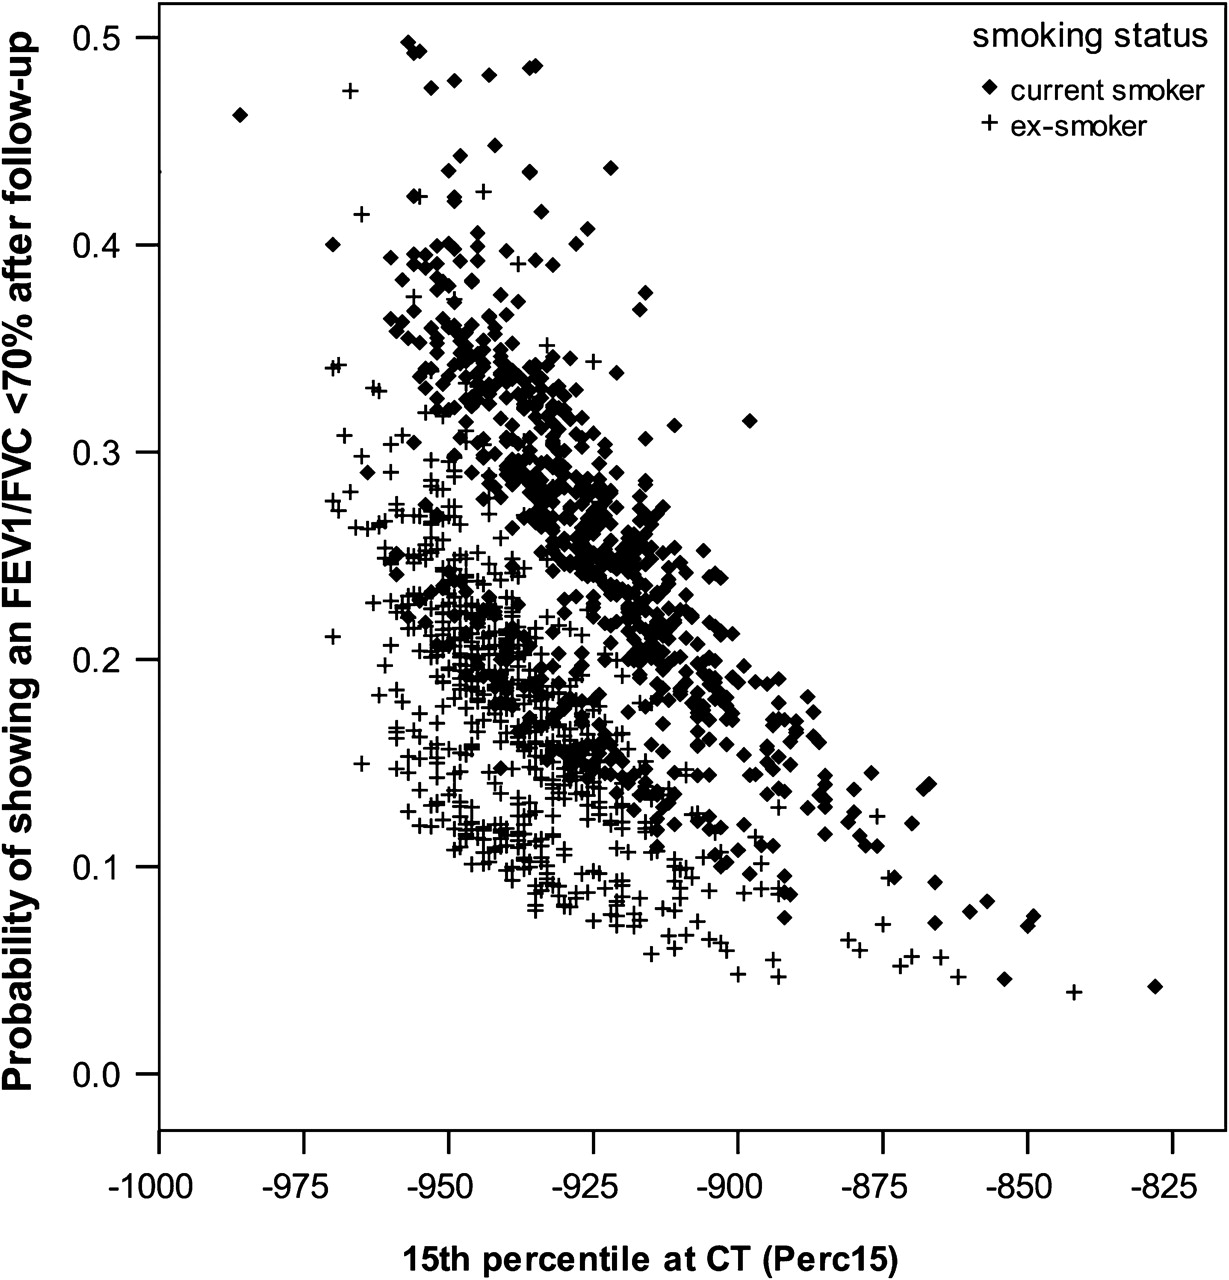
In the multiple logistic regression analysis, a lower Perc15 value at baseline was a significant risk factor for the development of airflow obstruction after follow-up (figure 3). A Perc15 value that was 10 HU lower at baseline (ie, −940 HU instead of −930 HU) resulted in a higher risk of developing airflow obstruction after 3 years of follow-up (OR 1.20, 95% CI 1.10 to 1.30). Other significant predictors were hospital source, age, pack-years and smoking status.

Results of logistic regression analysis showing the probabilities of participants without obstruction (ratio of forced expiratory volume in 1 s to forced vital capacity (FEV1/FVC) >70%) at baseline having airflow obstruction (FEV1/FVC <70%) after follow-up according to baseline 15th percentile (Perc15) values. Participants with a lower Perc15 value had a higher probability of having airflow obstruction at follow-up.
Discussion
We have shown that more extensive baseline low-attenuation areas (expressed in Perc15 values) at CT scanning are associated with a greater reduction in lung function in both non-obstructed and obstructed male heavy smokers. Participants with lower Perc15 values at baseline showed a significantly larger decline in lung function. In addition, we found that Perc15 is an independent risk factor for the development of airflow obstruction during a 3-year period of follow-up. These results may indicate that CT-quantified emphysema represents a form of subclinical COPD which may help to identify non-obstructive male smokers with a high risk of developing airflow obstruction.
To our knowledge, no other studies have assessed low-attenuation areas as a risk factor for developing airflow obstruction. Only a few studies have described the association between low-attenuation areas at CT in participants without airway obstruction and the subsequent course of lung function. We expand the results of Yuan et al who also suggested that quantitative CT measurements of emphysema predict a greater decline of lung function in a comparable but smaller cohort of 143 smokers without airway obstruction.6 In this study, lung function was remeasured after an average of 2.3 years. Overinflated lung areas measured at CT predicted a significantly greater decline in FEV1. However, the associations of low-attenuation areas were not significant, but they were in the similar direction to those in our study. One explanation for the lack of significance could be the smaller sample size. Another longitudinal study visually estimated the extent of emphysema on CT scans and related it to lung function in a cohort of 111 smoking and non-smoking volunteers. The authors reported a more rapid decline in lung function in participants with emphysema than in those without emphysema.7
Our data are in line with the concept that loss of elastic recoil due to emphysema contributes to airway collapse.22 The question remains why emphysema does not elicit airway obstruction in every individual. This may be explained by several factors. First, airflow limitation may only become apparent when the severity of emphysema exceeds a certain threshold. Second, lung function must decline below a certain threshold before it is labelled as ‘obstructive’. It is evident that individuals with emphysema may have decline in lung function but with FEV1 and FEV1/FVC levels still within the normal range. Further progression of disease may then give test results below the GOLD criteria for COPD. This is exemplified by findings in our study in participants without airway obstruction at baseline who developed airway obstruction at follow-up. This group had a significantly lower Perc15 on the CT scan than the group that did not develop obstruction. Third, our analysis of the CT scans focused only on the extent of low-attenuation areas and not, for example, on airway wall thickening. Several cross-sectional studies have reported that lower lung function values are associated with CT parameters such as greater airway wall thickening, more air trapping and lung hyperinflation.22–24 Hyperinflation and ground glass attenuation have also been reported to be related to a more rapid rate of lung function decline.6 21 A composite of CT-derived parameters may therefore offer better lung function associations than measurements of low-attenuation areas alone, but such a composite parameter is not yet available. Finally, FEV1 is governed by a complicated dynamic process during full and forceful expiration but we measured the extent of low-attenuation areas during a static full inspiration. Adding measurements performed on the expiratory CT scan has been shown to improve cross-sectional correlations with lung function.25 This is because low-attenuated areas on expiration scans also reflect air trapping, which can be the result of emphysema or other pathology that causes airflow obstruction (eg, obstructive bronchiolitis).25
All the above effects may reduce the strength of the correlation between CT-quantified emphysema and lung function results. We have shown that the extent of low-attenuation areas is a parameter that, in addition to pack-years of smoking, has a deleterious effect on lung function.
Interestingly, we found more low-attenuation areas in participants who had quit smoking compared with current smokers. This was also found in a previous study evaluating subjects with COPD and controls.26 A possible explanation is that more chronic inflammation with increased mucus production is present in current smokers. The presence of inflammation may lead to higher densities measured in the lung parenchyma resulting in higher Perc15 scores. In ex-smokers this chronic inflammation will diminish over time resulting in lower overall lung densities. Another possible explanation is the ‘healthy smoker effect’—that is, those with more advanced disease are more likely to reduce or quit smoking and those without symptoms are more likely to continue smoking.
One of the strengths of this study is the large number of participants included and the fact that all were selected from the general population and not after hospital referral. This enabled us to study the role of low-attenuation areas in the development of airflow obstruction in participants who do not yet show signs of obstruction. Participants were current or former heavy smokers and thus had a high risk of developing airflow obstruction, as shown by the low mean FEV1/FVC of 72.2% at baseline. The mean rate of lung function decline during follow-up was also much higher than reference values for a general population of the same age, which may be largely due to the relatively high number of pack-years smoked by the cohort.27 The mean yearly decline in FEV1 in our cohort was 65 ml compared with reference values of 29 ml/year.
We have carefully measured lung function. The data reported here are based on lung function values obtained according to ATS/ERS guidelines and the spirometry equipment used in both centres is interchangeable.28 The extent of low-attenuation areas in the two centres was estimated by the same software package to avoid software bias, and each CT scan was recalibrated on air to avoid scanner bias. Nonetheless, a hospital factor was inserted in the statistical analysis to remove any residual bias, but this proved to be non-significant as well as all interactions containing the centre factor. Our study was limited by the fact that spirometry was performed without prior bronchodilation, and this could have led to an overestimation of the prevalence of airflow obstruction in our cohort. However, this is not likely to affect the decline in lung function over time as all baseline and follow-up tests were performed without bronchodilation. Another limitation was that, owing to the inclusion criteria, only men participated in the study. Previous studies showed that women have less emphysema26 and future studies should include women to examine whether emphysema is associated with lung function decline. We were unable to report the number of participants for whom follow-up spirometry was missing due to death. Importantly, there were no relevant differences in spirometry and Perc15 values between participants with baseline spirometry only and those also with follow-up spirometry. Furthermore, it should be borne in mind that the study population included only heavy (former) smokers with a high exposure to tobacco smoking. On the other hand, this is the group of subjects most at risk of lung function decline and development of airflow obstruction.
In conclusion, the results of this study provide new insights into the relationship between smoking-related emphysema (ie, low-attenuation areas on the CT scan) and the course of lung function over time in current and former male heavy smokers. Our results show that a greater extent of low-attenuation areas at baseline is related to a greater decline in lung function. Most of the study participants had either no or only mild to moderate airflow obstruction. This suggests that CT-detected emphysema can identify early manifestations of airflow obstruction in patients with still normal lung function. The quantification of low-attenuation areas may thus help to identify subjects without airway obstruction who are at risk of developing airflow obstruction.
References
Supplementary materials
Web Only Data thx.2010.145995
Files in this Data Supplement:
Web Only Data thx.2010.145995
Files in this Data Supplement:
Footnotes
See Editorial, p 741
FAAMH and BdH contributed equally to this study.
Linked articles 161430.
Competing interests HJMG received funds for research from Eli Lilly and Roche. DSP received funding for research from AstraZeneca, GSK, Nycomed. Travel to ERS or ATS has been partially funded by AstraZeneca, GSK, Chiesi, Nycomed. DSP has been consultant to AstraZeneca, Boehringer Ingelheim, Chiesi, GSK, Nycomed and TEVA.
Ethics approval This study was conducted with the approval of the Dutch Ministry of Health and by the ethics committee of the two participating hospitals (University Medical Center Utrecht and University Medical Center Groningen).
Provenance and peer review Not commissioned; externally peer reviewed.