Article Text

Abstract
Background: Analysis of exhaled breath, especially of volatile organic compounds (VOCs), is of increasing interest in the diagnosis of lung cancer. Compared with other methods of breath analysis, ion mobility spectrometry (IMS) offers a tenfold higher detection rate of VOCs. By coupling the ion mobility spectrometer with a multicapillary column as a pre-separation unit, IMS offers the advantage of an immediate twofold separation of VOCs with visualisation in a three-dimensional chromatogram. The total analysis time is about 500 s compared with gas chromatography/mass spectrometry (GC/MS) of about 1 h. It therefore seemed reasonable to test IMS in breath analysis.
Methods: In a pilot study, 32 patients with lung cancer were subjected to a breath analysis by IMS. Their IMS chromatograms were compared with those of 54 healthy controls. An IMS that was built for special clinical application was used to identify characteristic peaks of VOCs which might be relevant for the diagnosis of lung cancer in exhaled air of 10 ml volume.
Results: By a combination of 23 peak regions within the IMS chromatogram, patients with lung cancer, including a patient with carcinoma in situ, were classified and differentiated from healthy persons with an error rate of zero.
Conclusion: Breath analysis by IMS can detect a discriminating combination of VOCs in patients with lung cancer. By pattern recognition without the need for chemical analysis of the underlying VOCs, IMS has the potential to facilitate lung cancer diagnosis.
Statistics from Altmetric.com
It would be desirable to be able to diagnose pulmonary disorders and assess their activity by analysis of breath. A number of different methods such as exhaled breath condensate,1 the electric nose2 3 4 and the measurement of volatile organic compounds (VOCs) by gas chromatography/mass spectrometry (GC/MS) have been studied,5 6 7 8 9 especially in chronic obstructive pulmonary disease (COPD), asthma, lung cancer and interstitial lung disease, but the ideal method has not yet been found.
The success of any method depends on the recognition of discriminating substances that can be used as biomarkers. This, however, needs an overview of the composition of VOCs in the exhaled breath, which then permits the selection of discriminating compounds. Horvath et al,1 who summarised the general requirements for breath analysis in the recommendations of the American Thoracic Society/European Respiratory Society (ATS/ERS), concluded that the ideal test should produce a “breathogram”. This breathogram can be obtained by ion mobility spectrometry (IMS).10 11 12 13 14 15 16 In contrast to other analytical methods, IMS enables the detection and separation of all VOCs in exhaled breath and their visualisation in a three-dimensional so-called IMS chromatogram. The diagnostic approach to breath analysis with IMS is based on the measurement of a disease-specific combination of VOC peaks, allowing diagnosis by pattern recognition without the need for chemical identification of the underlying VOCs. These methodological advantages raise the question of whether IMS is superior to other methods of breath analysis such as GC/MS analysis of VOCs5 6 7 8 9 or the electronic nose.2 3 4
IMS is based on the ionisation of gaseous metabolites which are separated by short impulses (about 10–100 μs) in drift tubes with lengths of only a few centimetres at ambient pressure (fig 1). The very small electric current (nA to pA) generated at a Faraday plate forms the spectrum of the running time of the ions. The combination of IMS with gas chromatographic columns guarantees the pre-separation of gaseous metabolites before entering the drift tube.

Working principle of an ion mobility spectrometer. Left: ionisation and reaction region to form ions of the analytes. Right: drift chamber to separate the ions formed. The gas inlet is the entrance point of the carrier gas air with all molecules including the metabolites; the drift gas is a pure gas flowing towards the ions drifting to avoid entrance of non-ion at the ion shutter; the gas outlet is the outlet of the carrier and the drift gas; the aperture grid protects the Faraday plate; the drift rings stabilise the electric field within the drift region.
Unfortunately, IMS does not identify unknown compounds in a gas. However, the main advantages of IMS are its ability to detect very low concentrations of compounds (ng/l to pg/l, ppmv to pptv range) without any pre-concentration and the short time for analysis: a spectrum takes less than 50 ms, a complete breath analysis less than 500 s.
Because of the relative simplicity of the technique, and encouraged by our first results in the detection of airway infections17 and sarcoidosis,18 19 IMS was used in this feasibility and pilot study to evaluate its potential for the non-invasive diagnosis of lung cancer.
Methods
From 1 July 2004 to 30 November 2004, breath analysis with IMS was performed in healthy employees of the Institute for Analytical Sciences (ISAS) and in voluntary patients of the Hemer Lung Hospital with a cytological or histological diagnosis of lung cancer. In this pilot study, which was designed to generate preliminary data and a training set of VOC profiles, no distinctions regarding, for example, smoking history or COPD were made. Furthermore, patients with lung cancer were not differentiated by stage or histological type of tumour.
Ion mobility spectrometer
For breath analysis, an ion mobility spectrometer developed by the ISAS was used (fig 2). In this spectrometer a 550 MBq 63Ni β-radiation source was applied for the ionisation of the carrier gas (air). It was connected to a polar multicapillary column (MCC, type OV-5, Sibertech Ltd, Novosibirsk, Russia) used as the pre-separation unit. In this MCC the analytes of exhaled breath were sent through 1000 parallel capillaries, each with an inner diameter of 40 μm and a film thickness of 200 nm. The total diameter of the separation column was 3 mm. The relevant MCC parameters are listed in table 1.

Ion mobility spectrometer at the Hemer Lung Clinic including the mouthpiece, the multicapillary column/ion mobility spectrometer (MCC/IMS), the temperature control unit for the MCC and the bottles with synthetic air.
Characteristics of ion mobility spectrometer (IMS)
Sampling gas collection
The study subjects were asked to exhale through a mouthpiece connected to a Teflon bulb and the exhaled breath was passed through an unheated sampling loop. A miniaturised suction pump (type G6/02-850163, ASF Thomas, Wülfrath, suction rate 350 ml/min) was connected to the outlet of the loop to obtain a homogeneous breath sample flow. At the end of exhalation, thus providing a mainly alveolar sample, an electric six-way valve was switched and 10 ml of gas in the sample loop was directed to the MCC for chromatographic separation of breath compounds. After passing through the MCC, the pre-separated analytes entered the ionisation chamber of the IMS (fig 3). In this chamber the carrier gas molecules were ionised by the 63Ni β-radiation source and fast ion-molecule reactions, forming ionised molecules of the analytes by different types of collisions including charge transfer reactions. A further separation of the ions formed took place in the electrical field within the drift tube.

Sampling starting with carrier gas inlet (1, from the mouthpiece) using a six-port valve (2) to introduce 10 ml of breath into the multicapillary column (MCC, 3) for pre-separation, followed by entrance of pre-separated breath compounds into the ionisation region of the ion mobility spectrometer (IMS, 4) and outlet (5).
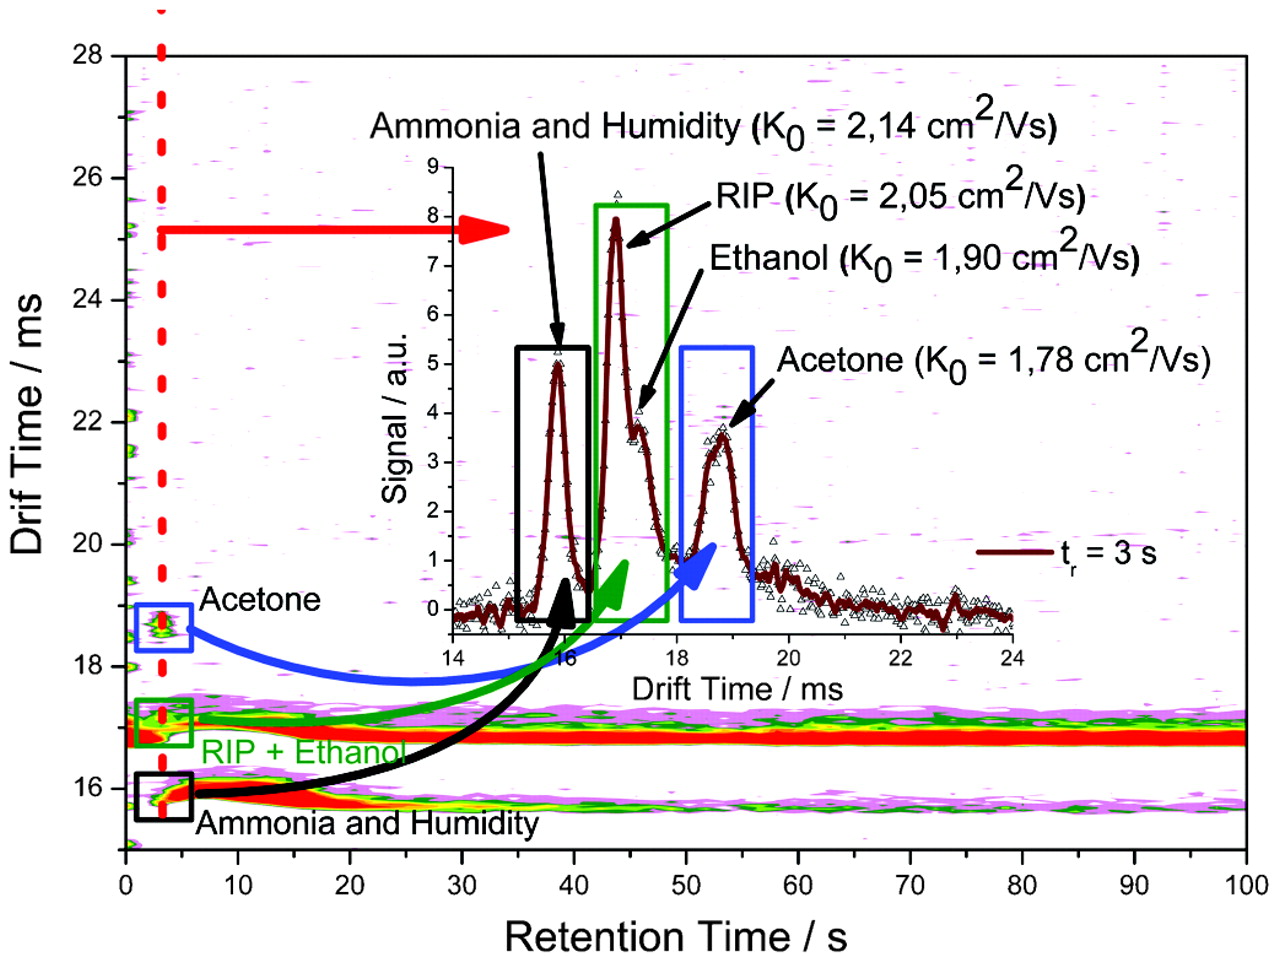
The ionised analytes were detected on a Faraday plate at the end of the drift region. For the determination of blind values (ie, environmental VOCs), samples of room air were analysed before analysing exhaled breath to check for interfering measurement characteristics. Further data interpretation was based on the difference between the chromatograms. Figure 4 shows a typical IMS chromatogram and a single spectrum of exhaled breath from a healthy person.

Typical ion mobility spectrometry (IMS) chromatogram as heat map. Inset: single spectrum on the retention time of 3 s (dashed line in the heat map). The signals related to acetone (blue quadrangle), the reactant ion peak (RIP) and ethanol (green quadrangle), humidity and ammonia (black quadrangle) are marked on the heat map and the corresponding single spectrum; the individual mobilities are also shown.
Analysis of IMS chromatograms
The raw IMS data were first treated by a baseline correction so that intensity values varied around zero in areas of pure noise. The time axes were then transformed to adjust for different instrument and environmental factors such as length of the drift tube or ambient pressure, after which the single measurements were subjected to a peak localisation procedure.
The set of peak positions found in the whole sample of measurements was then analysed together in a cluster procedure. The resulting clusters were the basis for a definition of typical peak areas (fig 5) of the analysed data set. New peak variables derived from these peak areas were defined as the mean intensity in the areas, which was calculated by going back to the original single measurements (see detailed description by Bader et al23). In this way, different numbers of variables were tested for their ability to form a differentiating cluster step by step. For each set of variables a possible validation set was built. Smoking history, tumour cell type and stage of cancer were not influential in the development of the model.

Differential expressed variable areas (typical peak areas).
Statistical methods
The data were processed by different statistical methods. All steps of the analysis were performed with the software package R.20 First, the LOWESS method was used to apply a baseline correction to the data as it offers the desired amount of robustness. For peak localisation, a merging regions algorithm was used to distinguish between different peak areas.21 For the clustering of peak positions, the results of Ward’s method were used as starting values for the k means method to obtain a stable but well-adjusted clustering.
Before the final application of linear discriminant analysis for separation of the two groups of patients with lung cancer and controls, a multiple t test procedure was used to identify differentially expressed variables and thus reduce the complexity of the discrimination task.22 23
To evaluate the classification results, the error rate was estimated by “leave one out” cross-validation. A single observation from the original sample was used as the validation data, while the remaining observations served as training data for development of the model. The “leave one out” procedure incorporated multiple testing as well as discriminant analysis. The resulting set of variables included in the model remained stable while the coefficients of the discriminant rule were, of course, slightly changed. The established rule was then used to check the correctness of the resulting classification. The number of wrong assignments gives a reliable estimation of the actual error rate.23 By executing a stepwise selection based on the standardised discriminant coefficients and the estimated error rate, the model was further optimised.
Results
A total of 32 patients (24 men, 8 women) with histologically proven lung cancer were studied before the initiation of treatment. Their mean (SD) age was 65.1 (9.6) years, body weight 74.9 (13.7) kg and height 169.4 (8.3) cm. Seven patients had small cell lung carcinoma (SCLC), 24 patients had non-small cell lung carcinoma (NSCLC) including 1 patient with carcinoma in situ, 1 patient had a mixed tumour with NSCLC and SCLC and 5 patients had undifferentiated carcinoma. The tumour stage ranged from Tis to T4N3M1 (stage 0: 1 patient, stage 2: 3 patients, stage 3: 9 patients, stage 4: 17 patients). Seventeen patients were ex-smokers, 6 patients had never smoked and 7 patients were current smokers. Fifty-four healthy persons without cancer (39 men and 15 women; 12 smokers and 42 non-smokers) served as controls. Their mean (SD) age was 46 (12) years, body weight 81 (16) kg, height 181 (9) cm.
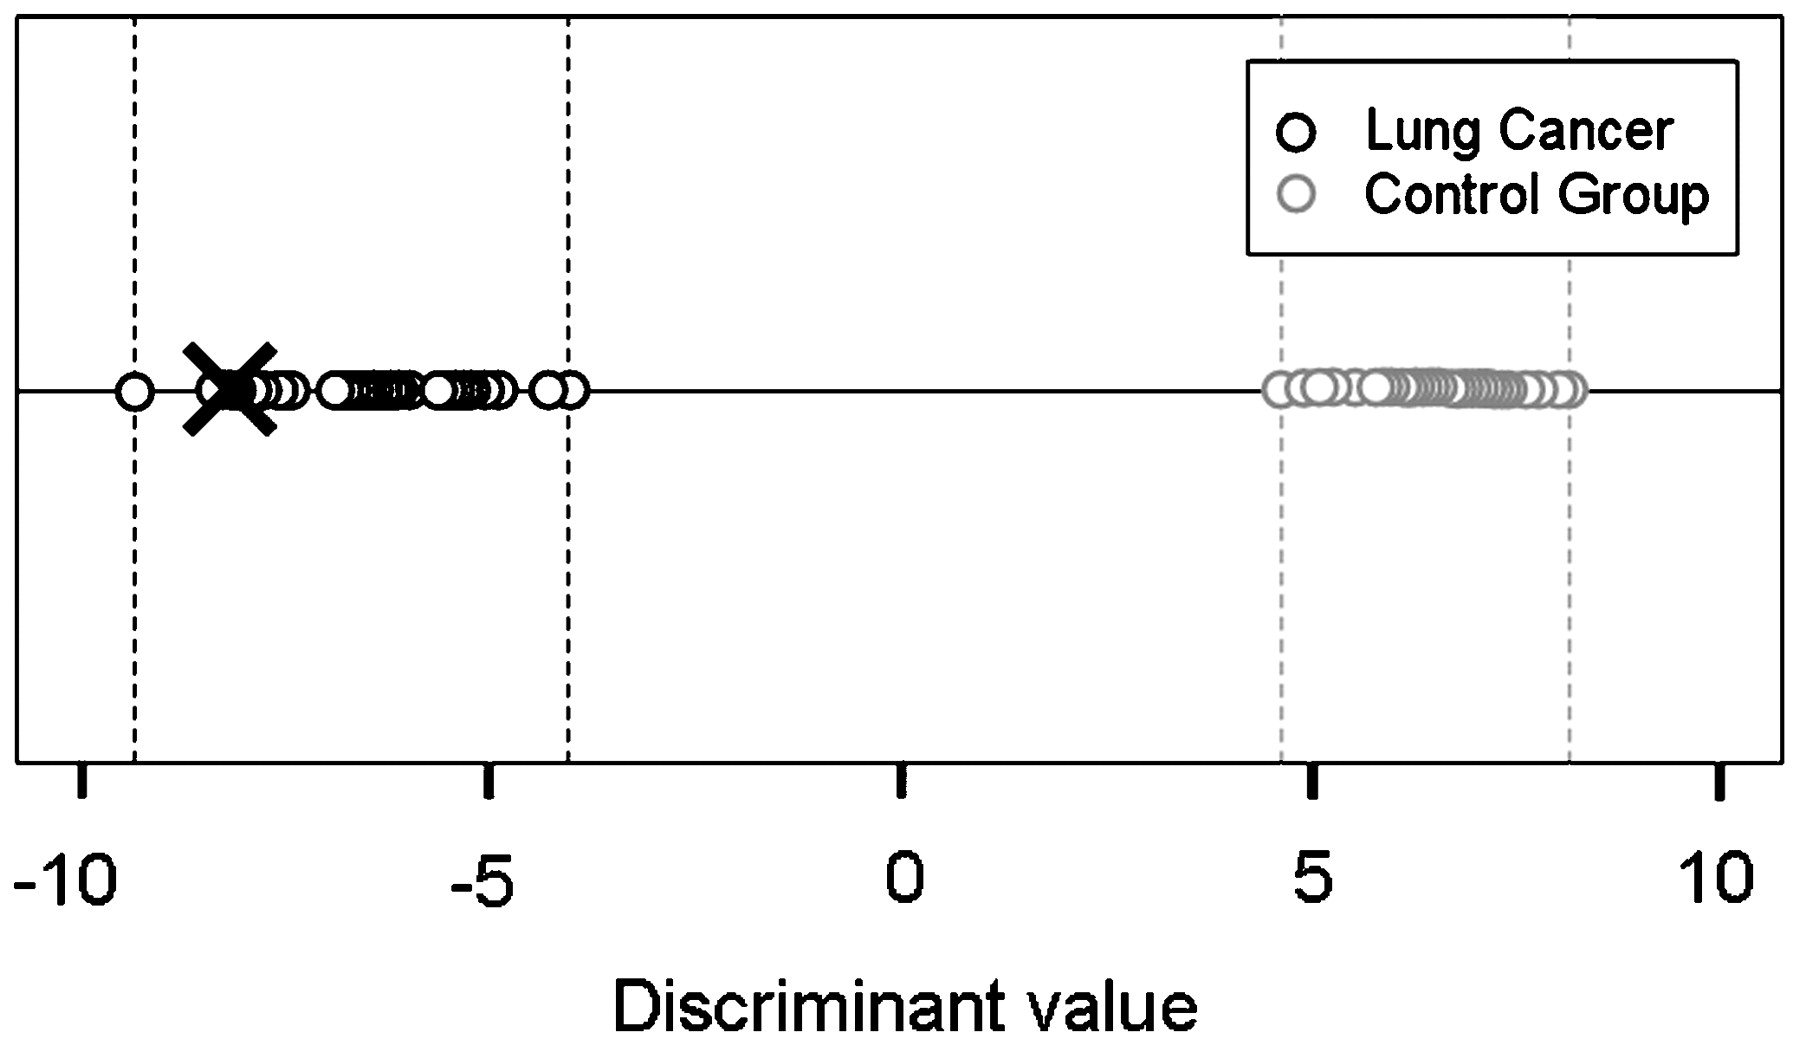
By applying the peak pattern analysis as described above, a set of 23 variables was differentially expressed between the classes to a multiple test level of 0.001%. Based on these variables, a linear discriminant analysis was conducted. By applying the “leave one out” method to the 32 patients and 54 healthy controls, all patients with lung cancer (including the patient with carcinoma in situ) and all healthy persons were classified correctly (fig 6). This yielded negative and positive predictive values of 100%. The error rate estimated by the “leave one out” method was zero. The separation of both groups was independent of the smoking status (fig 7). Non-smokers and smokers were present in both the lung cancer and control groups. No clustering occurred on the discriminant value scale for smokers or non-smokers, either in the left part related to lung cancer or in the right part related to the control group.

Result of linear discriminant analysis (×, patient with carcinoma in situ).

Influence of smoking status on the discriminant values shown in fig 6. bc, bronchial carcinoma.
Discussion
Our data show that IMS can produce a discriminating combination of VOC peaks in patients with lung cancer. The expression of a constellation of 23 VOC peak areas allowed the classification of patients into those with a tumour and healthy subjects with an accuracy of 100%. The error rate estimated by the “leave one out” method was 0%.
The “leave one out” method was used for cross-validation; a single observation from the original samples was used as the validation data and the remaining observations served as the training data. In addition, the number of VOC peak areas was reduced in a stepwise selection to reduce model complexity and optimise the error rate. By considering 23 VOC peak areas and applying the “leave one out” method to 32 patients and 54 controls, all were classified correctly. This means that, in all cases, the “leave one out” patient was classified correctly when the model was built on the base of 23 VOC peak areas, while the prediction error was >0% when more VOC peak areas were included in the model. The next step will be to validate the model developed by the 23 VOC peaks and trained with data from 32 patients and 54 controls in larger populations using blinded data.
These results show that breath analysis by IMS has the potential to facilitate lung cancer recognition with a high degree of accuracy, as was reported for GC/MS analysis,5 8 electric nose,2 3 4 coloric array systems24 or even dogs specially trained for the detection of patients with lung cancer,25 reaching sensitivities and specificities of 71.4–99.0%.
The correct classification even of the patient with a carcinoma in situ by IMS may indicate that the VOC composition is not influenced by the tumour volume and stage itself, but that it probably represents an expression of metabolic processes influenced by the tumour. This assumption is supported by data from Deng et al26 who found increased concentrations of hexanal and heptanal in exhaled breath as well as in blood from patients with lung cancer. To confirm this, further studies are needed in patients with carcinoma in situ and in patients before and after complete tumour resection.
First examinations by Gordon et al of the value of VOCs in the detection of lung cancer showed nearly 300 different VOC peaks in GC/MS profiles of exhaled breath from patients with lung cancer.5 The capture of VOCs by sorbent traps followed by solid-phase micro-extraction or thermal desorption and GC/MS determination, as described by Phillips et al and other investigators,5 6 7 8 9 and the electric nose2 3 4 have remained the methods used in breath analysis. These methods use the cluster formation of VOCs for the diagnosis of lung cancer.3 5 6 8 9 However, the determination of special discriminating clusters is limited using the electric nose or GC/MS analysis. No method of VOC analysis has yet been able to determine a consistent tumour-specific VOC pattern.
Furthermore, the comparison of subgroups (smokers vs lung cancer, COPD vs lung cancer, healthy persons vs COPD) was based on different VOCs such as acetone, methyl-ethyl-ketone, n-propanol,5 pentane, 2-methylpentane, 2,4-dimethylpentane,7 different alkanes and methylated alkanes,8 methylpentane and isoprene9 or alcohols and different disulphides.3 Interestingly, even after tumour resection, Poli et al found a decrease in VOCs (isoprene and decane) that had not been tumour-specific in the primary diagnostic approach.9
In contrast to these methods, the methodological properties of IMS—which provides a complete breathogram with more than one million data points and a tenfold lower detection limit of VOCs—appear superior, especially because the distinct separation of all VOCs by retention time and mobility (drift time) and the determination of their concentration creates a three-dimensional topography of VOCs in exhaled breath. This unique VOC classification explains the higher probability of finding a disease-specific and discriminating VOC peak combination that allows diagnosis by pattern or cluster recognition without the need for chemical analysis of the underlying VOCs.
The central question of the present study—whether IMS can detect a specific combination of VOC markers in the exhaled breath of patients with lung cancer that differentiates them from healthy persons with a high degree of accuracy—is answered by the data shown. Previous studies have either compared patients with lung cancer with healthy persons, or healthy persons with patients with lung cancer, asthma, pulmonary arterial hypertension or COPD, as well as smokers and non-smokers.3 4 8 9 This makes the studies and their results difficult to compare with our study.
Since the most significant question concerns the existence of a malignancy, our IMS study was designed only to determine whether patients with lung cancer have a VOC pattern that separates them from controls, regardless of concomitant (especially pulmonary) disorders. Smoking status did not affect the discrimination of the two groups, as might have been suspected at first. This result supports the data of Philips et al8 who showed that smoking, histology and TNM classification had no influence on the discrimination by VOCs.
The IMS study has certain limitations. It included and compared patients with lung cancer with healthy controls but did not address the further prospective classification of patients with lung cancer and healthy controls based on the pre-selected combination of VOCs. This difference in study design may explain the higher accuracy compared with former studies on breath analysis.2 3 4 5 8 24 25
The patients with lung cancer were not matched to patients without lung cancer, and we did not include a further control group with other lung disease. The discriminating cluster of VOCs is therefore not necessarily a tumour-specific one. Furthermore, in most of the patients the tumour was at an advanced stage. Further studies are needed to discriminate between different kinds of lung disease and different stages of lung cancer. These studies need blinding with respect to diagnosis to minimise bias. Proper selection of the control group and the classification of subgroups (smoking status, COPD, medication) are also necessary.
However, our pilot study was primarily focused on the possibility of using IMS as an analytical method and its advantages. We intended to show that IMS, as a new method in breath analysis, can produce discriminating patterns of VOCs. These positive results could not be expected in advance.
The IMS pattern does not yield direct information about the underlying analytes. However, the original intention in IMS diagnostics is the separation of patient groups by discriminating pattern recognition. This is consistent with Gordon et al5 who regarded knowledge about chemical identity as unnecessary for peak classification. However, in a second step that is comparable to other methods of breath analysis, determination of the VOCs is possible by additional mass spectrometric analysis. The stepwise relation of analysed VOCs to a defined peak position in a chromatogram opens the way to a three-dimensional “IMS cartography of exhaled breath”. After this process has been finished, the peak position allows correlation with the original VOC. If it is possible to find disease-specific and diagnostic analytes or combinations of analytes, exhaled breath might exclusively be tested for these VOCs. In addition, the identification of these VOCs may give further information about the tumour biology and underlying metabolic processes.
In conclusion, breath analysis by IMS in patients with lung cancer and healthy controls provided a classification of both groups with an accuracy of 100% using a combination of 23 discriminating peak regions. The immediate twofold separation of VOCs that allows their visualisation in a three-dimensional chromatogram represents an important advantage of IMS over other methods. As the IMS procedure is based on pattern recognition, mass spectrometric analysis is not required. Data acquisition times of only 15 min offer good pre-conditions for the clinical use of IMS in breath analysis, especially if future computerised peak distribution analysis facilitates and accelerates further evaluation. For a reliable diagnosis and separation of lung cancer from other disorders, further measurements and an evaluation of the discriminating pattern in a larger group of patients are necessary.
Acknowledgments
Some of the presented results are data from the PhD thesis of Dr Vera Ruzsanyi, University of Dortmund, carried out at the Institute for Analytical Sciences (ISAS). Her valuable cooperation is gratefully acknowledged. The authors also thank Mrs Barbara Oberdrifter, Mrs Luzia Seifert, Mrs Stefanie Güssgen and Dr Wolfgang Vautz for their support in experimental tests and evaluation.
REFERENCES
Footnotes
See Editorial, p 737
Funding The study was financially supported by the Bundesministerium für Bildung und Forschung and the Ministerium für Innovation, Wissenschaft, Forschung und Technologie des Landes Nordrhein-Westfalen.
Competing interests None.
Ethics approval The study was approved by the Institutional Review Board and all participants gave their written informed consent for participation in the study.
Linked Articles
- Editorial