Article Text

Abstract
Background Relationships between indoor air quality (IAQ) found in schools and the allergic and respiratory health of schoolchildren have been insufficiently explored. A survey was conducted in a large sample of classrooms of primary schools in France to provide objective assessments of IAQ to which young schoolchildren are exposed in classrooms, and to relate exposure to major air pollutants found in classrooms to asthma and allergies of schoolchildren.
Methods Concentrations of fine particles with aerodynamic diameter ≤2.5 μm (PM2.5), nitrogen dioxide (NO2) and three aldehydes were objectively assessed in 401 randomly chosen classrooms in 108 primary schools attended by 6590 children (mean age 10.4 years, SD ±0.7) in the French 6 Cities Study. The survey incorporated a medical visit including skin prick testing (SPT) for common allergens, a test for screening exercise-induced asthma (EIA) and a standardised health questionnaire completed by parents.
Results Children were differently exposed to poor air quality in classrooms, with almost 30% being highly exposed according to available standards. After adjusting for confounders, past year rhinoconjunctivitis was significantly associated with high levels of formaldehyde in classrooms (OR 1.19; 95% CI 1.04 to 1.36). Additionally, an increased prevalence of past year asthma was found in the classrooms with high levels of PM2.5 (OR 1.21; 95% CI 1.05 to 1.39), acrolein (OR 1.22; 95% CI 1.09 to 1.38) and NO2 (OR 1.16; 95% CI 0.95 to 1.41) compared with others. The relationship was observed mostly for allergic asthma as defined using SPT. A significant positive correlation was found between EIA and the levels of PM2.5 and acrolein in the same week.
Conclusions In this random sample, air quality in classrooms was poor, varied significantly among schools and cities, and was related to an increased prevalence of clinical manifestations of asthma and rhinitis in schoolchildren. Children with a background of allergies seemed at increased risk.
- PM2.5
- NO2
- FA
- VOC
- asthma
- allergic rhinitis
- skin prick test positivity
- asthma epidemiology
- COPD epidemiology
- paediatric asthma
- tobacco and the lung
- respiratory muscles
- assisted ventilation
This is an open-access article distributed under the terms of the Creative Commons Attribution Non-commercial License, which permits use, distribution, and reproduction in any medium, provided the original work is properly cited, the use is non commercial and is otherwise in compliance with the license. See: http://creativecommons.org/licenses/by-nc/2.0/ and http://creativecommons.org/licenses/by-nc/2.0/legalcode.
Statistics from Altmetric.com
- PM2.5
- NO2
- FA
- VOC
- asthma
- allergic rhinitis
- skin prick test positivity
- asthma epidemiology
- COPD epidemiology
- paediatric asthma
- tobacco and the lung
- respiratory muscles
- assisted ventilation
Key messages
What is the key question?
How bad is air quality at school for children' respiratory health?
What is the bottom line?
In our random sample, air quality in classrooms was poor, varied significantly among schools and cities.
Almost 30% of school children were highly exposed according to WHO standards. Exposure to elevated concentrations of particulate matter and volatile organic compounds found in classrooms was significantly related to current asthma and rhino-conjunctivitis in schoolchildren.
Children with a background of allergies were at increased risk.
Why read on?
Our results are of relevance for public health because the population of exposed school children is huge due to the fact that primary school is compulsory and because childhood asthma and allergies are very common.
Introduction
Children are frail during their growth and because of their physical constitution and breathing pattern are more susceptible to the health effects of air pollution than adults.1 In industrialised countries, children spend more time (up to 80%) indoors, mostly in schools, than in other places except home. In the USA, data from the Environmental Protection Agency (http://nces.ed.gov/surveys/frss/publications/2000032) have shown that many schools have problems linked to poor indoor air quality (IAQ) with indoor air pollutant levels two to five times higher than outdoor levels. Indoor air pollutants can cause or contribute to short-term and long-term health problems, including nasal congestion, eye and skin irritations, coughing, sneezing, respiratory tract infection, allergic reactions, asthma, headaches, fatigue, dizziness and nausea.2 ,3 Moreover, indoor air pollutants can cause discomfort and reduce school attendance and productivity.4 However, data on air quality found in classrooms and its health effects are scant and inconsistent. Furthermore, few studies have used objective assessments of air quality and health indicators.5
To bridge the knowledge gap on the health effects of air pollution in children at school, we conducted a survey in a large representative sample of classrooms in six French cities. The survey protocol was intended to provide data on IAQ in primary schools in France objectively measured in the frame of a field campaign, and on the relationships between major air pollutants found in the classrooms and asthma and rhinitis in schoolchildren using these classrooms. The air pollutants considered included fine particles with aerodynamic diameter ≤2.5 μm (PM2.5), nitrogen dioxide (NO2), formaldehyde, acetaldehyde and acrolein. In the analysis, various cofactors were taken into account as potential confounders.
Methods
Population and survey
The 6 Cities Study (http://www.epar.fr) aimed to investigate the impact on childhood asthma and allergies of air pollutants objectively assessed in different settings, including schools in six cities (Bordeaux, Clermont-Ferrand, Créteil, Marseille, Strasbourg and Reims) chosen for heterogeneity of air pollution. Study participants were children aged 9–10 years who were invited to take part in a health survey according to a standardised protocol6–8 (for detailed information on the study protocol, see the online data supplement). Times of school visits for air quality assessment and medical examination of the children were randomly chosen.
Air quality
School visits were conducted during class time in the academic year. Concentrations of NO2, formaldehyde, acetaldehyde and acrolein were measured with passive diffusion samplers (Radiello, Padua, Italy). Concentrations of PM2.5 were measured from Monday to Friday (night and day) using filter-based samples, charged with a pump, from representative points of the classroom. These measurements were made during the week when most of the children using the classroom underwent medical examination using standardised methodology.7 However, for logistic reasons, in some children the examination was realised beforehand or postponed. Analyses were performed in Padua for NO2 and aldehyde samples, and in Paris for PM2.5 filters. Methods, reliability and reproducibility of air pollution assessment have been presented elsewhere.7 ,9 ,10
Health status
Parents gave written informed consent for their children to have a medical examination, including skin prick testing (SPT) to 10 common allergens and exercise-induced asthma (EIA) according to the standardised protocol of the run test.7 Parents also completed an enriched version of the International Study of Asthma and Allergies in Childhood (ISAAC) phase II questionnaire (for details, see the online data supplement). SPT positivity was defined as a weal at least 3 mm greater than that of the negative control for any of the allergens, 15 min after pricking. EIA was calculated using the formula PEFin−PEFfin/PEFin ≥10% (PEF=peak expiratory flow).9–11 All steps of the study protocol received approval from the French National Ethics Board.
Studied variables
For each pollutant, a 5-day mean concentration (μg/m3) in the classroom was computed and a three-class variable of exposure (high, medium or low) was defined with respect to the tertiles of the concentration distribution in the classroom, independent of the city. To investigate the impact of air quality in classrooms, health outcomes included EIA during the period of the survey and rhinoconjunctivitis and asthma in the past year (‘sneezing and runny nose accompanied by itchy eyes out of cold in the past year’ and ‘ever had asthma’; having responded positively to at least one of these questions, ‘wheezing or whistling in the chest’ or ‘wheezing or whistling in the chest at night-time’ or ‘having taken asthma treatment’ in the past year). Asthma was classified as allergic, when accompanied by SPT positivity to at least one allergen and non-allergic otherwise. Potential confounders assessed through the standardised ISAAC questions included age, gender, passive smoking, paternal or maternal history of asthma and allergic diseases, dampness, gas appliance, ethnicity and socio-economic status (SES) coded using the French Institut National de la Santé et des Etudes Economiques classification (http://www.insee.fr).
Statistical and epidemiological analyses
Between-school and within-school variability (‘schools’ variance and ‘classrooms’ variance, respectively) of the measured indoor pollutants were estimated using linear mixed models for longitudinal data (SAS MIXED procedure). Comparisons between groups for population characteristics were made using the Student t test for continuous variables and the Pearson χ2 test or exact Fisher test for categorical variables. Pearson correlations were estimated between 5-day mean concentrations of the various air pollutants and the prevalence of EIA assessed during the same week of investigation. To investigate the relationship between each health outcome and each air pollutant, a marginal model was used,11 taking into account the non-independence of data for children living in the same residential area (as defined by the school) and sharing the same environment (climate, pollens, social factors, food products, diet etc). This model calculated the adjusted OR for each health outcome at different levels of pollutant exposure. The parameters of the marginal model were estimated using the generalised estimating equation approach (SAS GENMOD) with independent working correlation structure using the city as stratum. These analyses were stratified using SPT positivity to investigate the role of atopic status. Association analyses were restricted to the subsample of schoolchildren who underwent a medical examination in the same week as air quality assessments were performed to diminish exposure misclassification (sensitivity analysis). SAS System for AIX V.8.2 was used for statistical analyses. A p value <0.05 indicated statistical significance.
Results
Overall, 7780 children out of 9615 who were initially selected participated in the study. Their mean age was 10.4 years. They originated from 401 classrooms of the 108 targeted schools in the six cities with the questionnaire filled out by the parents (response rate 81%). A total of 6683 school children (69%) completed the entire survey protocol. The analyses were limited to 6590 schoolchildren for whom all the variables of interest were available. Overall, 4643 schoolchildren underwent a medical examination during the same week that air quality assessments were performed (restricted sample, sensitivity analysis). Children of the restricted sample did not differ significantly from the others in terms of age, sex, weight, height and baseline peak flow, but they had more educated fathers (table 1). Approximately one in three children had at least one positive SPT (table 2). Only 31 children were positive to trophoallergens. Monosensitisation was observed in 11.2% of children and polysensitisation in 16.8%. Rhinoconjunctivitis was the most common condition, followed by EIA and asthma. As expected, allergic asthma was more frequent than non-allergic asthma.
Characteristics of the schoolchildren having participated in the French 6 Cities Study
Prevalence rates (%) of allergic sensitisation and allergic and respiratory morbidity in the French 6 Cities Study in the entire sample population (n=6590) and in the restricted sample of children who had a clinical examination during the same week as air quality assessments (n=4643)
Air quality and health indicators
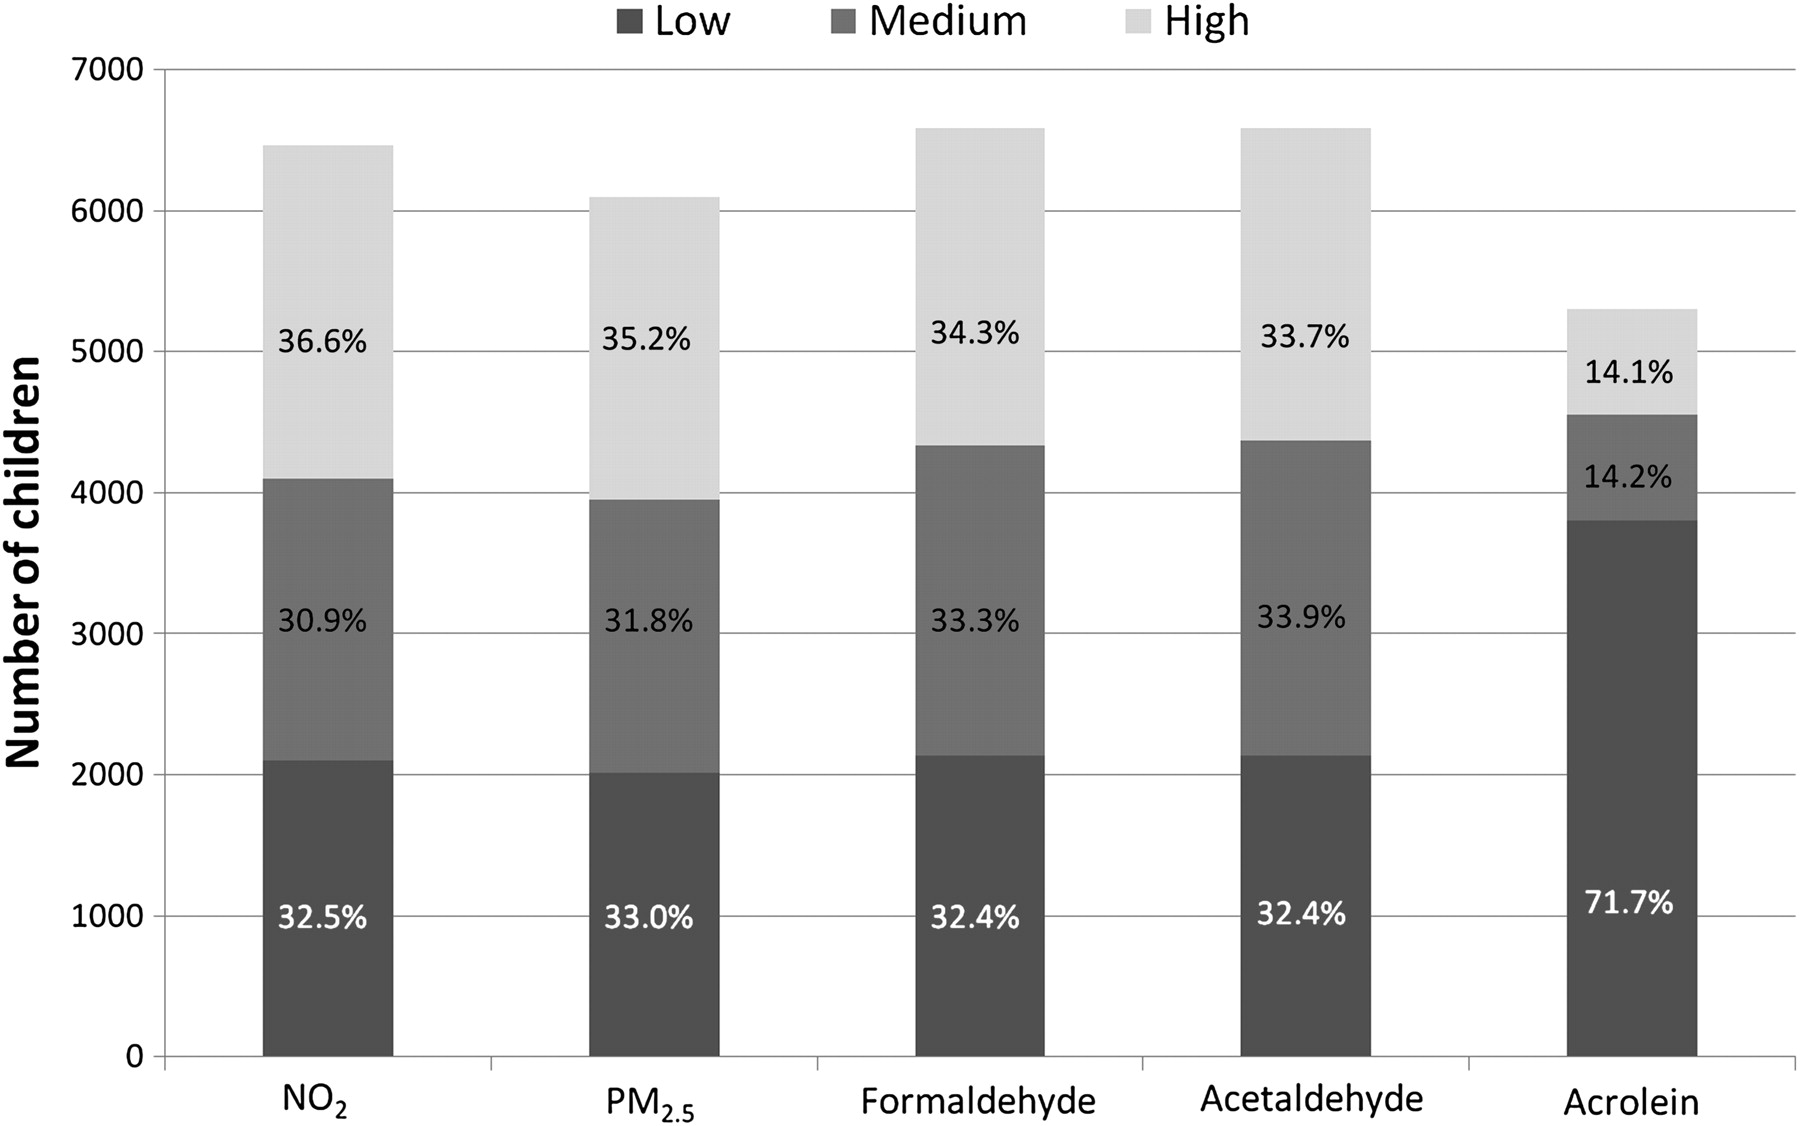
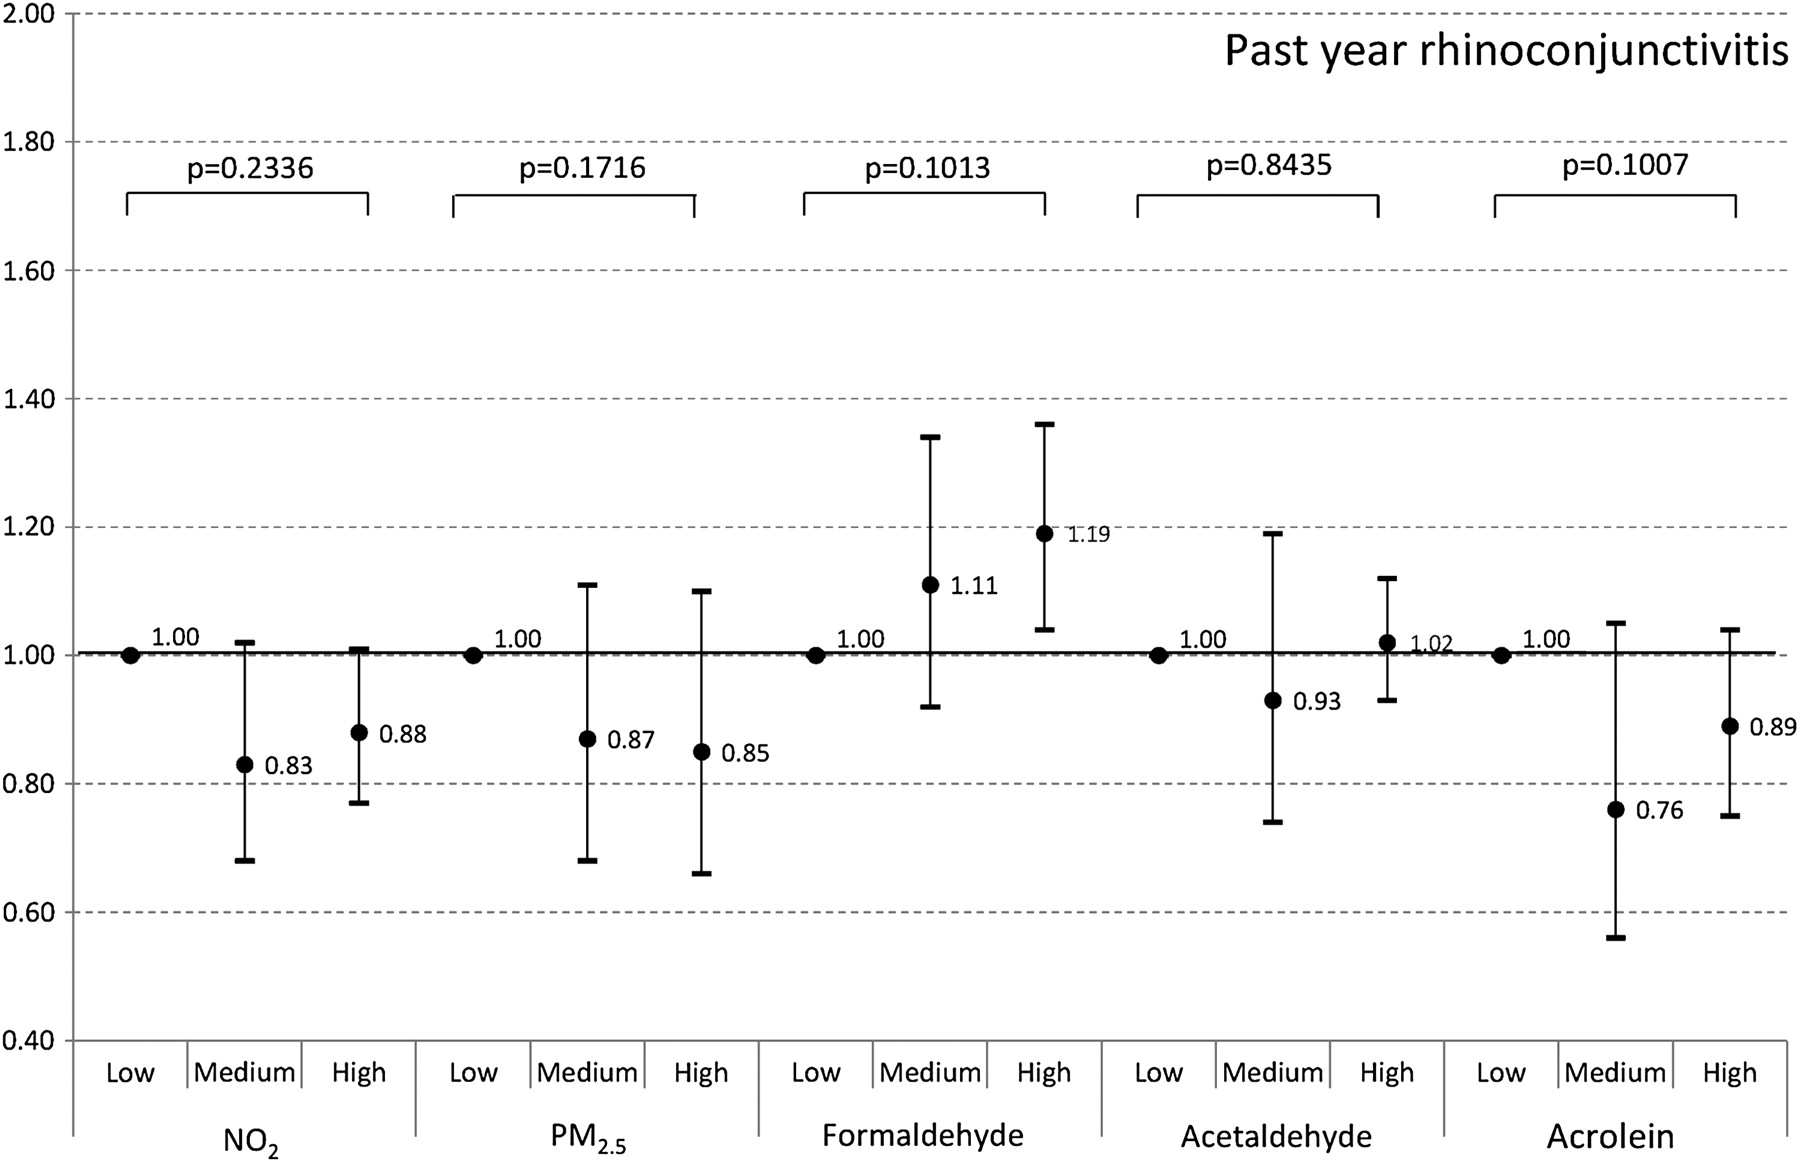
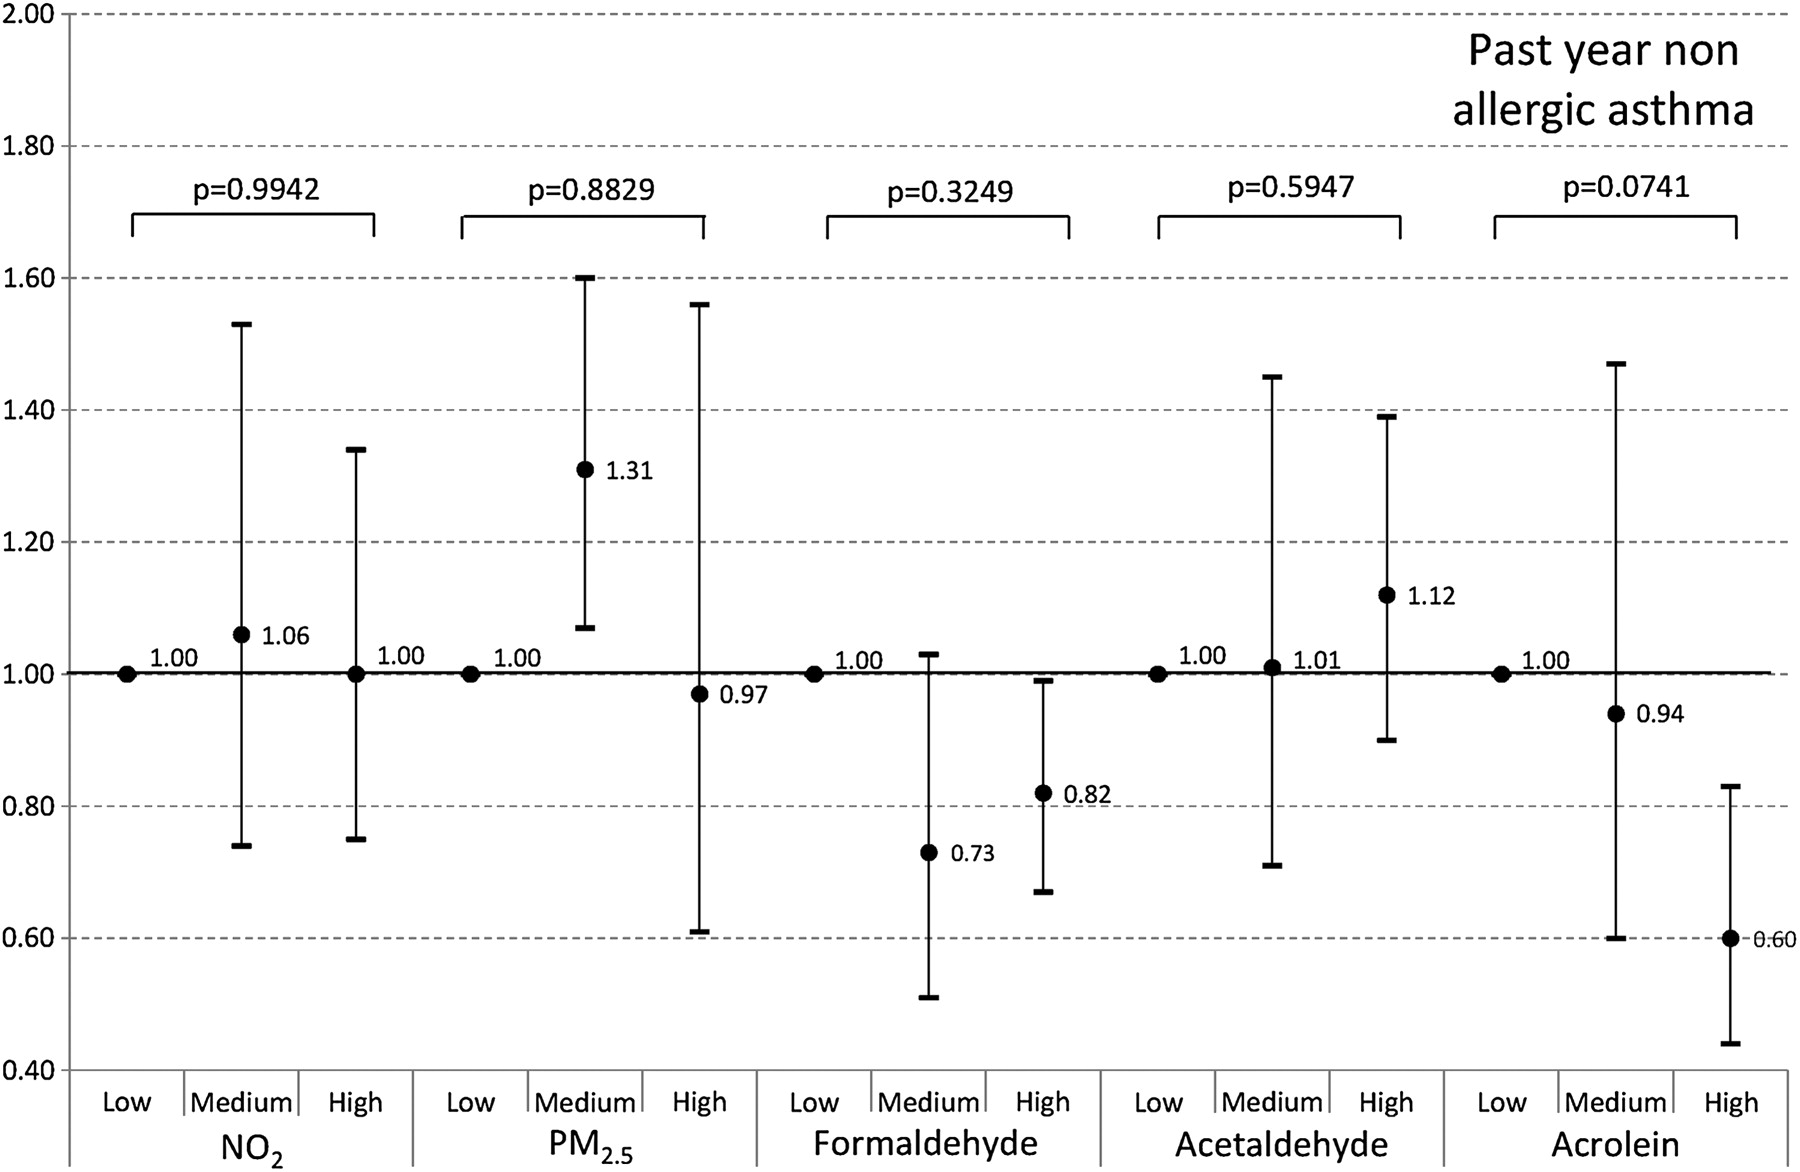
Air pollutants were variously distributed in the sample (figure 1). The lowest within-school (classrooms) variance was observed for acrolein (variance=2.55 μg/m3; SE=0.19 μg/m3; p<0.001) and the highest for formaldehyde (variance=183.52 μg/m3; SE=12.47 μg/m3; p<0.001) whereas the lowest between-school (schools) variance was observed for acrolein (variance=3.08 μg/m3; SE=0.53 μg/m3; p<0.001) and the highest for NO2 (variance=107.26 μg/m3; SE=15.54 μg/m3; p<0.001) (for details, see the online data supplement). Overall, about one-third of the children were exposed to high concentrations of air pollutants according to standards indicated by WHO for PM2.5 (10 μg/m3) and NO2 (40 μg/m3) (figure 2). In some classrooms, very high concentrations were found for formaldehyde, PM2.5 and NO2. After adjusting for confounders, rhinoconjunctivitis was more frequent in classrooms with high formaldehyde concentrations (figure 3) and asthma was more common in classrooms with high PM2.5 and acrolein levels (figure 4). The results are consistent after accounting for SES and ethnicity in the marginal models. Stratifying the population according to SPT positivity showed that PM2.5, acrolein and NO2 were significantly related to allergic asthma (figure 5). In contrast, acrolein was negatively associated with non-allergic asthma (figure 6). Taking into account the time of year when the survey was conducted (spring and summer: 227 classrooms, 3609 schoolchildren; autumn and winter: 175 classrooms, 2981 schoolchildren), the following significant relationships were found: PM2.5 and asthma (OR 1.28, 95% CI 1.00 to 1.65), acrolein and asthma (OR 1.37, 95% CI 1.14 to 1.66) and PM2.5 and allergic asthma (OR 1.41, 95% CI 1.16 to 1.73) during the warm season; NO2 and asthma (OR 1.18, 95% CI 1.01 to 1.39) and FA and rhinoconjunctivitis (OR 1.41, 95% CI 1.08 to 1.85) during the cold season. The sensitivity analysis confirmed previous results, although with a diminished statistical significance, probably because of the reduced sample size (data not shown). However, non-allergic asthma was found to be inversely related to acrolein (OR 0.36, 95% CI 0.29 to 0.44). The results were consistent after stratifying the restricted sample according to atopic status. Lastly, levels of PM2.5 and acrolein in classrooms correlated positively with the prevalence of EIA, which was assessed simultaneously (table 3).
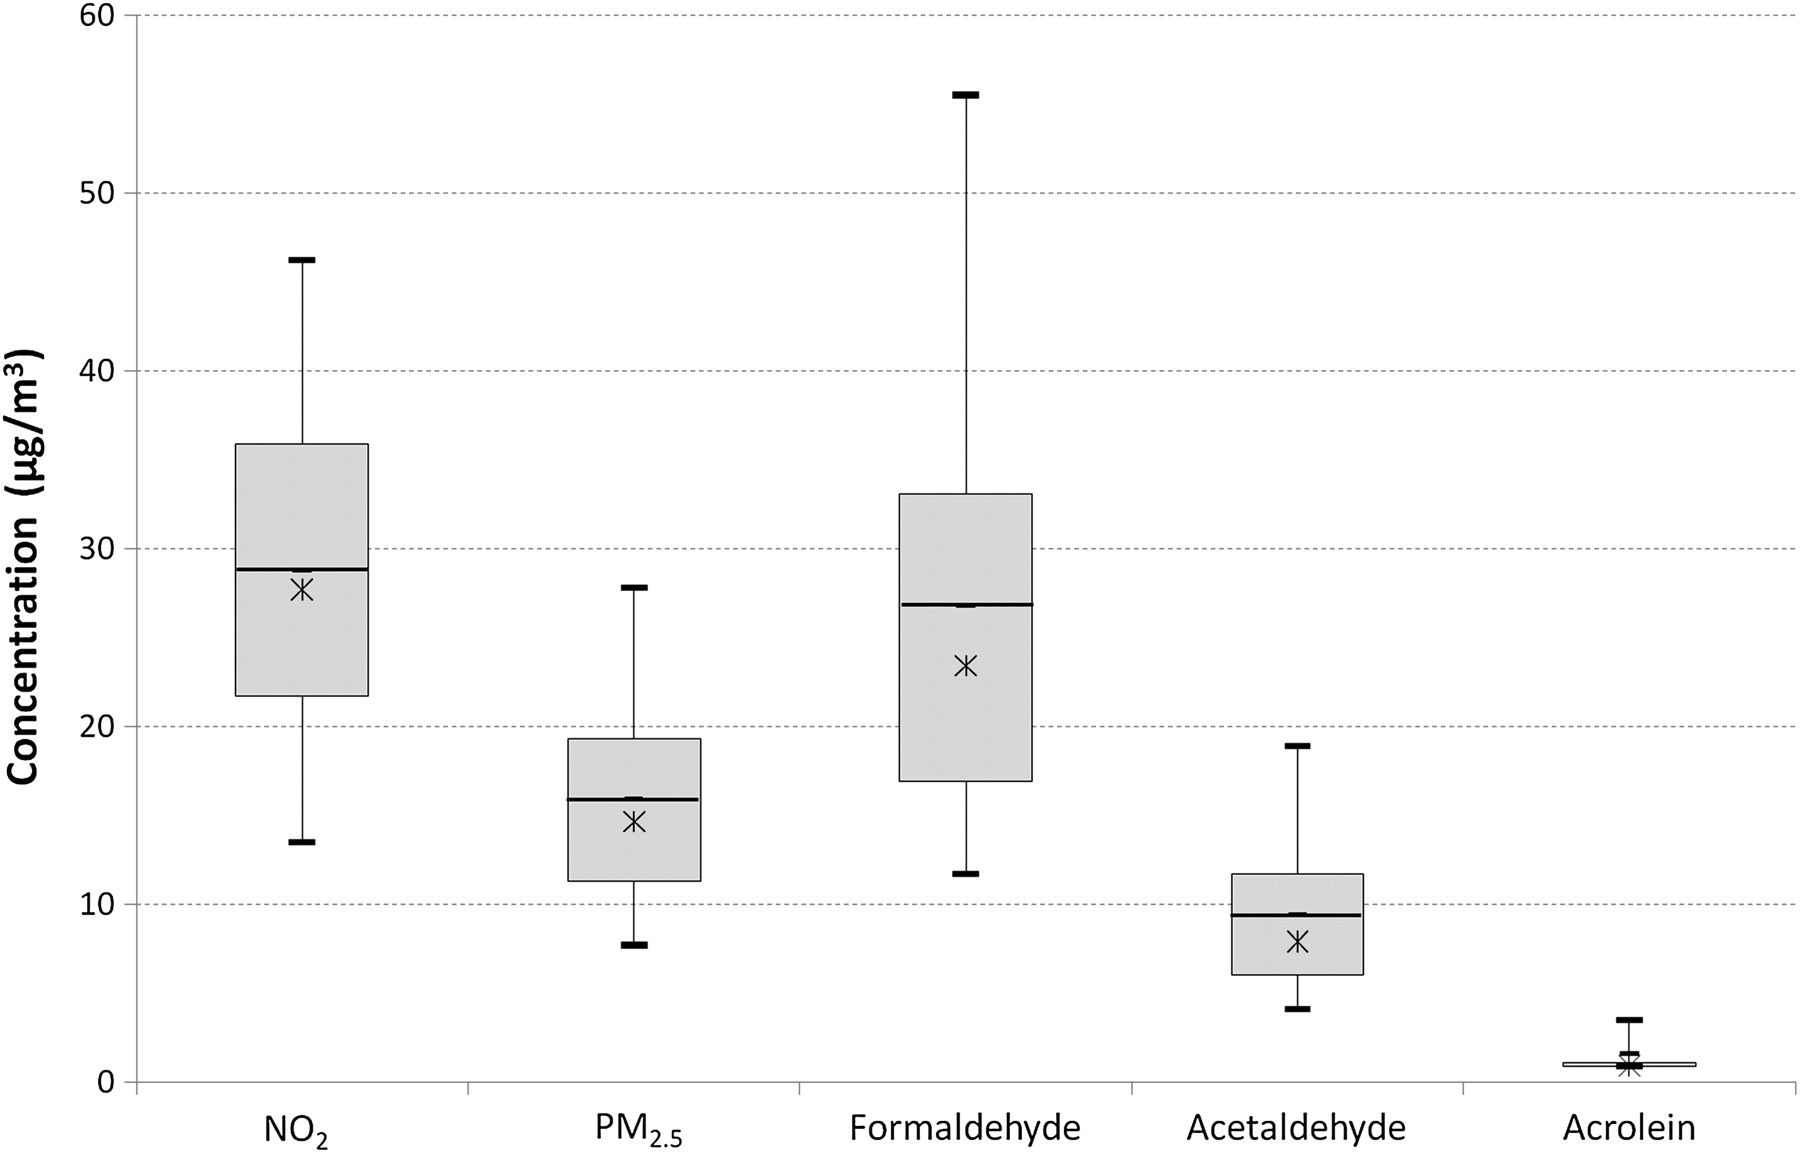
Concentration of indoor air pollutants in classrooms in the 6 Cities Study (N=408 classrooms). The median value is displayed as a line in each box, the mean as a cross, and box limits represent the 25th and 75th percentiles. The whiskers extend to the 5th and 95th percentile. NO2, nitrogen dioxide; PM2.5, fine particles with aerodynamic diameter ≤2.5 μm.

Exposure of schoolchildren in the 6 Cities Study the entire sample population (N=6590). Tertiles are defined according to the distribution of air pollutants in the classrooms (in μg/m3). Nitrogen dioxide (NO2): low ≤23.7, medium >23.7 to ≤31.6, high >31.6; fine particles with aerodynamic diameter ≤2.5 μm (PM2.5): low ≤12.2, medium >12.2 to ≤17.5, high >17.5; formaldehyde: low ≤19.1, medium >19.1 to ≤28.4, high >28.4; acetaldehyde: low ≤6.5, medium >6.5 to ≤9.9, high >9.9; acrolein: low=limit of detection (LD), medium >LD to ≤1.55, high >1.55.

Relationships between air pollutants in classrooms and current rhinoconjunctivitis in the entire sample population of schoolchildren (N=6590) of the 6 Cities Study. Tertiles are defined according to the distribution of air pollutants in the classrooms (in μg/m3). Nitrogen dioxide (NO2): low ≤23.7, medium >23.7 to ≤31.6, high >31.6; fine particles with aerodynamic diameter ≤2.5 μm (PM2.5): low ≤12.2, medium >12.2 to ≤17.5, high >17.5; formaldehyde: low ≤19.1, medium >19.1 to ≤28.4, high >28.4; acetaldehyde: low ≤6.5, medium >6.5 to ≤9.9, high >9.9; acrolein: low=limit of detection (LD), medium >LD to ≤1.55, high >1.55. Dots are OR adjusted for age, gender, passive smoking and paternal or maternal history of asthma and allergic diseases; bars are 95% CIs.

Relationships between air pollutants in classrooms and past year asthma in the entire sample population of schoolchildren (N=6590) of the 6 Cities Study. Tertiles are defined according to the distribution of air pollutants in the classrooms (in μg/m3). Nitrogen dioxide (NO2): low ≤23.7, medium >23.7 to ≤31.6, high >31.6; fine particles with aerodynamic diameter ≤2.5 μm (PM2.5): low ≤12.2, medium >12.2 to ≤17.5, high >17.5; formaldehyde: low ≤19.1, medium >19.1 to ≤28.4, high >28.4; acetaldehyde: low ≤6.5, medium >6.5 to ≤9.9, high >9.9; acrolein: low=limit of detection (LD), medium >LD to ≤1.55, high >1.55. Dots are OR adjusted for age, gender, passive smoking and paternal or maternal history of asthma and allergic diseases; bars are 95% CIs.

Relationships between air pollutants in classrooms and past year asthma among atopic children (N=1719) of the 6 Cities Study. Tertiles are defined according to the distribution of air pollutants in the classrooms (in μg/m3). Nitrogen dioxide (NO2): low ≤23.7, medium >23.7 to ≤31.6, high >31.6; fine particles with aerodynamic diameter ≤2.5 μm (PM2.5): low ≤12.2, medium >12.2 to ≤17.5, high >17.5; formaldehyde: low ≤19.1, medium >19.1 to ≤28.4, high >28.4; acetaldehyde: low ≤6.5, medium >6.5 to ≤9.9, high >9.9; acrolein: low=limit of detection (LD), medium >LD to ≤1.55, high >1.55. Dots are OR adjusted for age, gender, passive smoking and paternal or maternal history of asthma and allergic diseases; bars are 95% CIs.

Relationships between air pollutants in classrooms and past year asthma among non-atopic children (N=4377) of the 6 Cities Study. Tertiles are defined according to the distribution of air pollutants in the classrooms (in μg/m3). Nitrogen dioxide (NO2): low ≤23.7, medium >23.7 to ≤31.6, high >31.6; fine particles with aerodynamic diameter ≤2.5 μm (PM2.5): low ≤12.2, medium >12.2 to ≤17.5, high >17.5; formaldehyde: low ≤19.1, medium >19.1 to ≤28.4, high >28.4; acetaldehyde: low ≤6.5, medium >6.5 to ≤9.9, high >9.9; acrolein: low=limit of detection (LD), medium >LD to ≤1.55, high >1.55. Dots are OR adjusted for age, gender, passive smoking and paternal or maternal history of asthma and allergic diseases; bars are 95% CIs.
Correlations between concentrations of air pollution and exercise-induced asthma (EIA) in the sample of children who had a clinical examination during the same week as air quality assessments (n=4643)
Discussion
In a random sample of primary schools, air quality in classrooms was poor and varied significantly among buildings and cities. Elevated levels of major pollutants were found to be related to a higher prevalence among schoolchildren of rhinoconjunctivitis and asthma in the year of the survey, and of EIA on the day of assessment. Children with a background of allergies were at increased risk.
In some classrooms, the mean concentrations of fine particles and NO2 were higher than the threshold limits proposed for the control of health hazards by WHO (10 μg/m3 and 40 μg/m3 respectively). Elevated concentrations were also found for formaldehyde compared with the limits proposed by the French Agency for Environmental Safety (50 μg/m3 in the short term (2 h)), 10 μg/m3 in the long term (1 year)). Thirty per cent of schoolchildren were exposed to such elevated levels of air pollution in classrooms, which confirms previous observations. In 27 primary schools located in the city centre and suburbs of Antwerp, Belgium indoor PM2.5 and BTEX (benzene, toluene, ethylbenzeneand xylenes) concentrations were elevated and exceeded the ambient concentrations, thus raising concerns about possible adverse health effects in susceptible children.9 In the cross-sectional EU-funded Health Effects of School Environment (HESE) Study conducted in five European countries, the proportions of schoolchildren highly exposed to PM10 and CO2 according to the standards for good IAQ (>50 μg/m3 and >1000 ppm, respectively) were 78% and 66%, respectively.10 This is in line with the report by the European Federation of Asthma and Allergy Associations, indicating that the right to breathe clean air in European schools is not encountered throughout Europe (http://paginas.fe.up.pt).
In this study, the alarming consequence of poor air quality in classrooms was a deterioration of respiratory health. A high prevalence of asthma in the past year was found in children using classrooms with ‘high’ pollution levels of PM2.5, NO2 and acrolein. Similarly, a high prevalence of rhinoconjunctivitis in the past year was found in children using classrooms with high levels of formaldehyde. In addition, schoolchildren experienced significantly more EIA during the run test when attending classrooms with elevated levels of PM2.5 and acrolein.
The association between air pollution in classrooms and respiratory health of schoolchildren was predictable12 on the basis of previous findings obtained in experimental and epidemiological settings. This suggests that there is potential for air pollution to be a contributory factor to asthma and allergies, including allergic sensitisation and morbidity in some causal sequences.13 However, while evidence is accumulating on the adverse impact of outdoor air pollution exposure on respiratory health,14 few data exist on indoor air pollution and resulting respiratory health effects,5 and even less in the case of school air quality. This lack of data is in spite of the fact that there is growing concern about the school environment, where children spend up to 8 h/day.15–19 Air pollutants have been found in classrooms20–22 that are known to be associated with deteriorating respiratory health in other indoor settings.5 In a subsample of the 6 Cities Study, exposure to acetaldehyde, toluene and formaldehyde at home was significantly associated with a higher risk of asthma.23 Associations between respirable dust concentrations or amount of settled dust in the classroom with asthma symptoms, new onset of self-reported pet allergy and new onset of asthma diagnoses were reported in Swedish schoolchildren.18 ,24 In the HESE Study, PM10 and CO2 levels in a day of normal activity (full classroom) were related to dry cough at night and rhinitis in 654 children aged 10 years and to nasal patency in the subsample having performed this clinical test.10 All disorders were more prevalent in children attending poorly ventilated classrooms than in others. In our study, none of the classrooms were mechanically ventilated, which is common in French schools where ventilation is still provided by opening windows, so comparison is not possible with other studies. In 30 classrooms in 10 naturally ventilated schools in Shanghai, indoor NO2 was associated with current asthma and asthma medication (OR 1.45 for 10 μg/m3; p<0.01).21 For the first time, in our study we examined the effects of acrolein in classrooms. Interestingly, acrolein, which is a powerful irritant,25 was significantly associated with EIA and past year asthma. However, it cannot be excluded that acrolein is a proxy of other indoor air pollutants that were not assessed in our study.
Our study on air pollution exposure was for a limited period of time and was conducted in late childhood, therefore it does not allow clarification of the role of air pollution in the development of asthma and allergies. However, it highlights the effect that school air quality may have on asthma and rhinitis related morbidity. In our study, schoolchildren from classrooms with elevated levels of air pollutants experienced more clinical manifestations of asthma and rhinitis than others. This suggests that in the school setting, even in the absence of environmental smoking and other combustion sources, children may be equally exposed to air pollution. The fact that children attend school with associated environmental exposures early in life is also relevant because childhood is a particularly vulnerable period, when air pollution and other exposures are encountered.1 ,26 Other significant factors at this stage of life, but not investigated in our study, are air-pollutant-related disturbances observed in schoolchildren, such as learning impairment and poor cultural and social development.27 As a consequence, good air quality at school has to be maintained so as not to expose children to an increased risk of these conditions.
Our study had several limitations. Although air pollution measurements were avoided during the summer, end-of-term vacations and at weekends, and the teachers were asked not to modify activities to reduce exposure misclassification, the 5-day measurements may not have been representative of children's usual exposure at school. In addition, the school environment could not have been the only factor responsible for the observed health effects because children might have been exposed to air pollution at home and outdoors. However, taking into account domestic sources of air pollution (environmental smoking, dampness, gas appliances) did not modify the relationship between air pollution at school and respiratory health in our study. The noxious effect of outdoor air pollutants including aldehydes has already been established in our population using various exposure assessments.6–8 Nonetheless, the indoors (classrooms)/outdoors (cities) ratio for aldehydes was higher than 1 (10), indicating that the levels of these pollutants were higher indoors than outdoors. This suggests that indoor exposure to formaldehydes and acrolein plays a role in the development of asthma and rhinitis. Health outcomes other than EIA and allergic sensitisation were reported by parents using the ISAAC questionnaire, which is a robust measure. Nevertheless, using these reports in the absence of objective validation could lead to misclassification of asthma and rhinitis. The definition of asthma used in this study, which combined ever asthma and current symptoms, could also have influenced the results by excluding children with asthma who were not aware of their condition because they had not received a diagnosis. However, figures for current asthma-like symptoms in the absence of ever asthma showed similar trends. Finally, due to the cross-sectional study design and the extent of air pollution measurements, our data do not allow causal relationships between air pollution and asthma and rhinitis to be established.
The strengths of our study are the sampling design, the large number of schools and classrooms, the objective assessments of various air pollutants and the sensitivity analysis, which was restricted to children for whom clinical examination and air pollution assessment were conducted simultaneously, confirming the observed associations. Restricting the analysis to these children not only reduced exposure misclassificiation bias but was also appropriate to investigate short-term effects of air pollution on EIA. Although small, the significant correlations between EIA and PM2.5 and acrolein represent an important message for public health as between 40% and 90% of people with asthma usually have EIA and could be at even higher risk when exposed to air pollution. In our population, asthma and EIA were highly related (OR 10.49, 95% CI 7.31 to 15.05).
In conclusion, poor air quality was found in randomly chosen classrooms of primary schools in metropolitan France and was related to an increased prevalence of clinical manifestations of asthma and rhinitis among schoolchildren. Whether and how exposure at school plays a role in the development of asthma and allergies needs further investigation, taking into account individual daily activity patterns.
Acknowledgments
We are particularly indebted to pupils and parents without whom the study would not have been possible. We thank Yvon Le Moullec and Anne-Marie Laurent from Laboratoire d'Hygiène de la Ville de Paris, who centralised air pollution assessments and took charge of PM assessments, and Gilles Perron, Joseph Kleinpeter and Alain Target from ASPA in Strasbourg, who assessed the reproducibility of air pollution assessment. We thank David Moreau from the EPAR Department, UMR-S 707, Paris who created the database and contributed to the statistical analysis, and Soutrik Banerjee from the EPAR Department, UMR-S 707, Paris who also contributed to the statistical analysis. We thank the study field team and staff at the participating air quality districts in the six cities, who helped to establish the quality of air in schools. We also thank Vincenzo Cocheo and Paolo Sacco (Fondazione Maugeri, Italy) who helped in air pollutants assessment through passive samplers, the Education Nationale, the school doctors, school principals and teachers. We thank Professor Mercier from Comité Contre la Tuberculose et les Maladies Respiratoires, on the aegis of which the survey was conducted. Allergen extracts for skin prick testing were kindly provided by Stallergènes Laboratoires (Antony, France).
References
Supplementary materials
Supplementary Data
This web only file has been produced by the BMJ Publishing Group from an electronic file supplied by the author(s) and has not been edited for content.
Files in this Data Supplement:
- Download Supplementary Data (PDF) - Manuscript file of format pdf
Footnotes
Funding The French 6 Cities Study was supported by National Institute for Health and Medical Research (INSERM) (Programme Déterminants de la Santé), Ministry of Health (DGS), Environmental Programme PRIMEQUAL-PREDIT, Agence de la Maîtrise de l'Energie (ADEME), Mutuelle Générale de l'Education Nationale (MGEN), Agence Française de Sécurité Sanitaire de l'Environnement et du Travail (AFSSET) and ANTADIR.
Competing interests None.
Patient consent obtained.
Ethics approval French CCPPRB.
Provenance and peer review Not commissioned; externally peer reviewed.
Data sharing statement The 6 Cities Study should allow investigation of the relationship between stress, air pollution, asthma and allergies.
Linked Articles
- Airwaves