Article Text

Abstract
Objective To assess the performance of the Brock malignancy risk model for pulmonary nodules detected in routine clinical setting.
Methods In two academic centres in the Netherlands, we established a list of patients aged ≥40 years who received a chest CT scan between 2004 and 2012, resulting in 16 850 and 23 454 eligible subjects. Subsequent diagnosis of lung cancer until the end of 2014 was established through linking with the National Cancer Registry. A nested case–control study was performed (ratio 1:3). Two observers used semiautomated software to annotate the nodules. The Brock model was separately validated on each data set using ROC analysis and compared with a solely size-based model.
Results After the annotation process the final analysis included 177 malignant and 695 benign nodules for centre A, and 264 malignant and 710 benign nodules for centre B. The full Brock model resulted in areas under the curve (AUCs) of 0.90 and 0.91, while the size-only model yielded significantly lower AUCs of 0.88 and 0.87, respectively (p<0.001). At 10% malignancy risk, the threshold suggested by the British Thoracic Society, sensitivity of the full model was 75% and 81%, specificity was 85% and 84%, positive predictive values were 14% and 10% at negative predictive value (NPV) of 99%. The optimal threshold was 6% for centre A and 8% for centre B, with NPVs >99%.
Discussion The Brock model shows high predictive discrimination of potentially malignant and benign nodules when validated in an unselected, heterogeneous clinical population. The high NPV may be used to decrease the number of nodule follow-up examinations.
- lung cancer
Statistics from Altmetric.com
Key messages
What is the key question?
Can the Brock model be reliably used as a lung cancer risk calculator in a non-screening population?
What is the bottom line?
The performance of the Brock lung cancer risk prediction model remains high when applied in an unselected, heterogeneous clinical population.
Why read on?
The Brock risk calculator has been developed and validated on selected lung cancer screening populations, but has thus far not been tested in a large clinical cohort.
Our external validation study of a large multicentre clinical population shows persistent discriminative power of the Brock model when used on clinically detected nodules.
Introduction
Several guidelines provide recommendations on how to manage pulmonary nodules based on the estimated risk of malignancy.1–4 Furthermore, several mathematical prediction models have been developed using both clinical and radiological criteria to help clinicians discriminate malignant from benign lesions.5–7
McWilliams et al 8 published the first risk calculator—known as the Brock or PanCan model—mathematically modelled to the outcome of screen-detected nodules in a large lung cancer screening trial. The model achieved a high performance for predicting malignancy on a per-nodule basis with an area under the curve (AUC) exceeding 0.90. Subsequently, validation of the model using lung cancer screening data from various studies reached similarly high prediction values.9–11
In the Lung Imaging Reporting and Data System (Lung-RADS; published by the American College of Radiology), radiologists are encouraged to use the Brock model to decide on the follow-up procedure in CT lung cancer screening.1 Similarly, the British Thoracic Society (BTS) released guidelines for the investigation and management of pulmonary nodules in both screening and clinical settings, integrating the Brock model as a risk assessment tool for solitary non-calcified nodules. An empirically set threshold of a 10% malignancy risk in the Brock model guides the management for each nodule.3
Screening participants, in contrary to routine clinical subjects, usually have more small nodules and are subject to specific inclusion and exclusion criteria (eg, heavy smoking and age). Therefore, the high performance of the Brock model in screening cohorts may not automatically be extrapolated to a clinical setting. So far there is only one publication evaluating Brock in a clinical context. Al-Ameri et al 12 reported that the Brock model was superior to other prediction models when applied on clinical data.6 7 However, this study focused on a relatively small population (n=244), excluded pure ground-glass nodules and was conducted in a single centre. Thus, the question remains whether the model performs similarly well in a clinical population compared with the screening setting in which it was designed. This study aims to validate the Brock model on an unselected, large and heterogeneous multicentre clinical population.
Methods
Study population
We conducted our study at two academic centres in the Netherlands: University Medical Center Utrecht (centre A) and Radboud University Medical Center, Nijmegen (centre B). In both centres the institutional review board waived the need for informed consent because of its retrospective design and the use of anonymised data.
A list of all subjects aged 40 years and older who received a chest CT scan between January 2004 and December 2012 was established, comprising 16 850 subjects from centre A and 23 454 from centre B. Subsequently, the list of subjects was cross-referenced to the Netherlands Cancer Registry to acquire information on lung cancer diagnosis until the end of 2014. A total of 1095 and 2124 subjects were diagnosed with lung cancer at centres A and B, respectively. For this study we only included lung cancer cases who had CT imaging available at least 2 months prior to the date of lung cancer diagnosis. By doing so we excluded prevalent lung cancers, for which imaging did not hold any longitudinal information on nodule evolution and future malignancy risk. The interval of 2 months was chosen arbitrarily to balance between longitudinal information and the remaining study group size.
Using the above-mentioned interval, a total of 228 subjects with lung cancer were included from centre A and 405 subjects from centre B. A nested case–control design was applied using a case–control ratio of approximately 1:3.13 ‘Cases’ were defined as subjects with lung cancer diagnosis, while ‘controls’ were defined as subjects without the diagnosis of lung cancer during follow-up. Controls were randomly selected from the total cohort of subjects without a lung cancer diagnosis and comprised a total of 684 and 1095 subjects for centres A and B, respectively.
Of all included subjects, both cases and controls, CT scans were retrieved from the Picture Archiving and Communication System. In centre A all scans were reconstructed with 1 mm thick slices. In centre B the majority of the scans were reconstructed with 3 mm thick slices. For controls the oldest available CT was collected. For cases all diagnostic CT scans were obtained. Additional exclusions prior to the start of the annotation process were mainly due to retrieval errors and insufficient study quality; in total, an extra 155 cases and 612 controls were excluded. Figure 1 shows the study population selection flow chart.

Flow chart of study population inclusion.
Annotation process
Dedicated inhouse software with computer-aided detection (CAD) of both solid and subsolid pulmonary nodules was used for the annotation process (CIRRUS Lung Screening, DIAG, Nijmegen, The Netherlands). All non-calcified nodules 4 mm or larger were semiautomatically annotated by one observer in each centre (OMM and ETS with 7 and >20 years of experience in chest CT). Scans were excluded if subjects were mechanically ventilated, as were scans in which the observer considered a significant part of the lung not assessable (eg, incomplete data, presence of extensive consolidation and severe breathing artefacts).
Observers were instructed to first go through any CAD candidates. True-positive CAD candidates were accepted and false-positive CAD candidates were removed. Subsequently, each scan was visually checked for additional nodules primarily missed by the CAD. Effective nodule diameter and nodule volume were measured semiautomatically using different thresholds for non-solid and solid nodule components. Nodule type (solid, part-solid or non-solid), spiculation (yes/no) and affected lobe were recorded per nodule. In all scans, the presence of emphysema was visually assessed (yes/no).
In the group with lung cancer confirmed by the National Cancer Registry, the date of diagnosis (incidence date) as well as the affected lobe were available. We aimed at identifying each malignancy in the available CT data sets by linking all nodules in the affected lobe across all follow-up scans, assessing nodule morphology and growth pattern. For evaluation in this study, we used the oldest available CT scan on which the lesion was visible. A score of 0–4 was applied to rate the degree of certainty of the above-mentioned process. A score of 0 referred to no visible lesion in the tumour-bearing lobe. A score of 1 referred to a nodule in the tumour-bearing lobe without any signs of malignancy (ie, highly unlikely to represent the cancer). A score of 2 referred to an equivocal lesion in the tumour-bearing lobe (ie, no decision possible). A score of 3 referred to a suspicious lesion in the tumour-bearing lobe, but there was no CT scan within 1 month of the incidence date available for definite confirmation (ie, lesion highly likely to represent the lung cancer). A score of 4 referred to a suspicious lesion in the correct lobe and an available CT scan within 1 month of the incidence date (ie, confirmation of the lung cancer). Lesions with a score of 0, 1 or 2 were excluded. Hence, only scores of 3 and 4 lesions were included in our analysis, as these were considered to irrefutably represent lung cancers.
In controls, nodules were annotated on the oldest CT scan. All nodules—irrespective of being solitary or multiple per scan—were included in the analysis.
Statistical analysis
The original Brock publication calculated four models using different sets of input criteria. In the present study the two models that included spiculation as variable were applied to the subjects of centres A and B separately, that is, the full (2b) and parsimonious (1b) Brock model.8
According to standard nested case–control analysis,13 14 the randomly selected subsets of controls were inflated to simulate a full cohort, resulting in 11 770 and 12 779 subjects, respectively. Family history was not known in our study population due to the retrospective study design and was set to 0.
For both validation cohorts discriminative performance of the Brock model was assessed using receiver operating characteristic (ROC) analysis, resulting in AUCs as a performance indicator. A third simple logistic regression model was applied using only nodule size as predictor of lung cancer risk. Differences in discriminative performance were tested between the three models by AUC comparison according to DeLong et al.15 Sensitivity, specificity, positive predictive value (PPV) and negative predictive value (NPV) were calculated at a threshold of 10% malignancy risk, the threshold used in the BTS guideline flow chart to select pulmonary nodules for more intense diagnostic work-up. In addition we determined performance at the optimal threshold of the ROC curve (ie, the point on the ROC curve closest to the point where sensitivity and specificity equal 100%). For comparison, we report performance of the size-only model at the specificity achieved by the full Brock model at a risk threshold of 10%.
Results
Subject and nodule characteristics
In total, 441 nodules were given a malignancy score of 3 or 4 (177 in centre A and 264 in centre B). A total of 1405 benign nodules (695 in centre A and 710 in centre B) were found in controls, with a median follow-up of 70 months and 76 months, respectively. For cases, the median time between the annotated CT and incidence date was 4 months and 2 months for centres A and B, respectively.
On average, cases were older than controls. The majority of benign and malignant nodules were solid (83%–88%). Malignant nodules were larger than benign lesions, were more likely to be located in the upper lobes and were more often spiculated. In centre A, a higher prevalence of women was seen (50% vs 41%, compared with centre B), as well as a higher prevalence of emphysema (66% vs 44%). Table 1 lists the study population characteristics for the two centres.
Subject and nodule characteristics
Validation of the Brock model
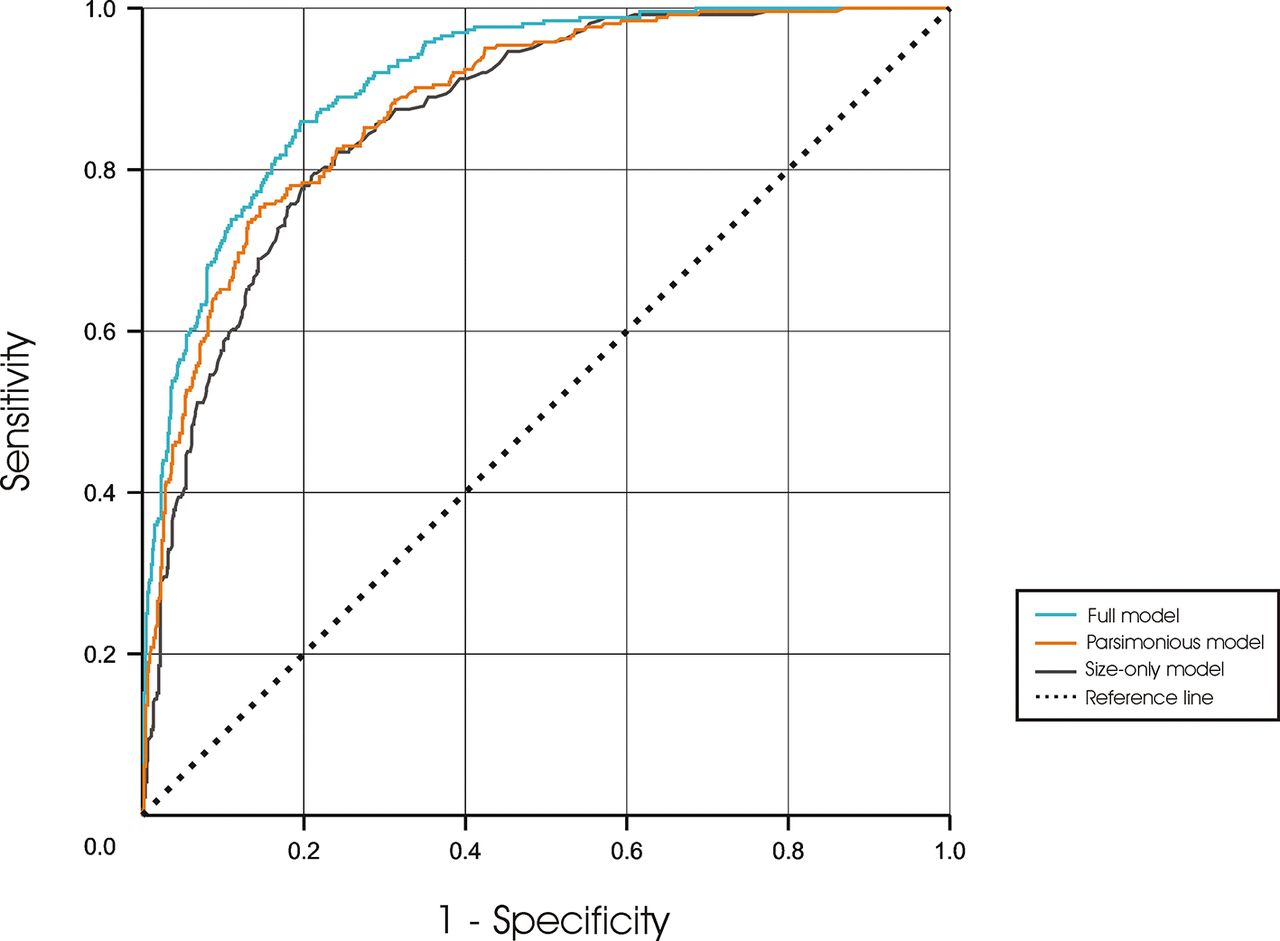
The AUCs of the full Brock model were 0.901 and 0.911, respectively. This significantly exceeded the parsimonious model: 0.894 and 0.881, respectively (p<0.05) (figures 2 and 3). At a 10% malignancy risk threshold, sensitivity per centre was 75% and 81% (PPV=10% and 14%), and specificity was 86% and 84% (NPV=99% and 99%). The optimal threshold was 6.0% in centre A (sensitivity of 84% and specificity of 80%) and 8.2% in centre B (sensitivity of 86% and specificity of 80%).

Receiver operating characteristic (ROC) curve of the Brock validation in centre A for the full and parsimonious Brock model (p=0.03), as well as the size-only model (p<0.001 compared with both full and parsimonious).
Receiver operating characteristic curve of the Brock validation in centre B for the full and parsimonious Brock model (p<0.001), as well as the size-only model (p<0.001 compared with both full and parsimonious).
When using only size to predict the lung cancer risk, an AUC of 0.876 and 0.866 was found for centre A and centre B, respectively. These AUCs were significantly lower (p<0.001) compared with both the full and the parsimonious models (figures 2 and 3). Discriminatory performance is summarised in table 2.
Brock model performance in centres A and B
Discussion
In the past few years, a lot of attention has been paid to optimising the management of screen-detected pulmonary nodules, motivated by the reduction of lung cancer mortality found in the National Lung Screening Trial (NLST).16 Especially in a screening setting where the majority of nodules seen on CT are in fact benign, patient management should be personalised using individual nodule risk estimations to save radiation, workload, unnecessary psychological stress and financial expenses.
The same is also true for routine clinical care, because of the increasing use of CT and related increase in the number of incidentally detected pulmonary nodules, and because of the increase in shared decision making by patients and clinicians.17 18 Pooling the results of several studies reported a mean nodule prevalence of 13% for incidental nodules compared with 33% for screen-detected nodules with a comparable lung cancer prevalence of 1.5% and 1.4%, respectively.3 Although the reported prevalence of nodules is smaller in a clinical context than in screening, the numbers are substantial and represent a significant body of follow-up CTs for eventually benign nodules.
Mathematically validated risk calculators could be used to help guide the management of pulmonary nodules. The Brock model, developed by McWilliams et al,8 has demonstrated an excellent capacity to discriminate between benign and malignant in screen-detected nodules, and its use is incorporated in nodule management guidelines for both screening and clinical use,1 3 despite validation in clinical subjects was until now only performed once in a small single-centre study.12
In this study, we validated the Brock model outside a screening setting, using a large clinical data set from two academic centres. In our unselected and heterogeneous population—even without the restrictions of the Brock model exclusion criteria (eg, previous lung cancer or certain comorbidities)—the model achieved AUCs greater than 0.90 in both data sets. This shows that the malignancy risk calculator is also applicable for incidentally found nodules in daily routine clinical care, although the performance is somewhat lower than in a screening setting.
Previously, the Brock model was externally validated on screening data from the Danish Lung Cancer Screening Trial and the NLST, showing AUCs ranging between 0.826 and 0.963.9 10 White et al 10 found the threshold of 10% malignancy risk to be optimal, with corresponding sensitivity, specificity, PPV and NPV of 85.3%, 93.9%, 27.4% and 99.6%, respectively. We found similarly high results for the NPV (99%), indicating that a risk score <10% reliably indicates that a nodule is benign. However, the sensitivities (75% and 81% vs 85.3%), specificities (86% and 84% vs 93.3%) and PPVs (10% and 14% vs 27.4%) in our clinical cohorts were inferior, emphasising the different characteristics and challenges of a clinical population compared with a more homogeneous screening population.
Recently, the Brock model was validated on a clinical UK population.12 The AUC obtained was 0.90 in a restricted single-centre cohort (n=154) after applying the same exclusion criteria used in the Brock study. Results were worse (AUC=0.868) when the model was validated on the full cohort (n=244). In our study, we did not apply any exclusion criteria besides image quality issues and age below 40 years. Moreover, we included all nodule types, while pure ground-glass nodules were excluded in the UK study.12
It has to be emphasised that the model achieved similar results in both validation cohorts of our study, despite the CT data being reconstructed with 1 mm thick slices in centre A and mostly 3 mm thick slices in centre B, which resulted in different spatial resolution and different accuracy for the assessment of nodule type, spiculation and nodule size.
Although significant, the AUCs show relatively small differences (1%–5%), and clinical relevance of these differences therefore has to be interpreted with caution. Still, statistically our study showed that nodule size plays a major role. Although NPV was the same (99%) when compared with the parsimonious and full Brock models at equal specificity, sensitivity of the size-only model was notably lower. This means that a size-only model is well capable of indicating benign nodules based on a small nodule size, but using only nodule size to predict malignancy shows inferior performance.
Our study has a number of limitations. First, data on lung cancer diagnosis were obtained through the National Cancer Registry, but did not include CT data. We therefore had to use the individual lobe location and incidence date to determine the nodule corresponding to the cancer. Only nodules which were assigned a high level of confidence for representing the known lung cancer were included in the study. This may have introduced a small bias towards more obvious malignancies. Second, for the benign nodules we relied on the outcome data that they did not develop into a malignancy over a median follow-up period of 70 and 76 months in centres A and B, respectively. This might have led to some misclassification in non-solid nodules, where development into malignancy might take numerous years.19 However, since the National Cancer Registry archives all malignancies irrespective of hospital in the Netherlands and given that the median follow-up period was relatively long, we consider the outcome data reliable. Third, due to the retrospective nature of this study, certain clinical information of the study population was not available, for example, smoking behaviour, symptoms and family history. However, the only parameter that might have had an impact in our study, since it is included in the Brock model, is family history. Nevertheless, since family history did not belong to the group of important input factors in the original Brock model, we consider its influence on our results to be limited. Last, a certain percentage of controls were excluded, mainly because of image quality issues. This may have led to a selection bias. However, given the unselected heterogeneous data set and randomly selected controls, we consider the effect of little importance.
In conclusion, we are the first to validate the Brock risk prediction model in an unselected, large and heterogeneous multicentre clinical population. Our results indicate that the model has a very high negative predictive capacity outside a screening setting. Furthermore, it mirrors the findings from lung cancer screening literature as having a high discriminatory performance, although somewhat inferior. Therefore, we conclude that the Brock risk prediction model is capable of contributing to a personalised risk-dependent lung nodule management outside a screening setting, in an unselected, heterogeneous clinical population. The assumed extrapolation by the guidelines applying the Brock model in clinical subjects seems legitimate.
Acknowledgments
The authors thank the registration team of the Netherlands Comprehensive Cancer Organisation (IKNL) for the collection of data for the Netherlands Cancer Registry, as well as the IKNL staff for scientific advice.
References
Footnotes
Contributors Conception or design of the work: KC, OMM, BvG, MP, PAdJ, CMS-P. Data collection: KC, OMM, PKG, CJ, ETS. Data analysis and interpretation: KC, OMM, AMdH. Drafting the article: KC, OMM, CMS-P. Critical revision of the article: KC, OMM, PKG, CJ, AMdH, ETS, MP, PAdJ, BvG, CMS-P. Final approval of the version to be published: KC, OMM, PKG, CJ, AMdH, ETS, MP, PAdJ, BvG, CMS-P.
Funding This research is funded by a grant from the Dutch Cancer Society (project no KUN 2013−6110).
Competing interests None declared.
Patient consent Not required.
Provenance and peer review Not commissioned; externally peer reviewed.
Linked Articles
- Airwaves