Article Text

Abstract
Introduction Targeted testing and treatment of latent TB infection (LTBI) are priorities on the global health agenda, but LTBI management remains challenging. We aimed to evaluate the prognostic value of the QuantiFERON TB-Gold (QFT) test for incident TB, focusing on the interferon (IFN)-γ level, when applied in routine practice in a low TB incidence setting.
Methods In this large population-based prospective cohort, we linked QFT results in Norway (1 January 2009–30 June 2014) with national registry data (Norwegian Surveillance System for Infectious Diseases, Norwegian Prescription Database, Norwegian Patient Registry and Statistics Norway) to assess the prognostic value of QFT for incident TB. Participants were followed until 30 June 2016. We used restricted cubic splines to model non-linear relationships between IFN-γ levels and TB, and applied these findings to a competing risk model.
Results The prospective analyses included 50 389 QFT results from 44 875 individuals, of whom 257 developed TB. Overall, 22% (n=9878) of QFT results were positive. TB risk increased with the IFN-γ level until a plateau level, above which further increase was not associated with additional prognostic information. The HRs for TB were 8.8 (95% CI 4.7 to 16.5), 19.2 (95% CI 11.6 to 31.6) and 31.3 (95% CI 19.8 to 49.5) times higher with IFN-γ levels of 0.35 to <1.00, 1.00 to <4.00 and >4.00 IU/mL, respectively, compared with negative tests (<0.35 IU/mL).
Conclusions Consistently, QFT demonstrates increased risk of incident TB with rising IFN-γ concentrations, indicating that IFN-γ levels may be used to guide targeted treatment of LTBI.
- quantiFERON TB-Gold
- interferon-gamma release assay
- latent tuberculosis
- tuberculosis
Statistics from Altmetric.com
Key messages
What is the key question?
Does stratification by level of interferon (IFN)-γ measured by QuantiFERON TB-Gold add prognostic value when assessing risk of incident TB?
What is the bottom line?
In this largest cohort to date, we found that higher levels of IFN-γ were associated with consistently greater risk of incident TB.
Why read on?
Our findings indicate that IFN-γ levels may be used to guide targeted treatment of latent TB infection.
Introduction
Targeted testing and treatment of latent TB infection (LTBI) are important components of WHO’s End TB strategy in low-incidence countries.1–3 The overall TB incidence rate (IR) in Norway is 6 per 100 000 population per year.4 Foreign-born individuals account for almost 90% of TB notifications and carry an almost 70-fold higher risk of TB IR (42/100 000) compared with the Norwegian-born population, in which the TB IR (0.6/100 000) has reached the pre-elimination phase.4 Although sporadic outbreaks occur, routine molecular surveillance for Mycobacterium tuberculosis strains confirms the overall low TB transmission rate.4 Against this backdrop, screening and preventive treatment of LTBI has gained high priority in Norwegian TB control activities. A well-established, mandatory screening programme for TB and LTBI targets (i) immigrants arriving from countries with high TB incidences, (ii) pre-employment screening in selected groups (healthcare workers and those working with children) and (iii) other groups at increased risk of TB, specifically contacts.
However, LTBI screening and treatment remain challenging, due partly to the suboptimal nature of diagnostic tests.2 The traditional tuberculin skin test (TST) and the more recently introduced interferon gamma release assays (IGRAs) are both indirect markers of TB infection, indicating a cellular immune response to the M tuberculosis complex.2 In 2009, Norway introduced the QuantiFERON TB-Gold (QFT; Qiagen, Hilden, Germany) IGRA as a confirmatory test for use in individuals with TST positivity on routine screening (≥6 mm, obtained with the Mantoux method using purified protein derivate, RT 23, 2 TU; Statens Serum Institute, Copenhagen, Denmark). Initial expectations were high because of improved specificity of QFT compared with the TST as antigens included in the QFT are not encoded in the genome of Mycobacterium bovis (BCG) or most non-tuberculous mycobacterial strains.5 However, several diagnostic challenges remain, including poor reproducibility, definition of a single cut-off value for a positive test and difficulty of interpreting low positive results.2 Furthermore, QFT does not distinguish among the various stages evolving from latent infection to TB disease, or reactivation from reinfection, which renders its prognostic value questionable.2
The aim of this study was to evaluate the prognostic value of the QFT for incident TB when applied in routine practice in a low-TB-incidence country. We present data from a large prospective cohort of individuals tested with the QFT. We focused specifically on the interferon (IFN)-γ level and the significance of low positive results.
Methods
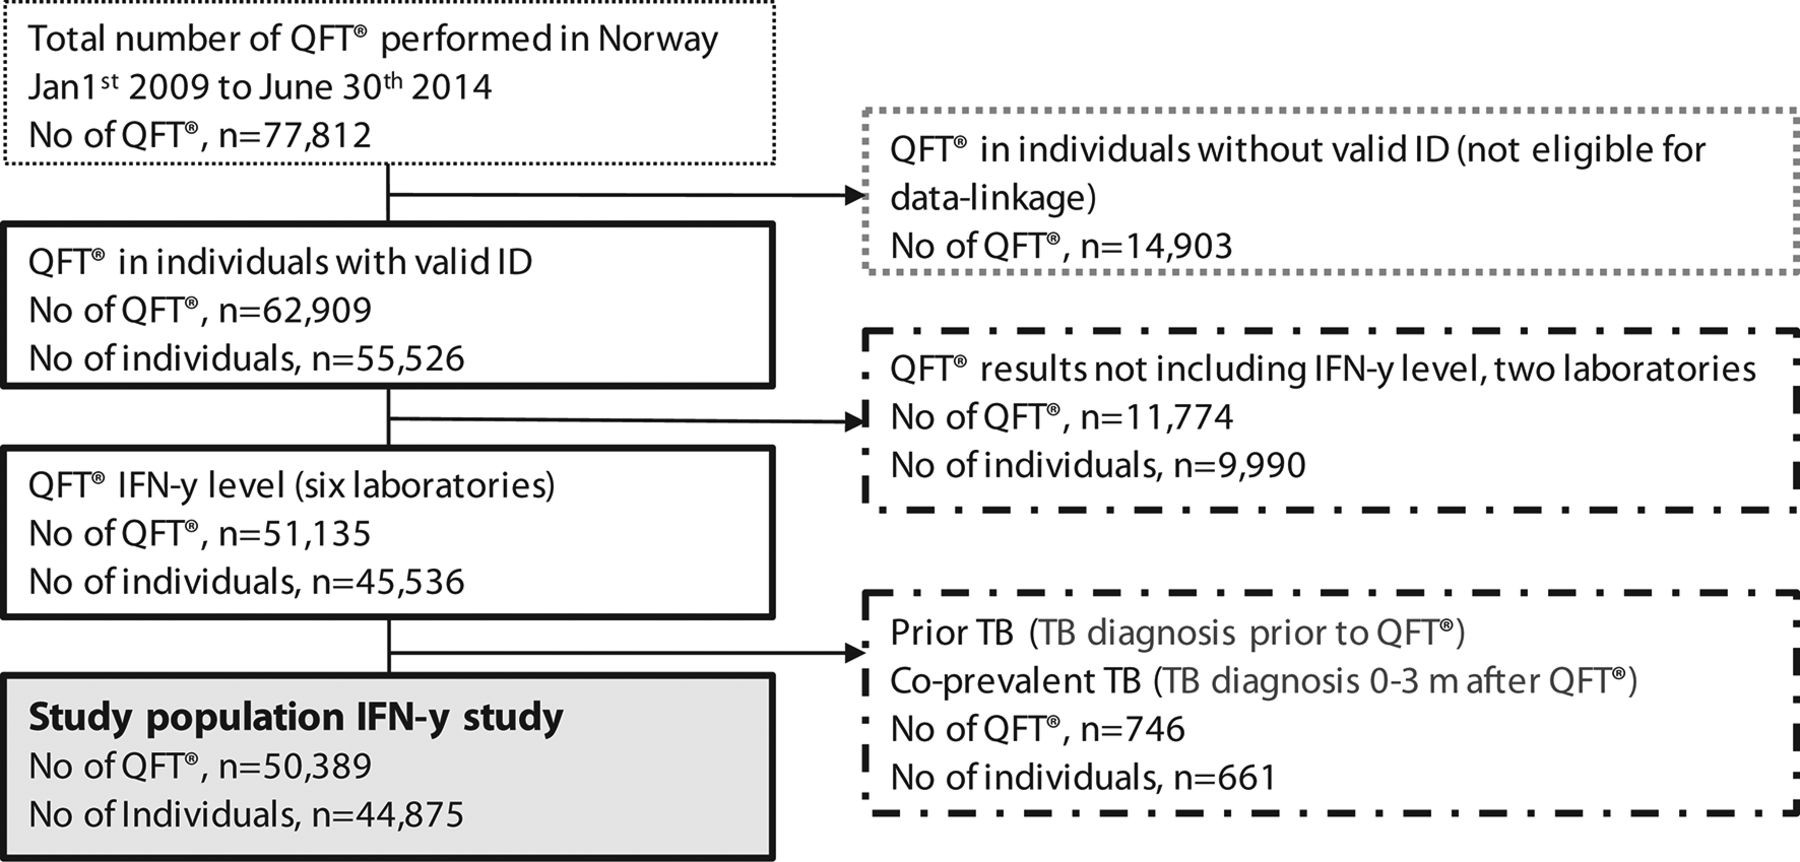
In this nationwide population-based prospective cohort, QFT results were linked with data from high-quality national population-based registers using 11-digit personal identification numbers. All eight laboratories performing the QFT in Norway during the study period (1 January 2009–30 June 2014) provided QFT data. Of 77 812 QFT results provided, 27 423 (35%) were excluded for the following reasons: (i) lack of a valid identification number, preventing linkage to health data (n=14 903); (ii) not possible to extract information electronically on the IFN-γ value from two of the laboratory databases (n=11 774) and (iii) TB diagnosis before or within 3 months after QFT testing (n=746). Thus 50 389 QFT from 44 875 individuals were included for prospective analyses (figure 1).

Study population flow chart. Solid lines: population included in data linkage; stippled lines: population excluded from the interferon-γ (IFN-γ) study; shaded box: population included in the IFN-γ study based on level of IFN-γ IU/mL.
We obtained demographic data from Statistics Norway, TB notifications and prescriptions for LTBI treatment from Norwegian Surveillance System for Infectious Diseases, outpatient drug prescriptions from Norwegian Prescription Registry (NORPD), and hospital discharge data from Norwegian Patient Registry (NPR). Data linkage was last updated in June 2016 (≥2 years after last QFT test).
Data management
We only had data on time of QFT by month and year, and we could not ascertain the chronological order of QFT results in 496 (1.1%) individuals tested twice in the same month and year. Among these, 131 had discordant results. For these individuals, we selected conclusive over inconclusive test results (n=44), and by random order for the remaining (n=87).
Country of birth was dichotomised as Norwegian or foreign. This was not recorded for 445 (1%) individuals, who we designated as foreign-born, assuming that they were recent immigrants.
Classification of underlying diseases and outpatient immunosuppressive treatments was based on International Classification of Diseases (ICD), 10th revision6 or the Norwegian Classification of Medical Procedures (NCMP)6 for data from NPR, and Anatomical Therapeutic Chemical (ATC) codes for data from NORPD7 (online supplementary appendix 1). An underlying disease was included in the analysis as a risk factor when it was first recorded before or at the same time as QFT test, and iatrogenic immunosuppression when at least one prescription (usually covering 3 months of treatment) was registered within 6 months before QFT test. Included risk factors were consistent with those listed in national guidelines.8
Supplemental material
Main outcome and exposure
Incident TB was the main outcome of interest (event). In the main analysis, we defined incident TB as sample collection for TB diagnosis >3 months after QFT testing, in line with previous studies.9 As some cases identified in this manner may represent co-prevalent TB, we conducted a sensitivity analysis with the threshold for incident TB set at 6 months after QFT testing. The main exposure was the IFN-γ level (IU/mL) calculated according to the manufacturer’s recommendations.
Statistical analyses
We used STATA14 for statistical analysis.10 The statistical approach is presented in detail in online supplementary appendix 2. Participants were followed until 30 June 2016. As the TB risk may change over time, and some individuals had more than one QFT, we applied a Cox regression model with time-dependent covariates (for calculating HR) to examine associations between the main outcome and exposure. This involved constructing a row of data for each QFT, from the start of the interval (date of sampling) until the end of the interval (event, censoring or date of sampling for a subsequent test). Covariate values are those that apply over that interval. Using time-varying explanatory variables is more robust than selecting exposures from a single time point as it uses all available data. As underlying disease and immunosuppressive treatment data were correlated strongly, they were combined to form an ‘any medical risk factor’ covariate in the regression analysis. We ran a competing-risks model with emigration, death or preventive treatment of LTBI serving as competing risks.
Splines and categorisation of IFN-γ levels
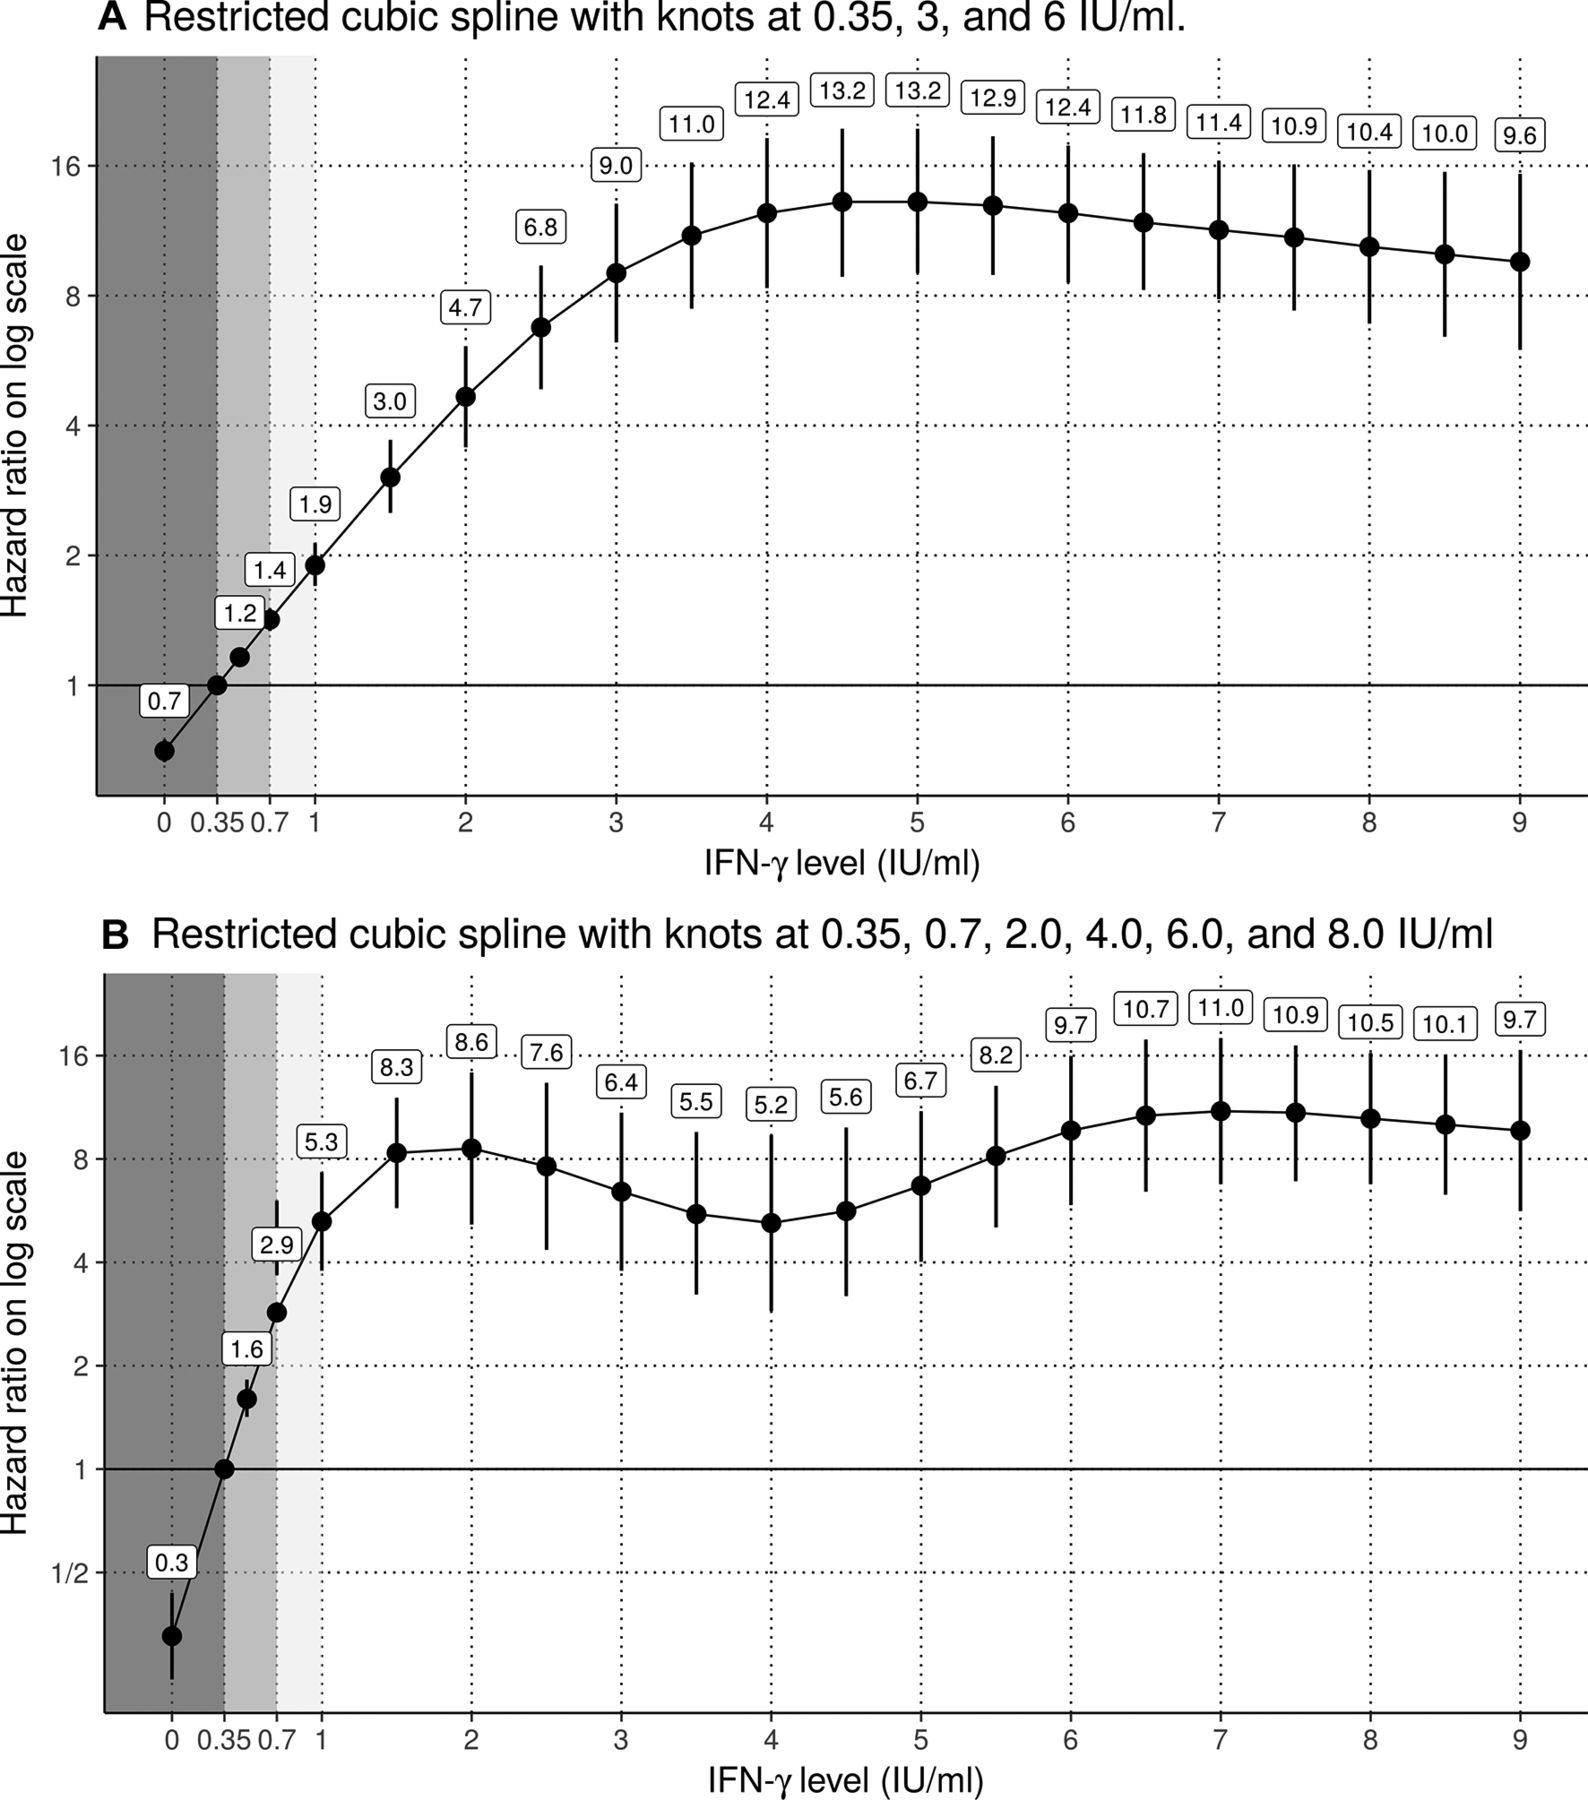
We had a priori information that the association between incident TB and IFN-γ levels was non-linear. Three laboratories reported continuous IFN-γ levels only until 10.0 IU/mL, with ‘≥10.0 IU/mL’ used for higher values. We thus modelled the continuous data using restricted cubic splines to gain insight into appropriate categorisation of the data and to enable usage of all available results. Only tests with IFN-γ levels<10.0 IU/mL were included in the spline models. We ran two regression analyses including origin, age and identified medical risk factors as adjustment variables: one analysis had knots at 0.35, 3.0 and 6.0 IU/mL, and the other had knots at 0.35, 0.7, 2.0, 4.0, 6.0 and 8.0 IU/mL. The lowest knot values (0.35 and 0.7 IU/mL) were selected based on clinicians’ input, and the remaining were based on equal spacing. Figure 2A had higher Akaike information criterion (AIC) than figure 2B, suggesting that figure 2B fits the data better. However, results of both analyses supported the categorisation of IFN-γ levels as negative (<0.35 IU/mL, according to the manufacturer’s cut-off value), low positive (0.35 to <1.0 IU/mL), medium positive (1.0 to <4.0 IU/mL) and high positive (>4.0 IU/mL). We used these categories in all further analyses. We also ran regressions with the outcome restricted to culture confirmed incident TB.

HRs for incident TB by interferon-γ (IFN-γ) level compared with the reference level of 0.35 IU/mL (n=41 533 individuals) for two models with different knot values. Only results with IFN-γ<10.0 IU/mL were included in the models. Grey shaded areas represent negative (<0.35 IU/mL) and low positive (>0.35 to<0.7 IU/mL and >0.7 to<1.0 IU/mL) IFN-γ levels. The model with fewer knots had an Akaike information criterion (AIC) of 3128 and the model with more knots had an AIC of 3103, suggesting that the model with more knots fits the data better.
Effect modification and interaction terms
We investigated whether the association between the IFN-γ level and incident TB was modified by country of origin, age or identified medical risk factor using likelihood ratio tests. We found no significant interactions and thus did not include them in the regression models.
IRs, predictive values and numbers needed to treat (NNT)
We calculated IRs as the numbers of incident TB per 1000 person-years, and negative predictive value (NPV) and positive predictive value (PPV) separately for the first two years and for subsequent years. We also calculated predictive values for two hypothetical non-informative tests, in which we assumed that all test findings were negative (for the hypothetical NPV (hNPV)) and positive (for the hypothetical PPV (hPPV)), respectively. We calculated the average number of LTBI treatments needed to prevent one incident TB by estimating the difference in risk of incident TB among individuals who did not and those who did receive LTBI treatment, NNT=1/(incident TB/number of individuals not receiving LTBI treatment –incident TB/individuals receiving LTBI treatment), with corresponding confidence limits.11 These analyses were performed on the first QFT (also in individuals with several tests) to avoid survival bias. Although treatment for LTBI was accounted for by censoring subjects, this does not account for clinicians selectively treating patients at highest risk. We can therefore interpret our outcome as ‘incident TB if not prevented by LTBI treatment’.
Results
Characteristics of the study population
The analysis included 50 389 QFT results from 44 875 individuals. In total, 40 146 (89%) individuals had one, 4123 (9%) had two and 606 (1%) had three or more QFT tests (range, 1–8).
Table 1 presents the characteristics of the study population. The foreign-born population was younger, included more females, more often underwent the QFT based on primary healthcare screening and was less likely to have immunosuppressive conditions compared with the Norwegian-born population.
Characteristics of the population included in prospective analyses at the time of QuantiFERON-TB Gold (QFT) testing*
In the foreign-born group, 7644 (39%) individuals were born in countries with WHO-estimated TB IRs>200 per 100 000 population.12
Among the 17 103 (38%) individuals with at least one identified medical risk factor, 6600 (39%) had records of underlying disease and immunosuppressive treatment, 10 158 (59%) had records of underlying disease only and 345 (2%) had records of immunosuppressive treatment only. Diagnoses relevant to DMARD treatment dominated medical risk factors.
QFT results and incident TB
Overall, 22% (n=9878) individuals had positive, 76% (n=34 128) had negative and 2% (n=869) had inconclusive QFT results (based on the first result in individuals with multiple tests). Among individuals with positive QFT results, 2166 (22%) had IFN-γ levels<1.00 IU/mL, of whom 1476 (68%) had levels<0.7 IU/mL. Among individuals with an inconclusive first QFT result, 303 (35%) were retested. Among them 249 (82%) yielded a conclusive result in which a majority were reported negative (n=222).
Incident TB was reported in 257 individuals (foreign-born, n=229 (89%); Norwegian-born, n=28 (11%)). A total of 155 (60%) cases were confirmed by culture, of whom 86 (55%) were pulmonary TB. The median time from QFT test to TB diagnosis was 9 months (IQR 5–19). Incident TB occurred in 219 (2.2%) individuals with QFT positivity, 33 (0.1%) individuals with QFT negativity and 5 (0.6%) individuals with inconclusive results. Also, 14 of the 33 individuals with negative QFT results and 3 of the 5 individuals with inconclusive QFT results showed positivity on subsequent tests. Results of the sensitivity analysis for incident TB are presented in online supplementary appendix 3. Although the use of a 6-month threshold reduced the number of incident TB cases, associations between the main outcome and exposures were not affected.
HRs for incident TB
Figure 2 shows HRs for incident TB by IFN-γ level separately for the two linear spline functions. Curve smoothing is greater for the three-knot spline (figure 2A) than for the six-knot spline (figure 2B), indicating that the latter captured more of the underlying variability. The HRs for incident TB increased with the IFN-γ level up to 1.00–4.00 IU/mL, and then levelled off. Increases in the IFN-γ level above this point added little prognostic information to the HRs for incident TB. The model with fewer knots had an AIC of 3128, and the model with more knots had an AIC of 3103, suggesting that the model with more knots fits the data better. Restricting the analysis to culture confirmed incident TB showed similar figures, although with wider confidence limits (online supplementary appendix 4)
Table 2 presents HRs from multivariable time-dependent Cox regression analysis for incident TB by IFN-γ level category, country of origin and age. After the exclusion of individuals with inconclusive QFT (n=869, of whom five had incident TB), the analyses included 48 121 QFT results from 44 006 individuals. The HRs for TB were 8.8 (95% CI 4.7 to 16.5), 19.2 (95% CI 11.6 to 31.6) and 31.3 (95% CI 19.8 to 49.5) times higher in the low, medium and high IFN-γ-positive categories, respectively, compared with a negative test.
Foreign-born status and age <35 years were associated significantly with incident TB, regardless of IFN-γ level; no such association was found for the presence of at least one medical risk factor.
Univariate and multivariable time-dependent Cox regression results for incident TB (n=252) by interferon-γ (IFN-γ) level, age group, country of origin and medical risk factors (n=48 121) QuantiFERON TB Gold (QFT) results for 44 006 individuals
TB IRs, incidence rate ratios (IRRs) and predictive values
The overall rate of incident TB in the study population was 1.52 per 1000 person-years. TB IRs varied greatly depending on QFT results, time since testing, age and country of origin (table 3). Eighty per cent (n=205) of incident TB cases occurred within 2 years after QFT testing, with corresponding higher IRs (definers) for TB in this period compared with the subsequent period in all groups. The IRR (definer) for incident TB following a positive QFT result was 4.4 when comparing the first two years with subsequent years. IRs increased with the IFN-γ-level category.
Incidence rates (IRs//1000 person-years) and predictive values for incident TB from the time of QuantiFERON TB-Gold (QFT) testing, by observation time (</>2 years) and interferon-γ (IFN-γ) category*
IRs following QFT positivity varied by age. Few incident TB events occurred in the youngest and oldest age groups. PPVs varied, but were low in all groups (0.1%–4.5%), and NPVs were high (>99%; table 3). The QFT added very little predictive value compared with the hypothetical non-informative test in this population.
Number needed to treat
Four foreign-born adults developed TB disease after LTBI treatment (10 months, 2.5 years, 4.9 years and 5.1 years). The NNT decreased substantially with higher IFN-γ categories (table 4). The NNT were overall higher in the Norwegian-born compared with the foreign-born except in the high IFN-γ category.
The average number of latent TB infection (LTBI) treatments needed to prevent one incident TB by result of QuantiFERON TB Gold (n=44 875)
Competing risks
Thirteen per cent (n=5745) of individuals (18% (n=3465) foreign-born, 9% (n=2280) Norwegian-born) were censored due to non-event occurrence during the study period. Among censored foreign-born individuals, 1849 (54%) received LTBI treatment, 283 (8%) died and 1333 (38%) emigrated. Among censored Norwegian-born individuals, 593 (26%) received LTBI treatment, 1578 (69%) died and 109 (5%) emigrated.
Discussion
Using a large population-based prospective cohort of individuals with QFT results linked to demographic and health registry data, we explored the prognostic value of the QFT in a low-TB-incidence country. HRs for incident TB increased with IFN-γ levels until a plateau of 1.0–4.0 IU/mL, above which further increase was not associated with additional prognostic information. Consistently, in all analyses and across subgroups, individuals in higher IFN-γ categories were more likely than those with low positive levels to develop incident TB. This observation was supported by the results of sensitivity analyses based on a 6-month cut-off for incident TB and when restricting the outcome to TB confirmed by culture. Our main findings were clinically significant (HRs >8) and are therefore not statistical artefacts. The high number of individuals with a final inconclusive QFT was surprising and may reflect that clinicians may have decided to base their follow-up on the result of a TST-result, rather than an inconclusive QFT.
Associations between IFN-γ levels and incident TB
Some authors,9 13–16 but not others,15 have reported increased risks of subsequent TB with higher mean IFN-γ levels. Substantial overlap in IFN-γ levels between individuals with incident TB and those who remain healthy yields low prognostic accuracy. In contrast to the TST, for which cut-off levels differ among risk groups, a single cut-off level is used to define QFT positivity. The manufacturer’s cut-off level at 0.35 IU/mL was established to maximise sensitivity and specificity and was based on a relatively small study including 118 patients with culture confirmed TB and 216 healthy controls.17 Interestingly, the same study group later suggested to lower the cut-off for immunosuppressed groups and increase it for low-risk immunocompetent individuals.18
A considerable number of reversions from marginal QFT positivity to negativity have been reported.19 In a systematic review examining the reproducibility of IGRA findings based on second samples obtained from individuals within 4 weeks after first sample collection, 57% of subjects (primarily healthcare workers undergoing screening) with baseline IFN-γ levels of 0.35–0.8 IU/mL showed reversion.18 In the current study, almost one in four individuals with QFT positivity had IFN-γ levels<1.0 IU/mL. This finding adds fuel to the debate on whether low positive results should be reported as borderline (‘grey zone’) to inform clinicians about the lower confidence in the test result. Also, discussions are ongoing regarding whether ‘retesting zones’ should be recommended or if cut-offs should differ based on background risk.20 21 Furthermore, the QFT is unlikely to distinguish infections that have cleared.22 Our data suggest that a medium or high positive result adds confidence to an LTBI diagnosis relative to a low positive level in an immunocompetent individual, comparable to results reported for the TST. Interestingly, consistent with our QFT results, a similar increased risk of incident TB has been observed with higher TST indurations.23 24 In a large population-based study in Canada, higher TB IRs were observed with TST indurations>15 mm compared with TST 10–14 mm or 5–9 mm for both close and casual contacts.23 24
However, as both tests are based on immune response, the results must be interpreted with caution in immunosuppressed individuals—who are more likely to test negative or low positive, despite being at greater risk of incident TB.2
The prognostic value of the QFT
Our findings confirm previous reports of the low prognostic value of QFT for subsequent TB in a low-incidence setting.2 25–27 The TB IR of 11.1/1000 person-years in QFT-positive individuals in the current study is in the lower range of IRs reported in previous meta-analyses (4–4827 and 3.7–84.52/1000 person-years in IGRA-positive individuals), and higher than in a recent Danish population-based study (3.8/1000 person-years).9 The NNT in QFT positivity was similar to a European study on TB contacts,15 but lower than reported in the Danish study.9 28
The overall PPV of 2.2% from the full study period was comparable to the 1.9%15and 1.32%9 reported from other low-incidence countries, and lower than the pooled PPV of 2.7% reported in a meta-analysis.29 Direct comparison is difficult, given differences in study designs, populations and follow-up periods. The highest PPVs have been obtained in studies of TB contacts (2.4%–28.6%)13 30 and immunocompromised individuals (7%–8%).31 Reported PPVs are probably underestimated since follow-up is restricted and incident TB may occur over a lifetime. The NNT may be overestimated for the same reason. The large number of test positive individuals not starting LTBI treatment is of concern. A previous Norwegian study found poor information flow of screening results from immigrant arrival screening which may contribute to the findings.32 Norwegian guidelines recommend treatment in high-risk QFT positive individuals and conditionally recommends LTBI treatment in healthy low-risk individuals. Individuals who do not start treatment should be informed about LTBI and common TB symptoms for early case detection and should preferably be scheduled for follow-up visits. This study is one of several ongoing projects in Norway aiming to address this concern.
Predictive values depend greatly on the prevalence of the condition in the population to which they are applied. In our study, the QFT added very little predictive information to that provided by the hypothetical tests due to the low TB prevalence compared with the large number of tests. A large proportion of the Norwegian-born group was tested prior to DMARD treatment. In this group, the pre-test probability of LTBI is low and positive results likely represents remote infection. As the overall lifetime risk of progression from LTBI to TB is low (<5% in healthy populations), high PPVs are very difficult to obtain.2 27 Inversely, NPVs are high in low-risk populations. Thus, the targeting of groups with high TB risk is essential to improve PPVs. A new-generation QFT (QuantiFERON TB Gold Plus) has recently been developed and has the capacity to detect a larger proportion of CD8 +T cell responses.33 34 Although this new test has been assessed in several studies,35–38 no strong evidence of superior performance compared with the QFT has been produced to date.39 The prognostic value of the QFT Plus needs to be studied prospectively.
The risk of incident TB following medical risk factors
Although a large proportion (38%) of individuals in this study population had at least one medical risk factor, this characteristic was not associated significantly with incident TB when included in the analysis as a compound risk factor. Possible explanations are (i) the high sensitivity of our definitions of underlying risk, which may have diluted the effects of the most severe immunosuppressive conditions; (ii) the difficulty of estimating levels of immunosuppression from register data and (iii) the likely moderate to low immunosuppressive effects of most risk factors. To this point, the majority (94%) of HIV-positive individuals were receiving antiretroviral treatment. Factors currently used to identify risk of progression to disease have, with few exceptions, relatively weak impacts and are insufficient to be drivers of the transition towards disease.40 41
Strengths and limitations
The main strengths of our study are the population-based prospective design, large sample with nationwide coverage, long follow-up time and standardised information with a high degree of completeness in the cohort. Furthermore, we applied comprehensive statistics to correct for competing risks for the main outcome, time-varying factors and repeated QFT testing.
The main limitations include the ineligibility of many recent immigrants (primarily asylum seekers), who had not yet been provided with valid identification numbers, preventing data linkage. Their risk profiles may differ due to the emigration process. Representativeness is crucial for prevalence estimates, but may be less essential for association estimates.42 Therefore, we believe that we may cautiously generalise the associations found in this study to the broader population.
Information on the indication for the QFT test was not available. This information would be useful for improved targeting of risk groups. We do not know the extent to which the QFT was performed subsequently to positive TST findings, as per the guidelines during the study period. However, we believe that the guidelines for screening in primary healthcare were routinely followed. The percentage of positive QFT results among those tested after TST positivity will be higher than in studies in which the QFT was the initial test. However, associations between QFT results and incident TB may be less affected due to the comparable sensitivity (80%) of the two tests.2 The large number of negative QFT results may reflect the superior specificity of the QFT compared with the TST (94% vs 88.7%).2 43
The broad classification of immunosuppressive risk may have diluted the effects of the most severe risk factors and overestimated others. Furthermore, the probability of immigrants having health information captured in a national registry may differ based on the time spent in Norway. Thus, underestimation and overestimation of the prevalence of underlying risk factors in this study is possible.
Public health implications
The overall low ability of the QFT to predict incident TB is of concern.15 28 Whereas QFT negativity provides confidence of low TB risk, the interpretation of a low positive result is less straightforward. Our results, which consistently showed greater risk of incident TB in higher positive IFN-γ categories, may aid the targeting of individuals for preventive treatment. Targeting individuals in higher IFN-γ categories will significantly reduce the NNT to prevent one incident TB. This raises the question of whether separate cut-off values based on background risk could be useful. Furthermore, since the majority of incident TB events occurred the first two years after QFT testing, timely follow-up of test results is necessary to prevent incident TB.15 28
We fully support ongoing collaborative initiatives to develop novel tests that may better distinguish different phases in the LTBI spectrum and improve the prognostic value of LTBI diagnosis. Meanwhile, TB control programmes need to target individuals considered to be at greatest risk of progression to TB.
Acknowledgments
The authors thank the Norwegian Health Association for their support and for funding the study and Dr Einar Heldal for support and input. They also thank Johanne Haugen at Innlandet Hospital Trust, Lillehammer for contributions to the Norwegian IGRA study group.
Data from Norwegian Patient Register at the Norwegian Directorate of Health, Norwegian Prescription Database and Norwegian Surveillance System for Infectious Diseases at the Norwegian Institute of Public Health, and Statistics Norway were used for this publication.
References
Footnotes
Contributors All authors were involved in planning of the study. BAW initiated the study. BAW and RW were responsible for data-management, statistical analysis and for drafting the manuscript, HS, DHS, EKH, NH, GSS, JEA and AMBK provided and cleaned QFT data for the study, HSB and ABB were responsible for classification of medical risk factors, BAW, RW, ABB, HSB, HS, DHS ATM, FO and AMBK were involved in the writing process. All authors have reviewed and approved the final version of the manuscript.
Funding This study was funded by the Norwegian Health Association.
Disclaimer The interpretation and reporting of these data are the sole responsibility of the authors, and no endorsement by the registries is intended or should be inferred.
Competing interests None declared.
Patient consent Detail has been removed from this case description/these case descriptions to ensure anonymity. The editors and reviewers have seen the detailed information available and are satisfied that the information backs up the case the authors are making.
Ethics approval The Norwegian Data Protection Authority (14/01138) and the Regional Committee for Medical Research Ethics (2014/1202) approved the study. An external partner deidentified data before the researchers were given access to it.
Provenance and peer review Not commissioned; externally peer reviewed.