Article Text

Abstract
Rationale Asthma is characterised by inflammation and reversible airway obstruction. However, these features are not always closely related. Fluctuations of daily lung function contain information on asthma phenotypes, exacerbation risk and response to long-acting β-agonists.
Objectives In search of subgroups of asthmatic participants with specific lung functional features, we developed and validated a novel clustering approach to asthma phenotyping, which exploits the information contained within the fluctuating behaviour of twice-daily lung function measurements.
Methods Forced expiratory volume during the first second (FEV1) and peak expiratory flow (PEF) were prospectively measured over 4 weeks in 696 healthy and asthmatic school children (Protection Against Allergy – Study in Rural Environments (PASTURE)/EFRAIM cohort), and over 1 year in 138 asthmatic adults with mild-to-moderate or severe asthma (Pan-European Longitudinal Assessment of Clinical Course and BIOmarkers in Severe Chronic AIRway Disease (BIOAIR) cohort). Using enrichment analysis, we explored whether the method identifies clinically meaningful, distinct clusters of participants with different lung functional fluctuation patterns.
Measurements and main results In the PASTURE/EFRAIM dataset, we found four distinct clusters. Two clusters were enriched in children with well-known clinical characteristics of asthma. In cluster 3, children from a farming environment predominated, whereas cluster 4 mainly consisted of healthy controls. About 79% of cluster 3 carried the asthma-risk allele rs7216389 of the 17q21 locus. In the BIOAIR dataset, we found two distinct clusters clearly discriminating between individuals with mild-to-moderate and severe asthma.
Conclusions Our method identified dynamic functional asthma and healthy phenotypes, partly independent of atopy and inflammation but related to genetic markers on the 17q21 locus. The method can be used for disease phenotyping and possibly endotyping. It may identify participants with specific functional abnormalities, potentially needing a different therapeutic approach.
- asthma
- asthma mechanisms
- lung physiology
- paediatric asthma
- respiratory measurement
- not applicable
Statistics from Altmetric.com
Key messages
What is the key question?
Using a novel approach to asthma phenotyping based on clustering of daily lung function fluctuations, we aim to determine whether we can identify asthma patients with specific functional characteristics in response to the time-varying stimuli of the environment to which they are exposed.
What is the bottom line?
Lung function fluctuations reveal asthma phenotypes that are partly independent of the inflammatory disease process but strongly related to airway mechanics and bronchodilator response.
Why read on?
This novel, fluctuation-based clustering technique may help identify asthmatics with functional abnormalities, potentially benefitting from alternative therapeutic schemata, rather than anti-inflammatory treatment only.
Introduction
Approaches to identifying phenotypes or endotypes in asthma have become increasingly relevant.1–7 Cluster analysis using clinical, atopic, and inflammatory biomarkers has facilitated phenotyping in selected cross-sectional asthma studies.8–12 However, in the majority of published approaches, the characterising parameters are only assessed at a single point in time,8–18 yielding phenotypes that might not remain stable as time progresses.19 Furthermore, most studies using clustering methods are based on predefined biomarkers that are often only loosely correlated with temporal changes in clinical symptoms or lung function. In addition, as opposed to atopy and inflammation, airway dynamics have been neglected as a characterising entity of asthma.20 Indeed, in asthma, both airway inflammation and variable airway obstruction are key components of this chronic disease. While airway inflammation and airway obstruction are often related, there are also mechanisms leading to lung functional abnormalities and asthma symptoms partly independent of airway inflammation but related to genetic factors, obesity, airway structure, and shear stress phenomena.20–22
There is recent evidence of daily fluctuations in inflammatory markers such as eosinophil counts,23 exhaled nitric oxide24 and, in particular, lung function.25 The fluctuation behaviour of lung function contains unexpected amounts of information on asthma characteristics such as airway obstruction and may provide more accurate clues regarding phenotype stability.20 25–27 Furthermore, time series of daily lung function measurements display non-random fluctuations and long-range correlation properties significantly related to asthma phenotype26 and to exacerbation risk.25 27 In addition, these seem to have predictive power regarding clinical treatment response, for example, to long-acting β-agonists.28
Recent data suggest that in some asthma phenotypes, step-up treatment with long-acting β-agonists is more effective than an increase in anti-inflammatory treatment.29 The results shown in ref. 28 thus suggest that airway function and its interaction with environmental stimuli may characterise a specific asthma phenotype, which could potentially benefit from different therapeutic approaches.29
We hypothesised that we could identify such subgroups of asthmatic participants with specific airway functional response to their time-varying environmental stimuli by investigating the patterns of fluctuation in airway function. Thus, time series fluctuation analysis and clustering methods could be combined, resulting in a novel, data-driven method for lung functional asthma phenotyping. We call this approach fluctuation-based clustering (FBC). It provides a new, complementary dimension for observer-independent asthma phenotyping.
Herein, we aim to determine whether FBC is able to distinguish children with asthma from healthy children. Furthermore, we tested whether different lung functional phenotypes existed within the groups of individuals with asthma and healthy individuals, and whether they were associated with predefined clinical asthma phenotypes, environmental factors, as well as genetic factors and inflammatory biomarkers of asthma. We performed this study prospectively in the Protection Against Allergy – Study in Rural Environments (PASTURE)/EFRAIM cohort of asthmatic and healthy children,30–32 in which serial measurements of twice-daily lung function parameters were obtained within a time window of four consecutive weeks.
The second dataset consisted of twice-daily lung function parameters measured over an entire year in a cohort of mildly/moderately and therapy-resistant, severely asthmatic adults (Pan-European Longitudinal Assessment of Clinical Course and BIOmarkers in Severe Chronic AIRway Disease (BIOAIR) cohort).33 In this second independent dataset, we tested whether FBC could discriminate individuals with mild-to-moderate asthma from individuals with severe asthma. This aim was motivated by our previous observations,26 namely, that severe asthmatics show different lung function fluctuation patterns when compared with individuals with mild-to-moderate asthma, despite large variation and overlap of mean lung function between these two groups. The analysis of the second cohort was mainly done for the purpose of method validation using an additional independent data set and not with the intention of comparing the two cohorts directly.
Methods
Our method, comprehensively described in the online supplementary material (OSM), aims to group or cluster individuals with similar fluctuation patterns in their lung function. To this end, we took into account both the mean lung function during the window of observation and also the magnitude and frequency of the fluctuations around the mean. This was accomplished by looking at each patient’s entire empirical distribution of lung function parameters obtained during the time window of measurement. However, in order to more easily deal with missing measurements, our method does not take into account the chronological order of the measurements. Thereby, the temporal dimension is neglected.
Supplementary file 1
Our cluster construction procedure does not make use of any further clinical parameters but is solely based on either of the two lung function parameters, peak expiratory flow (PEF) and forced expiratory volume during the first second (FEV1). In order to test whether the clusters obtained via FBC indeed grouped together participants who shared meaningful clinical and diagnostic features, we compared the predominant clinical characteristics of patients in the clusters found in the cohort of children with previously published clinical symptoms and asthma phenotypes,15 in particular, with respect to atopic, inflammatory (fraction of exhaled nitric oxide (FeNO)) and genetic markers. Furthermore, in the second cohort of asthmatic adults, we tested whether the clusters found discriminated mild-to-moderate asthma from severe therapy-resistant asthma.
Study design
The current proof of concept study has been prospectively embedded in the PASTURE/EFRAIM cohort. This is a prospective birth cohort study of children from rural areas in five European countries. Its design has been described elsewhere.30 31 34
Furthermore, we also illustrated our methodology using data from the BIOAIR study (ClinicalTrials.gov identifier: NCT00555607). This study was designed to characterise the course of severe chronic airway diseases over time using a multitude of different clinical outcomes. The design has been described in detail elsewhere.33 Both studies were approved by all ethics committees of the corresponding participating study centres.
Study population and definition of clinical phenotypes
Within the PASTURE/EFRAIM cohort, at the age of 6 years, n=799 of n=1133 asthmatic and healthy children were enrolled. A percentage of 51.7 of the children were born in a farming environment. About 8.4% showed symptoms of asthma according to standardised assessments of clinical symptoms.30
Within the BIOAIR study, 169 adults with asthma were screened and classified as either severe asthmatics (n=93) or mild-to-moderate asthmatics (n=76).35 Patients were followed for 12 months with control visits at 4 monthly intervals. The present analysis included 138 patients (76 with severe asthma and 62 with mild-to-moderate asthma).
See tables in the OSM for more details.
Lung function measurements
See Methods, and part 1.2 of OSM for details. Within the PASTURE/EFRAIM cohort, measurements of PEF in L/min and of FEV1 in L were recorded over a 4-week period at study participants’ homes twice-daily (morning and evening). Ideally, this resulted in a total of 56 home measurements per study participant.
Within the BIOAIR study, lung function (PEF in L/min and FEV1 in L) was recorded twice-daily using electronic diaries over a period of 12 consecutive months. Ideally, this resulted in a total of 730 measurements per study participant.
Measured values of PEF and FEV1 were standardised using recently published reference data for spirometry.36
Brief overview of the computational methodology
Two examples from the PASTURE/EFRAIM cohort of morning FEV1 time series are shown in figure 1A. While the mean values of both time series may be nearly the same, important and clinically relevant differences are reflected in the amplitude and frequency of fluctuations around the mean. Such differences become apparent by looking at the distribution of values (figure 1B).

FEV1 values (normalised as described in subsection 2.1 of the online supplementary material) collected in the mornings by two participants during a time window of 4 weeks (PASTURE/EFRAIM cohort). (A) displays the values as time series. Marked differences in the pattern of missing values and in the total length of the time series become apparent. Panel (B) displays the values as histograms, disregarding the chronological order of the data. This representation reveals that both time series share a common mean value. However, the data are distributed very differently, displaying completely different fluctuation patterns. Such differences can be quantified by descriptors such as variance, skewness, kurtosis and higher moments of the distribution. PASTURE, Protection Against Allergy – Study in Rural Environments.
Our method comprises five main steps: (1) First, after quality control, we select a high-quality ‘seeding’ data subset we refer to as the gold standard. The distribution of lung function measurements of a given participant is compared with the distributions of all the other participants. This pair-wise comparison is done using the Earth Mover’s Distance (see OSM). These comparisons yield a collection of distance values for each participant in the cohort, which characterises every participant. We call these collections ‘lung function profiles’. (2) We perform an initial agglomerative hierarchical clustering of the gold standard based on the Euclidean distance between the participants’ lung function profiles. Subsequently, we determine, in a data-driven manner, the tolerable levels of missing values by means of analysing the stability of the clustering of the gold standard upon random data removal. (3) We extend the gold standard by including those participants not exceeding the tolerable levels of missing values. (4) We perform the final clustering of participants, and (5) we evaluate the method by testing whether patients within a given cluster exhibit specific clinical characteristics. This analysis of the resulting clusters, which uses information that was not used to inform the clustering procedure, yields criteria for selecting the number of clusters. (See figure 2 for a schematic representation of the method exemplified on data from the PASTURE/EFRAIM cohort, and figure 3 for steps 1–4.)

Workflow of the method exemplified based on data from the PASTURE/EFRAIM cohort. Blue rectangles: Based on quality and compliance criteria (see Methods section, part 2.1 of online supplementary material), we select a subset of participants with a nearly complete collection of high-quality measurements. This subset is used as our gold standard (size ngs). Pink rectangles: within the gold standard, we calculate the matrix of pairwise distances between all patients’ distributions of lung function measurements. Each row within this matrix constitutes what we call the lung function profile of each patient within the given cohort. We use these profiles as the phenotypic fingerprint of each of these patients within the context of the cohort and perform hierarchical clustering on the rows of the matrix (see also figure 3, panels A and B). On the resulting dendrogram, we then identify potentially suitable clusters (see also figure 3, panel A). In order to include those participants who had more missing values, we analyse the stability of the clusters upon percental data removal (see also figure 3, panel C). This step is what helps determine the maximal number of missing values allowable and enables us to extend the gold standard to a possibly larger subset of the cohort (size ntolerable). Green rectangles: for this extended selection of participants, the aforementioned matrix is again calculated, and a final dendrogram is obtained on the basis of hierarchical clustering of the matrix rows (see also figure 3, panel D). Red rectangle: we evaluate the method by testing whether the clusters found are significantly enriched in clinical phenotypes or characteristics of interest. More details on each step can be found in the Methods section and in the OSM. PASTURE, Protection Against Allergy – Study in Rural Environments.
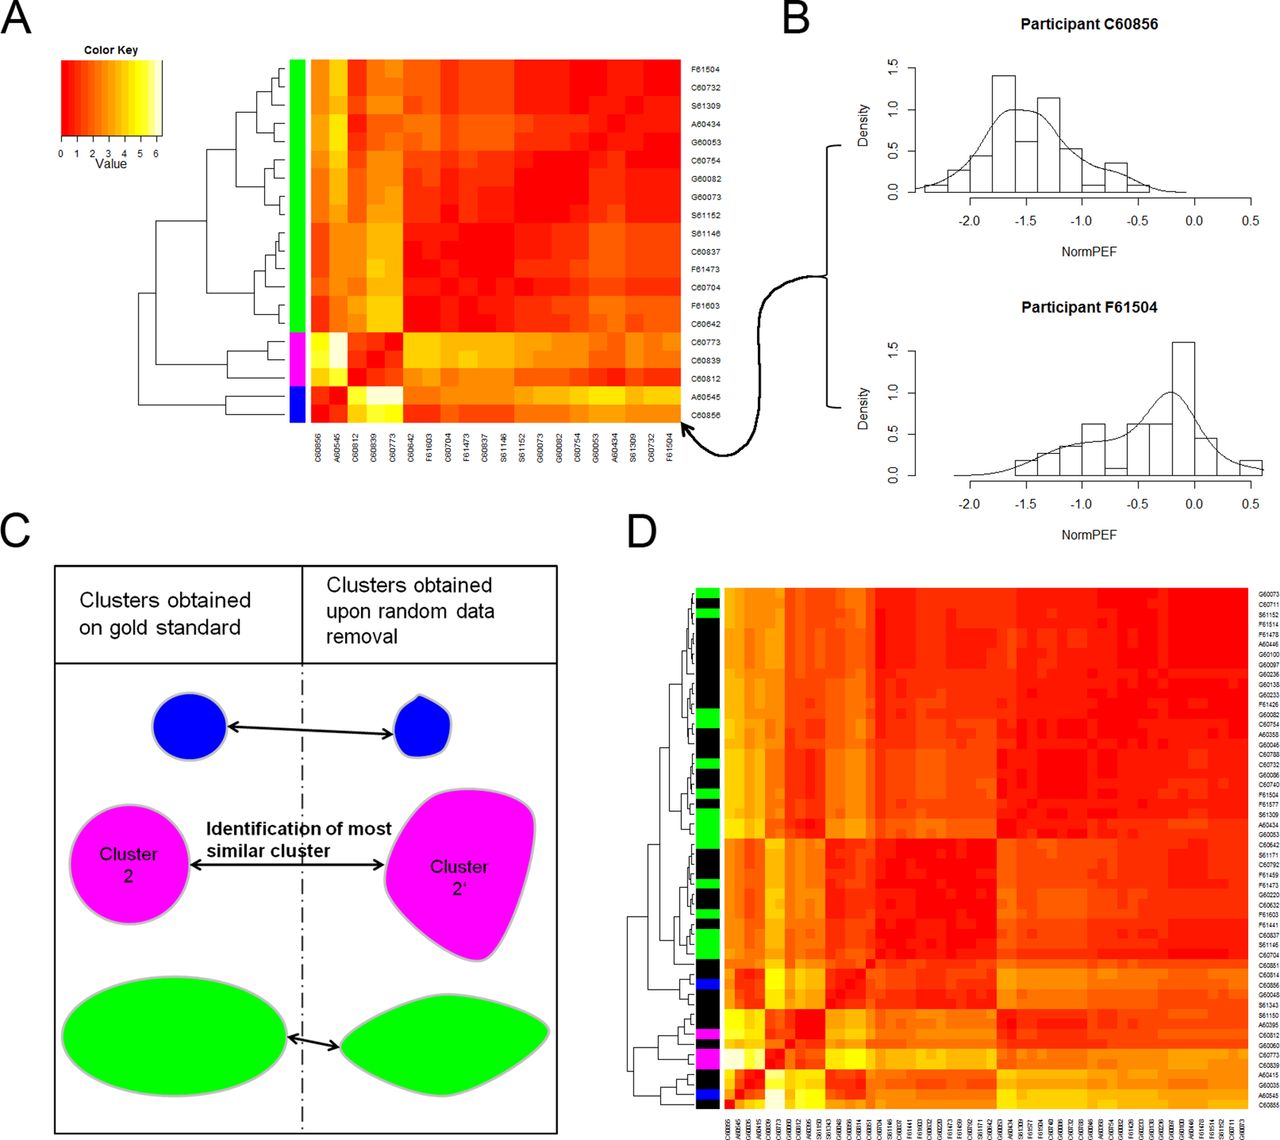
Workflow of the method, steps 1–4. (A) Heatmap representation of the matrix of lung function profiles. To the left of the matrix: dendrogram resulting from hierarchical clustering. Each row in the matrix corresponds to one participant in the gold standard, a subset of the cohort selected thorough quality and compliance criteria. Each entry in the matrix is the result of a distance calculation between a pair of distributions of lung function measurements (B). Three identified clusters are marked with colour bars (green, blue and magenta) for illustration purposes. (C) Assessment of the stability of the clusters upon random removal of a fixed percentage of measurements. Stability requirements allow for the calculation of a tolerable percentage of missing data. The gold standard subset is extended by including participants with a tolerable level of missing measurements. A new matrix of lung function profiles is constructed, and hierarchical clustering on those profiles is performed using this extended data set (D). Cluster assignment of previous cluster members is visible via colour bars on black background. The data underlying all panels are hypothetical normalised PEF values created/selected to illustrate the method. PEF, peak expiratory flow.
Within the PASTURE/EFRAIM cohort, the analysis was conducted using the morning FEV1 measurements for the following reasons: evening measurements are more influenced by various daytime environmental stimuli than morning measurements. Furthermore, during the measurement in children, PEF may still be slightly more dependent on cooperation than FEV1. Lastly, in many randomised controlled trials, FEV1 is still the most often used outcome parameter. The results obtained using other combinations of lung function parameters (PEF or FEV1) and time slots (morning, evening and entire day) can be found in the OSM for the sake of illustration.
Results
In the application and evaluation of our method, the results are generated according to the FBC methodology, as depicted in the FBC workflow (figure 2). All five steps of this workflow (as described above in the Methods section) were applied to the data from the PASTURE/EFRAIM cohort. In order to include participants with more missing values (step 3), we analysed the stability of the clusters found in the gold standard upon random removal of different percentages of measurements. Using suitable tolerance levels of cluster disruption, we were able to include participants in the analysis that had 20% of their values missing.
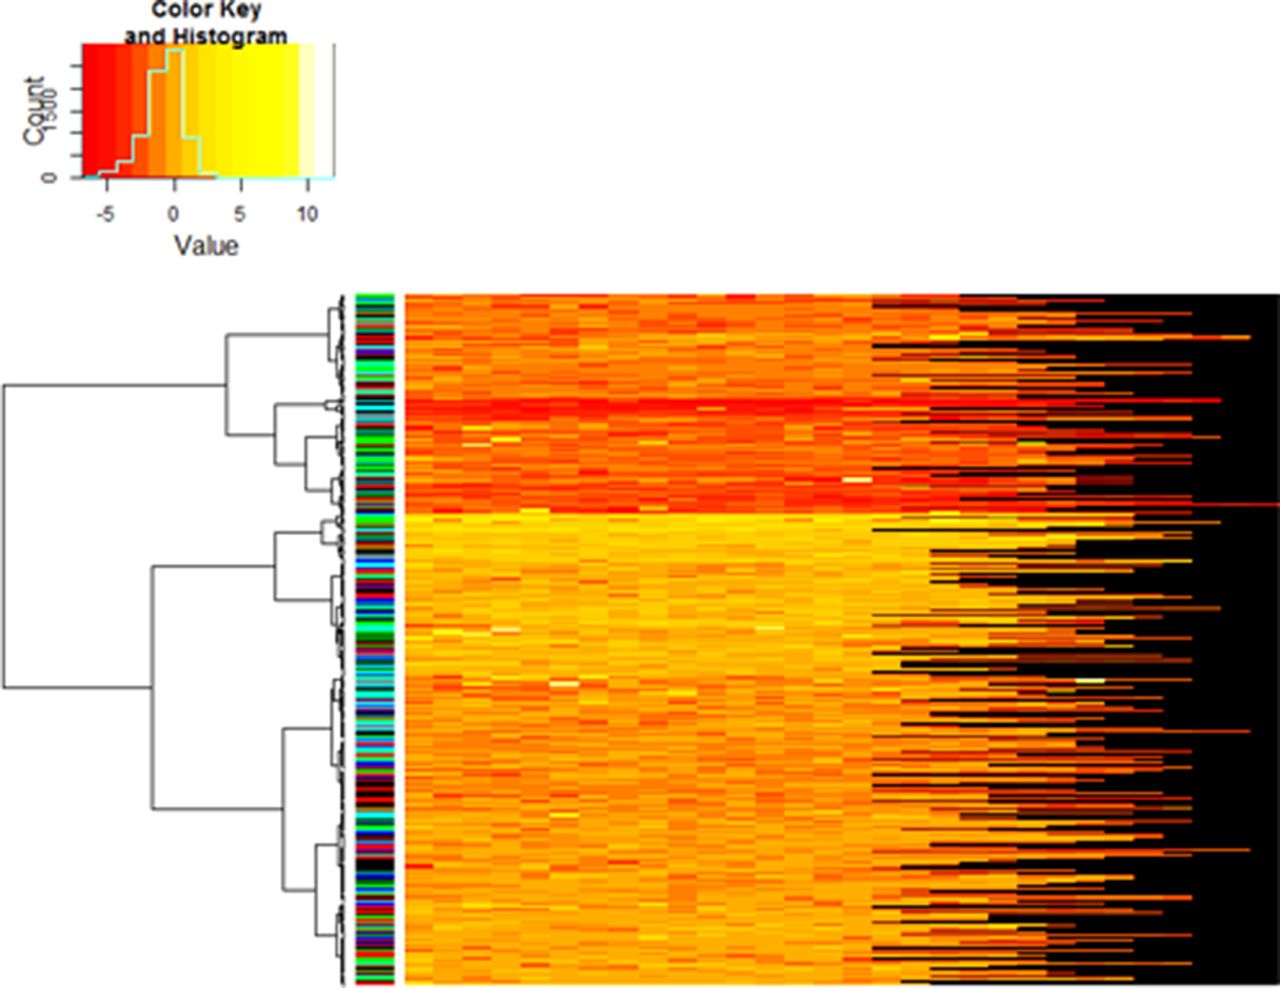
The final clustering together with each participant’s individual collection of normalised morning FEV1 values are depicted in figure 4.
Dendrogram obtained via hierarchical clustering of each participant’s lung function profile within the subset obtained after extension of the gold standard (PASTURE/EFRAIM cohort). The heatmap does not show the participants’ lung function profiles. Instead, each row corresponds to one participant and illustrates their individual collection of normalised morning FEV1 values. The different lengths of the rows reflect the aforementioned compliance issues within this cohort. The colour bar between the dendrogram and the heatmap indicates the colour-coded country of the participants. The random pattern of colours demonstrates that the individual clusters are not enriched in any particular nationality (verified by hypergeometric test, results not shown). PASTURE, Protection Against Allergy – Study in Rural Environments.
The statistical analysis and characterisation of the clusters found is presented in full detail below. The very last subsection of the results section is devoted to the statistical analysis and characterisation of the clusters found in the BIOAIR cohort. There, we carried out the analysis only on the gold standard and using whole day measurements of FEV1.
Enrichment analysis and clinical characterisation of clusters identified in the PASTURE/EFRAIM cohort
We investigated whether the clusters found represent asthma-specific clinical characteristics and phenotypes. Moreover, we looked for potential functional differences among the healthy participants. To this end, we determined whether the individual clusters were significantly enriched (see Methods and part 2.4 of the OSM) in the following clinical phenotypes and characteristics available within the cohort: children of farmers versus those of non-farmers, gender, atopic disease, asthma diagnosis, recurrent wheeze, episodic wheeze, atopic asthma, non-atopic asthma, presence of the risk allele containing the SNP rs7216389 in the gasdermin B (GSDMB) coding region of chromosome 17q21 (see, eg, ref 37), FeNO as a marker of airway inflammation, and significant bronchodilator response (see online supplementary table E1). Results and statistical significance are reported in table 1. Results for all variables, time slots and clustering multiplicities can be found in online supplementary tables S2–S7.
Absolute (and relative) number of individuals with the phenotype or characteristic (see online supplementary table E1 for definitions) specified in the first column in the different clusters. Enrichment in a given phenotype/characteristic is marked in bold letters. Depletion in a given phenotype/characteristic is marked in italics
In cluster 1, the mean morning FEV1 measurements tended to be lower, which is consistent with more airway obstruction. This cluster also displayed the lowest mean coefficient of variation in FEV1 values, although the highest SD.
The enrichment analysis unveiled significantly more children with clinical symptoms of asthma in clusters 1 and 2. In cluster 1, more children with asthma, according to the broader definition, lower lung function and positive bronchodilator response but no allergic predisposition, were found than expected by chance. Cluster 2 was significantly enriched in children with recurrent wheezing symptoms and who used inhaled corticosteroids as asthma treatment. In contrast to cluster 1, cluster 2 is characterised by the highest mean variability in FEV1, which is almost five times higher than in cluster 1. Thus, FBC was helpful in identifying two lung functional phenotypes, each of which contributing differently to the clinical manifestation of asthma. These are namely functionally different in terms of mean, coefficient of variation (CV) of daily lung function and in terms of bronchodilator responsiveness, but not in terms of atopy or inflammatory markers (FeNO).
Clusters 3 and 4 appeared different and showed the highest proportion of healthy participants (>80%). Interestingly, FBC similarly separated two functional phenotypes in the healthy control participants (clusters 3 and 4) with lung function values typically in the normal range. Cluster 3 showed a group low mean FEV1 and low variability and was enriched with individuals living in a farming environment. There were significantly more participants in cluster 3 (79.6%) who carried the risk allele GSDMB rs7216389. Cluster 4 contained predominantly healthy children—and more girls than boys—with high normalised mean lung function and high mean variability in FEV1. This cluster was depleted (ie, fewer than expected by chance) of participants carrying the risk allele GSDMB rs7216389.
Clusters 1 and 3 appeared similar with both showing less variable FEV1 and a comparatively low mean FEV1. At the same time, cluster 1 was clearly dominated by children with clinical symptoms of asthma, whereas cluster 3 corresponded to a healthy subgroup. Thus, the same ‘functional type’ found in individuals with asthma can be found to a milder degree in healthy children. Moreover, the four clusters were not significantly different in terms of the levels of FeNO, and no cluster was enriched in atopic individuals.
Independent application using dataset of mild-to-moderate and therapy-resistant severe adult asthmatics (BIOAIR cohort)
In order to explore the ability of our method to discriminate between different levels of disease severity, we analysed data from 138 patients consisting of 76 clinically defined therapy-resistant severe asthmatics and 62 mild-to-moderate asthmatics.33 According to the same criterion defined above, we identified the gold standard, which consisted of 45 patients. We then conducted hierarchical clustering on the lung function profiles of these patients and cut the dendrogram at the height that yielded two clusters. By means of enrichment analysis, we determined that these two clusters separated the gold standard into mainly mild-to-moderate asthmatics, on the one hand, and predominantly severe asthmatics, on the other hand (table 2).
Absolute (and relative) number of individuals with the phenotype or characteristic specified in the first column in the different clusters. Enrichment (hypergeometric test) in a given phenotype/characteristic is marked in bold letters
This is particularly interesting since the group mean of FEV1 in the clinically defined mild-to-moderate asthmatics (median=−2.0, Interquartile interval=(−2.4; −1.4)) showed a large overlap with the group of severe asthmatics (−2.8 (−3.5; −1.6)). Consequently, a classifier solely based on a threshold value of mean lung function would frequently yield a misclassification. Using the patients’ individual fluctuation patterns as an additional discriminative feature may mitigate this issue.
Discussion
Main findings
Both airway inflammation and reversible airway obstruction are key features of bronchial asthma in children and adults. Most published clustering methods for phenotyping asthma have used clinical, inflammatory or lung function markers at a single point in time. However, for the clinician in daily practice, the history of the day-to-day obstructive response of the airways to external stimuli in the patient’s environmental context is crucial in diagnosis and treatment decisions. So far, temporal fluctuation of daily lung function has never been used to functionally phenotype or cluster groups of patients with asthma. By combining fluctuation analysis and clustering methods, we present here a novel clustering approach to lung functional phenotyping (FBC). Moreover, we have developed a procedure that effectively determines the tolerable number of missing measurements in a data-driven manner.
Using FBC in the cohort of children, we identified two distinct lung functional phenotypes of participants with well-known clinical characteristics of asthma. These were significantly different from two functional clusters consisting of mainly healthy infants. Mostly non-atopic asthmatics were over-represented in clusters 1 and 2. Children in the asthma-related clusters 1 and 2 were different in their degree of obstruction, bronchodilator responsiveness and medication use. While we found a predominance of children with good β2 response in cluster 1, more children were treated with inhaled corticosteroids in cluster 2. Interestingly, in cluster 1, we found asthmatic children with low lung function, low variability and significant bronchodilator response, whereas in cluster 2, mean FEV1 was higher and accompanied by high daily variability.
Similarly, in the predominantly healthy clusters (3 and 4), cluster 3 was characterised by low-normal mean FEV1 and low variability, whereas 4 showed high mean FEV1, higher natural fluctuations of FEV1 and a predominance of girls. In fact, we found the functional phenotypes characterised by low mean and low variability, as well as the functional phenotypes characterised by high mean and high variability in asthma, but also to a milder degree in predominantly healthy children (clusters 1 and 3, and clusters 2 and 4, respectively). Since inflammatory markers (atopic predisposition and FeNO) were not different between these four clusters, our data suggest that FBC identifies dynamic lung functional characteristics of the airways in response to the given environment, at least partially independent of their atopic and inflammatory status.
Our data also suggest that intrinsic hereditary and interacting environmental factors may contribute to asthma and, to a milder degree, to healthy phenotypes. Hereditary effects, such as sex effects (clusters 1 and 4), and also associations with asthma-related genes (17q21) were observed in clusters 3 and 4. In cluster 3, we found an enrichment of children carrying the risk allele containing the SNP rs7216389 in the gasdermin B (GSDMB) coding region of chromosome 17q21, and in cluster 4, a depletion of such individuals. The presence of this allele has been linked to asthma, exacerbation risk and changes in FEV1. In particular, specific associations with bronchial hyper-responsiveness, severe asthma and asthma that is poorly controlled by current medications have been found (see ref 37 and the citations therein). The association of rs7216389 with exacerbation risk, bronchial responsiveness38 and also gene interactions with arginase1 (rs37756780, ARG1)39 may be a potential underlying mechanism to explain the enrichment and depletion of SNP rs7216389 in clusters 3 and 4, respectively. Moreover, recently, a gene-by-environment interaction of locus 17q21 has been demonstrated.40 In particular, it has been shown that individuals carrying the GSDMB rs7216389 variant particularly benefit from growing up in a farming environment due to its protective effect against virus-induced wheeze and non-atopic asthma. In cluster 3, children living in a farming environment were predominant. Their vulnerability resulting from carrying the risk allele GSDMB rs7216389 is thus compensated via the aforementioned protective effect. This may explain why the comparatively reduced lung function that is strikingly characteristic of the children in cluster 3 generally remains asymptomatic. Nevertheless, temporal variations of environmental triggers41 in the farming environment may particularly affect daily lung function.
Our results indicate that our methodology may be useful for phenotyping in existing asthma and also for functional phenotyping in healthy individuals. For instance, our findings regarding cluster 3 suggest that this cluster could potentially contain a subgroup of individuals at risk of developing asthma. Future longitudinal studies will be required in order to investigate this.
In our second cohort (BIOAIR), we found that our FBC method was able to discriminate between mild-to-moderate asthma and therapy-resistant severe asthma. Our findings are consistent with previous observations that fluctuation patterns in severe asthma are different than in mild asthmatics.26
Our method is based on distribution but not correlation properties of the lung function measurements. Calculating correlation from data with missing data points is prone to errors. Thus, while neglecting the time dimension, we gain robustness with respect to missing data, which increases the feasibility and clinical applicability of the method.
Limitations and advantages of the FBC method, especially in comparison with other existing clustering approaches to disease phenotyping, are discussed in the OSM.
Clinical implications of this novel approach
FBC identifies two distinct clusters of asthma patients and two clusters of healthy participants with specific dynamic lung functional interaction patterns to the stimuli in their given environment, which is at least partly independent of the inflammatory or atopic status, but may be related to hereditary (sex, 17q21 (GSDMB)) and environmental factors (eg, farming). We believe that lung functional stability over an extended window of time is an additional and important characteristic to be considered in asthma research and is different from a single-point-in-time characterisation. This is particularly important since it becomes increasingly evident that many asthma biomarkers need to be interpreted within the context of the patient’s given environment. We hypothesise that these dynamic lung functional characteristics are relevant for the understanding of disease stability over time and also for the search for treatable traits.
There is increasing evidence that the causal relation between airway inflammation and subsequent airway obstruction is weak and complex. Lung functional impairment, smooth muscle mechanics21 and impaired elastic recoil of the airways in obese patients42 can contribute to airway obstruction and asthma symptoms independent of airway inflammation.8 As demonstrated in the BADGER study,29 some patients may benefit more from bronchodilator therapy than from step-up anti-inflammatory treatments in order to achieve asthma stability. FBC might help identify such patients. Future studies will need to demonstrate whether FBC phenotyping (eg, cluster 1) may contribute to this clinical decision making. Previous work has already shown that lung function fluctuation patterns can predict treatment response to long-acting β-agonists.28 Within the context of adult asthma, the method contributes to the identification of severe therapy-resistant asthmatic patients, a known distinct entity, which is typified by a lack of asthma control despite appropriate anti-inflammatory treatment. In these patients, not only steroid resistance, but also airway remodelling and fixed functional airway impairment contribute to poor asthma control. In such cases, FBC could help identify patients with lung mechanical impairment. FBC does not replace other clustering methods but as a complementary method could provide evidence of mechanical impairment by way of measurements taken in a telemonitoring setting.
Supplementary file 2
Supplementary file 3
Supplementary file 4
Supplementary file 5
Supplementary file 6
Supplementary file 7
Acknowledgments
The authors would like to thank Karine Landgren Hugentobler and Anna Longjaloux for proofreading the manuscript. The authors would also like to express their gratitude to PhD candidate Delphine Meier for carrying out the computations concerning the analysis of the BIOAIR cohort data.
References
Footnotes
Some of the results of these studies have been previously reported in the form of an abstract (see reference 32).
OF and NK contributed equally.
Contributors ED-E, OF, JP, J-CD, JR, RL, EvM and UF planned the study; ED-E, NK, OF and the PASTURE Study Group were involved in the acquisition, management and interpretation of data; ED-E conceived the computational methodology and the algorithms, selected statistical tests to be used and implemented algorithms; NK conceived and implemented algorithms and performed data processing; MK planned genetic analyses and interpreted genetic data. ED-E, NK and OF performed statistical analyses; MK, S-ED and the BIOAIR Study Group were responsible for the study design, cohort collection and data analysis of the BIOAIR Study; ED-E, OF, EvM and UF wrote the manuscript; all authors provided substantial revisions and approval of the final manuscript.
Funding The PASTURE/EFRAIM study was supported by the European Commission research grants QLK4-CT-2001-00250, FOOD-CT-2006-31708 and KBBE-2007-2-2-06. OF (PASTURE/EFRAIM study) is the recipient of a Long-Term Research Fellowship by the European Respiratory Society (no. 675) and a training scholarship by the Austrian, German and Swiss Paediatric Respiratory Society. The BIOAIR study was supported by the following Swedish research funding bodies: The Medical Research Council, the Heart-Lung Foundation, the Vårdal Foundation, the Stockholm County Council (ALF), the Swedish Asthma and Allergy Association, the Swedish Foundation for Strategic Research, Konsul Th C Berghs Foundation, the Karolinska Institutet SciLifeLab collaborations on translational medicine (ChAMP project), the Innovative Medicines Initiative project U-BIOPRED (unbiased biomarkers for the prediction of respiratory disease outcomes) and Karolinska Institutet.
Competing interests None declared.
Ethics approval Ethics committees of the corresponding participating study centres.
Provenance and peer review Not commissioned; externally peer reviewed.
Collaborators The members of the PASTURE study group are (in alphabetical order): Sondhja BitterA, B, Charlotte Braun-FahrländerA, B, Gisela BücheleC, Marie-Laure DalphinD, Martin DepnerH, Gert DoekesE, Markus J. EgeH, Remo FreiF, Jon GenuneitC, Maija-Riitta HirvonenG, Anne HyvärinenK, Anne M. KarvonenK, Vincent KaulekD, Georg LossA, B, H, Petra Ina PfefferleN, Sami RemesI, Harald RenzJ, Caroline RoduitO, Marjut RoponenG, Bianca SchaubH, Pekka TiittanenK, Juliane WeberH. ASwiss Tropical and Public Health Institute, Basel, Switzerland. BUniversity of Basel, Basel, Switzerland. CInstitute of Epidemiology and Medical Biometry, University of Ulm, Ulm, Germany. DDepartment of Respiratory Disease, UMR/CNRS 6249 chrono-environnement, University Hospital of Besançon, France. EUtrecht University, Institute for Risk Assessment Sciences (IRAS), Division of Environmental Epidemiology, Utrecht, Netherlands. FUniversity of Zurich, Children’s Hospital, and Christine Kühne-Center for Allergy Research and Education, Zurich, Switzerland. GDepartment of Environmental Science, University of Eastern Finland, Kuopio, Finland. HDr von Hauner Children’s Hospital, Ludwig Maximilians University, Munich, Germany; Member of the German Center for Lung Research (DZL). IDepartment of Paediatrics, Kuopio University Hospital, Kopio, Finland. JInstitute for Laboratory Medicine and Pathobiochemistry, Molecular Diagnostics, Philipps University of Marburg, Marburg, Germany. KDepartment of Health Protection, National Institute for Health and Welfare, Kuopio, Finland. NInstitute for Laboratory Medicine and Pathobiochemistry, Molecular Diagnostics, Philipps University of Marburg, Marburg, Germany. OChildren’s Hospital, University of Zurich, and Christine Kühne-Center for Allergy Research and Education, Zurich, Switzerland. The members of the BIOAIR study group are: Dr Roelinde Middelveld, Karolinska Institutet, Stockholm, Sweden. Professor Barbro Dahlén, Karolinska Institutet, Stockholm, Sweden. Dr Mina Gaga, University of Athens, Greece. Professor Nikos M. Siafakas, University of Crete, Greece. Professor Alberto Papi, University of Ferrara, Italy. Leonardo M. Fabbri, University of Modena, Italy. Professor Guy Joos, University of Gent, Belgium. Professor Klaus F. Rabe, Christian Albrechts University Kiel, Germany. Professor Sebastian L. Johnston, The Imperial College of Science and Technology, London, UK. Professor Pascal Chanez, University of Marseilles, France. Dr Mark Gjormarkaj, Italian Research Council, Palermo, Italy. Dr Peter H. Howarth, University of Southampton, UK. Professor Ewa Niżankowska-Mogilnicka, The Jagellonian University, Krakow, Poland.
Correction notice This article has been corrected since it was published Online First. The following changes have been made: 1) Sven-Erik Dahlen’s name was corrected; 2) Affiliation 12 was corrected; 3) Reference 13 citation was incorrect, this has now been corrected; 4) Collaborators section has been corrected.