Article Text

Abstract
Objective The association between exposure to ambient particles with a median aerodynamic diameter less than 10/2.5 µm (particulate matter, PM10/2.5) and COPD remains unclear. Our study objective was to examine the association between ambient PM10/2.5 concentrations and lung functions in adults.
Methods A cross-sectional study was conducted in southern China. Seven clusters were randomly selected from four cities across Guangdong province. Residents aged ≥20 years in the participating clusters were randomly recruited; all eligible participants were examined with a standardised questionnaire and spirometry. COPD was defined as a post-bronchodilator FEV1/FVC less than 70%. Atmosphere PM sampling was conducted across the clusters along with our survey.
Results Of the subjects initially recruited, 84.4% (n=5993) were included for analysis. COPD prevalence and atmosphere PM concentration varied significantly among the seven clusters. COPD prevalence was significantly associated with elevated PM concentration levels: adjusted OR 2.416 (95% CI 1.417 to 4.118) for >35 and ≤75 µg/m3 and 2.530 (1.280 to 5.001) for >75 µg/m3 compared with the level of ≤35 µg/m3 for PM2.5; adjusted OR 2.442 (95% CI 1.449 to 4.117) for >50 and ≤150 µg/m3 compared with the level of ≤50 µg/m3 for PM1. A 10 µg/m3 increase in PM2.5 concentrations was associated with a 26 mL (95% CI −43 to −9) decrease in FEV1, a 28 mL (−49 to −8) decrease in FVC and a 0.09% decrease (−0.170 to −0.010) in FEV1/FVC ratio. The associations of COPD with PM10 were consistent with PM2.5 but slightly weaker.
Conclusions Exposure to higher PM concentrations was strongly associated with increased COPD prevalence and declined respiratory function.
Trial registration number ChiCTR-OO-14004264; Post-results.
- COPD epidemiology
This is an Open Access article distributed in accordance with the Creative Commons Attribution Non Commercial (CC BY-NC 4.0) license, which permits others to distribute, remix, adapt, build upon this work non-commercially, and license their derivative works on different terms, provided the original work is properly cited and the use is non-commercial. See: http://creativecommons.org/licenses/by-nc/4.0/
Statistics from Altmetric.com
Key messages
What is the key question?
To find an association between exposure to ambient particles with a median aerodynamic diameter less than 10 or 2.5 µm (PM10/2.5) and COPD and lung function in adults.
What is the bottom line?
Through a population-based, cross-sectional, multicentre survey of COPD and 1-year ambient air sampling, we found that higher PM concentrations were strongly associated with COPD development and decreased respiratory function.
Why read on?
Air pollution poses a big challenge to human health and the association between exposure to ambient particles and COPD is unclear. We used a multistage cluster sampling strategy to estimate COPD prevalence, sampling PM concentration with the guidance of the Institute of Earth Environment, Chinese Academy of Sciences. We considered almost all confounding factors to assess the association between PM concentration and COPD and lung function.
Introduction
Air pollution has a significant public health impact that cannot be neglected. Outdoor air pollution may play an important role in the early development of respiratory disorders.1 ,2 Short-term (up to a few days) increases in exposure to outdoor air pollution have been found to increase the risk of adverse pulmonary outcomes, including acute exacerbation of COPD and respiratory mortality overall.3 ,4 Recent studies have associated short-term exposure to outdoor particulate matter (PM) (particles with a median aerodynamic diameter less than 10 or 2.5 µm (PM10/2.5)) with reduced lung function and increased hospital admissions.5–8 One study evaluated the relationship between annual average ambient fine PM2.5 concentrations and adverse respiratory outcomes (eg, asthma) for adults using modelled air pollution and health outcome data.9 In the European Study of Cohorts for Air Pollution Effects (ESCAPE), an increase of 10 µg/m3 in PM10 was found to be associated with a lower level of FEV1 and FVC. The associations were particularly strong in individuals with obesity.10 Long-term exposure to traffic and PM2.5 at relatively low levels was associated with lower FEV1 and FVC and an accelerated rate of decline in lung function.11 However, it remains unclear whether chronic exposure to ambient PM, especially for fine PM2.5 at high levels in China, is associated with COPD morbidity and lung function in adults, given that the complex composition and ambient concentrations of ambient PM vary greatly by country and region.
Methods
Study design and population
The study population consisted of the participants in the National Science-Technology Support Plan Program for the 12th 5-year plan, which was a population-based, cross-sectional, multicentre survey of COPD conducted in China (2012–2015). Eight clusters of districts/towns were randomly selected from four cities (ie, Guangzhou, Shaoguan, Heyuan and Zhanjiang) with different pollution levels well representative of Guangdong province. In each of these cities, we used a multistage cluster sampling strategy. Due to the large socioeconomic differences between rural and urban regions, we chose counties from Shaoguan, Heyuan as rural regions, and districts from Guangzhou, Zhanjiang as urban regions. Two districts or a rural county were randomly selected in each city, which was the first stage of the census tracts. As the second step of the sampling process, we randomly selected an urban street or two rural towns from each of the selected urban districts and rural counties (as air sampling cluster units). Two clusters of Shaoguan were combined because they were situated next to each other so that there remained seven sampling clusters in the study. Finally, we used a randomised cluster sampling algorithm to select urban communities or villages. The number of selected communities or villages depended on the size of the population in the participating clusters to meet the total sample size required for the design of this study. In the selected sample clusters, we then randomly recruited residents aged 20 years or older according to the latest census by local police stations where electronic registry data were maintained. The study protocol was approved by the institutional review board of each participating centre. All eligible local recruits in the selected clusters were invited to participate in the study with questionnaire and spirometry examinations. Eligible participants who missed our invited interview and/or spirometry received a home visit on a later occasion. COPD was diagnosed as a post-bronchodilator FEV1/FVC less than 70%. Chest radiographs, ECG and blood pressure measurements were further examined to find contraindications and other disorders that may affect lung function.
Spirometry
Spirometry including pre-bronchodilator and post-bronchodilator measurements was performed in all eligible participants to diagnose COPD by post-bronchodilator (Salbutamol Sulfate Aerosol, 400 µg, 20 min later) FEV1/FVC% of less than 70%. Spirometric data were obtained using a portable spirometer (Carefusion MasterScreen Pneumo, Germany) interfaced for pulmonary function data acquisition and quality control software (Sentrysuite V.2.3) and calibrated daily. Spirometric manoeuvres were performed according to the European Respiratory Society/American Thoracic Society standards (ERS/ATS 2005).12 As reported by Enright and colleagues, an A–F quality grade based on acceptable manoeuvres and repeatability of the FEV1 was used to evaluate spirometry results.13 Spirometry results with grades A, B or C were considered acceptable for analysis. All exams of spirometry were conducted within 1 month in the summer from 2012 through 2014.
Questionnaire and risk factors for COPD
A questionnaire interview was performed using a standardised questionnaire revised from the international BOLD (Burden of Obstructive Lung Diseases) study, including possible risk factors for COPD, such as family history of respiratory diseases, smoking status, occupational exposure, biomass fuel exposure and related medical history. Having a family history of respiratory diseases was identified by blood-related family members experiencing pulmonary diseases such as chronic bronchitis, asthma, emphysema, COPD, lung cancer, bronchiectasia and other heredity diseases that may affect the lung. A subject was referred to as a smoker if he/she had smoked more than five packs×year in his/her life. Exposure to high concentrations of all types of dust for more than 1 year without any protective measure was defined as occupational exposure. Biomass exposure was identified as use of biomass fuels for heat or warmth for more than 5 hours×year. Self-reported hospitalisation due to pneumonia more than once was considered as having a related medical history of pneumonia. Exposure to environmental tobacco smoke (ETS) was defined as having been exposed for at least 15 min daily for >1 day every week and for at least 2 years at home or in the workplace.14 A cumulative exposure index combined from home and work environments was identified as follows: the cumulative exposure at home (cigarettes/day×years) was classified into four categories (no exposure, 1–4 pack-years, 4–8 pack-years, ≥8 pack-years) with scores ranging from 0 to 3, respectively; cumulative exposure at work ((cigarettes/day×years×smokers×hours/day)/100) was also classified into four categories (score 0 (ie, no exposure); score 1 (1–5); score 2 (5–15); score 3 (≥15)); total scores (ranging from 0 to 6) from cumulative exposure at home and work were classified into four levels (no exposure (ie, score 0), low exposure (score 1–2), moderate exposure (score 3–4), high exposure (score 5–6)).15 Participants with mothers who had a regular smoking and/or passive smoking history were also recorded. Other chronic pulmonary diseases were specifically defined as asthma, chronic bronchitis, TB, bronchiectasia, interstitial lung disease (ILD), allergic rhinitis and allergic sinusitis. COPD symptoms included one of the following symptoms lasting for more than 3 months and at least 2 years: dyspnoea, cough, sputum production, wheezing and chest tightness.
A total of 7098 participants were invited to participate in our study, among whom 1105 (15.57%) were excluded due to missed or failed spirometry (including unacceptable spirometry) (n=633), various unacceptable contraindications (n=173), or incomplete questionnaires (n=299), leading to a total of 5993 (84.4%) study subjects included in our final analyses.
Ambient particulate matter assessment
We estimated the average air pollution exposure level using 1-year atmosphere PMs sampled in the participating clusters. PM2.5 and PM10 concentrations were measured using a portable ambient air sampler (Minivol Tactical Air Sampler, TAS, Air metrics Co., Springfield, Illinois, USA) in the heartland of every cluster, which was placed approximately 1000 m from the furthest street in participating urban areas, and approximately 3000 m for rural towns to estimate the background exposure in these regions. A standardised protocol was developed using identical equipment in each centre (Institute of Earth Environment; Chinese Academy of Sciences). The equipment contained a 47 mm filter holder (Air metrics Co.) for Whatman quartz microfiber filters (QM/A, Whatman Inc, UK), a Graseby-Andersen PM10 inlet, and a PQ100 pump (Air metrics Co.), with a cutoff size of 2.5 or 10 µm aerodynamic diameter at a mini-volume flow rate of 5 L/min. Oil and filters were replaced after a maximum of 48 operating hours. Two samplers were assigned to each cluster to avoid measurement effect due to instrument damage. All the participants in one cluster were thus assigned to the same measurement of PM concentrations.
Weighing procedure
All pre-weighing and post-weighing of Whatman quartz microfiber filters were conducted in one central laboratory at the Institute of Earth Environment, Chinese Academy of Sciences, Xi'an by one senior technician. For the gravimetric analysis, a 1 µg sensitivity microbalance (Sartorius, ME 5-F, Germany) with automatic data transfer to a personal computer was used. Before weighing, all filters were equilibrated in the temperature and humidity chamber for 24 hours at 20–23°C and 35–45% relative humidity to determine mass concentrations. Tweezers were used to handle the filters by the 4 mm rubber rim, and filters were numbered with a pen on this rim. Each blank filter was then pre-sintered on both sides for at least 3 hours in the muffle furnace (model 4–10, Shanghai test instrument factory) at a temperature of 780°C before weighing (to remove other organic pollutants). The pre-weighed filters were placed in a filter cassette in a plastic box (provided by Whatman Inc, UK) before they were sent to the field workers. Exposed filters were stored in a refrigerator at 4°C and were sent back in a single batch to the weighing laboratory at the end of the measuring period. The weighing procedure for the loaded filters was identical to that used for unloaded filters. The weighed filters were stored in a refrigerator at under −4°C. The weight variability was less than 15 µg for unloaded filters and 20 µg for loaded filters; three effective weighting results were saved for each filter. After exposure, filters were stored for a maximum of 10 days at room temperature before weighing. Otherwise, they were transferred to 4°C for a maximum of 30 days.
PM sampling quality control procedure
Every field worker must take 1-week professional training focused on equipment operation and atmosphere PM sampling. At least one field worker per centre was trained by the coordinating centre. Manuals and videos were developed to instruct non-experienced field workers to sample PM2.5 and PM10. Any deviation from the protocol during the sampling process was recorded.
Measurement schedule
Twenty-four hour air sampling was scheduled in every 3-day period for at least 10 days in a representative sampling month, except for rainy days. January, April, July and October represented the four typical seasons during a year in Guangdong, according to the Provincial Environment Protection Administration. It started in the early morning, and ended in the late morning, with deviations of less than 30 min. Field blank filters were collected at each site. The weight difference of sampling filters before and after sampling was calculated by subtracting the field blank filter to obtain the net weight for each sample. At least 10 eligible filter samples were collected in every month by one sampler (supplementary measurements were conducted in the days immediately following in case one was missed) which represented 10-day measurements. From these 10 samples, a monthly mean concentration and a seasonal mean concentration was calculated. Thus, ‘yearly mean concentration’ was defined as the average of the four seasons. Our sampling process for all the centres began in April 2014 and ended in January 2015. table 1 shows the ambient air quality standards for PM10 and PM2.5: the average concentration limits for a 24 hour period. A measurement higher than the second level indicates the state of pollution.
Ambient air quality standards
Statistical analyses
We first performed logistic regression analyses to examine the associations between exposure variables (ie, PM2.5 and PM10) and COPD prevalence, COPD-related symptoms and other chronic pulmonary diseases. Then, we conducted further analyses to associate PM concentrations with lung function outcomes using multiple linear regression models. All logistic regression analyses were adjusted for age, sex, personal education state, smoking history, family history, biofuel and occupational exposure, history of childhood pneumonia in hospital, mother's smoking during pregnancy, maternal exposure to second-hand smoking during pregnancy, kitchen ventilation quality, second-hand smoking exposure, urban/rural distribution and clusters. PM2.5/10 was used as a categorised variable to fit logistic regression models. Before performing multiple linear regression models, simple linear regression models were used to screen effective variables for lung function. Thus, covariates such as mother's smoking during pregnancy, maternal exposure to second-hand smoking during pregnancy, kitchen ventilation quality, second-hand smoking exposure were all excluded from the models with spirometry outcomes as dependent variables. Age, smoking pack×years, biofuel index and PM concentration were used as continuous variable. Models with spirometry outcomes were also adjusted for height and weight. Information on all covariates in the final analyses was almost complete because telephone calls were made to capture missing data. A variable value of approximately 0.2% was used for missing values based on the variables of other subjects. All analyses were performed using IBM SPSS V.19.0.
Results
The characteristics of study participants are summarised in table 2. Older age, male sex, lower levels of education, smoking, occupational or biomass exposure, family members with related respiratory disease, a history of cough or hospitalisation for pneumonia in childhood appeared to be associated with higher COPD prevalence. The effects related to kitchen ventilation quality and ETS were weak or absent (table 2).
Characteristics of all study participants
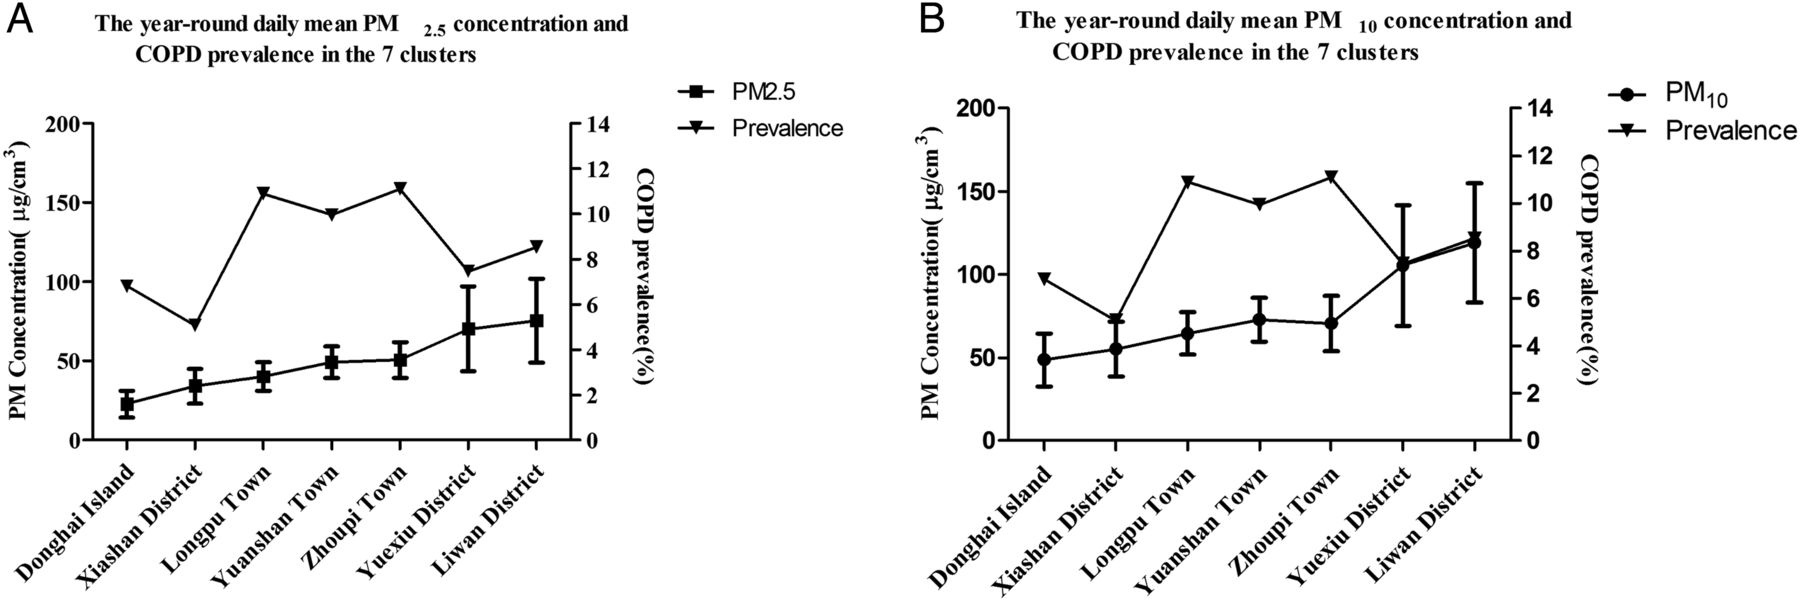
The seasonal mean PM2.5/10 mass concentrations from April 2014 to January 2015 for the seven centres are shown in online supplementary figure S1. The outdoor PM (PM10/2.5) varied greatly by season, region and day. These concentrations were clearly lower in summer but apparently higher in winter. There were lowest year-round average daily concentrations of approximately 22.72±8.58 µg/m3 in Donghai Island, but the highest daily concentrations of up to 75.37±26.6 µg/m3 for PM2.5 in Liwan District (figure 1). The day-to-day variability was large in Liwan and Yuexiu, while it was small in Donghai Island. In general, clusters with low PM mass concentrations had less daily variability than centres with high concentrations during the 4 months.16

The year-round daily mean particulate matter concentrations and COPD prevalence in seven clusters. Year-round daily mean PM2.5/10 concentrations were calculated using data collected from April 2014 to January 2015 at the seven monitoring stations; values are shown as mean and SD; PM2.5/10=particulate matter with a median aerodynamic diameter <2.5/10 µm.
supplementary data
The adjusted prevalence rates of COPD among participants aged ≥20 years in the sampling clusters were within a range from 5.1% to 11.1% (ie, from 3.1% to 4.9% for women; from 5.2% to 18.1% for men), with the highest prevalence in Wengyuan Zhoupi town (11.1%) and the lowest in Xiashan District (5.1%) (table 3). There was considerable difference between clusters in year-round daily mean PM (figure 1). However, we did not observe statistically significant effect modifications of the associations between year-round mean daily PM concentrations and COPD prevalence using correlation analysis (see online supplementary table S5), and consistent results were observed for male and female participants (see online supplementary table S5 and figure S2).
COPD prevalence (%) and 95% CI in each cluster
Logistic regression models were then used to further examine the association between year-round daily mean PM concentration and COPD after adjusting for available confounding factors. As shown in table 4, higher year-round daily mean PM2.5 concentrations were likely associated with COPD prevalence, with adjusted OR 2.416 (95% CI 1.417 to 4.118) for >30 and ≤75 µg/m3 and 2.530 (95% CI 1.280 to 5.001) for >75 µg/m3, respectively compared with the lower limit level of ≤35 µg/m3. Increased PM10 pollution level appeared to be significantly harmful to respiratory health (eg, COPD) with an adjusted OR of 2.442 (95% CI 1.449 to 4.117) for >50 and ≤150 µg/m3 versus the level for ≤50 µg/m3. Participants from areas with high levels of PM2.5/10 were at higher risk of having chronic cough, dyspnoea, sputum production, wheezing or chest tightness than those from areas with low levels. They also had elevated risks of other chronic respiratory diseases such as asthma, chronic bronchitis, TB, bronchiectasia, ILD, allergic rhinitis and allergic sinusitis (table 4). All analyses were adjusted for age, sex, personal education state, smoking history, family history, biofuel and occupational exposure, history of childhood pneumonia in the hospital, mother's smoking during pregnancy, maternal exposure to second-hand smoking during pregnancy, kitchen ventilation quality, second-hand smoking exposure, urban/rural distribution and clusters. Meanwhile, the effect of air pollution on COPD prevalence, COPD symptoms and other pulmonary diseases appeared to be statistically significant for men and smokers, but not for women and non-smokers (see online supplementary tables S1–4).
Ambient air particulate matter levels and hazards for COPD and other pulmonary outcomes
In our multiple regression analysis, we found a linear correlation between ambient year-round daily mean PM concentrations and lung function (table 5). An increased concentration of 10 µg/m3 in PM2.5 was associated with a decline of 26 mL (95% CI −43 to −9) in FEV1, a decline of 28 mL (95% CI −49 to −8) in FVC, and a 0.09% (95% CI −0.170 to −0.010) decline in FEV1/FVC ratio. Associations for PM10 were 14 mL (95% CI −22 to −6) lower in FEV1, 16 mL (95% CI −28 to −4) lower in FVC and 0.024% (95% CI −0.092 to 0.040) lower in FEV1/FVC ratio, a little weaker than PM2.5. All linear regression analyses were adjusted for sex, age, height, weight, smoking pack-year, education level, family history, biofuel (hours×year), occupational exposure, history of childhood pneumonia in hospital, urban/rural distribution and clusters.
Ambient air particulate matter exposure and effects on lung function
Discussion
Despite great improvement in ambient air quality over the past 30 years, air pollution continues to impose a challenge to regulatory and health professionals in most countries around the world. In this cross-sectional study, we found that increased PM concentrations are significantly associated with increased COPD prevalence and decreased respiratory function in Guangdong, China. We also found that the increased daily mean PM2.5 and PM10 levels were associated with an increased risk of COPD symptoms and other chronic pulmonary diseases.
To our knowledge, this is one of the few studies to explore associations between chronic atmospheric PM exposure and COPD. Some studies have reported stronger associations between acute exacerbation, hospitalisation, mortality of COPD and acute exposure to elevated PM2.5 concentration.17 ,18 A stratified analysis revealed significant associations for non-Hispanic black people (OR 1.73, 95% CI 1.17 to 2.56 for current asthma and OR 1.76, 95% CI 1.07 to 2.91 for recent attacks) with a 10 µg/m3 increase in PM2.5.9 A more recent study assessed the relative risk of hospital admissions for respiratory diseases with short-term effects of PM2.5 using a case-crossover approach, controlling for weather variables, day of the week, seasonality and chronic time trends. The results provided evidence that higher levels of PM2.5 increased the risk of hospital admissions for respiratory diseases in Taiwan.19 In addition, a number of studies confirmed daily short-term elevated atmospheric PM2.5 concentrations can cause respiratory damage, including COPD symptoms and acute admission rates.3 ,18 ,20 There were detrimental respiratory and pulmonary effects observed in response to even low levels of ambient air pollutants among study participants, indicating that exposures even below those of air quality standards may still pose significant risks to patients with severe COPD.21 Decreased rates of death from emphysema, asthma and pneumonia were observed when levels of ambient air pollutants were improved.22 ,23
In China, PM2.5/PM10 is not routinely monitored in most regions, especially in spacious rural area. We measured mass concentrations of PM2.5 and PM10 using a provisional atmosphere PM sampler to estimate the average exposure level of sample clusters. We did not find statistically significant effect modifications of the associations between year-round mean daily PM concentrations and COPD prevalence using a simple linear regression model. Similar results were also observed in men and women. However, a substantial body of evidence has shown that COPD is not a single-cause disease but is associated with multiple risk factors.24–24 It is well known that cigarette smoking is the primary cause of COPD and it is more prevalent in rural areas.27–29 In contrast, the impact of outdoor fine PM might be less significant. Given our limited number of sample clusters, it is very difficult to define their complex relationship. Therefore, we used a logistic regression to examine the relationship between daily mean PM concentration and COPD after adjusting for major confounding factors such as age, smoking, occupational and biofuel exposures and clusters. PM concentrations from the seven monitoring points were divided into three levels for PM2.5 and two for PM10, according to the recommendations of the National Environmental Protection Department concerning PM pollution (see Methods). There was one location with PM2.5 concentrations higher than 75 µg/m3 in this study. We found that increases in daily mean PM2.5 concentrations are associated with COPD prevalence. Similar strong evidence was also found for the association between the increase in daily mean PM10 concentration level and COPD prevalence. A few studies have reported associations between COPD prevalence and exposure to elevated PM2.5 concentration.30 As reported in a recent study, a 7 µg/m3 increase in the 5-year mean PM10 (IQR) was associated with an OR of 1.33 (95% CI 1.03 to 1.72) for COPD.31 Unexpectedly, the ORs of PM2.5 at levels >35 but <75 µg/m3 and PM10 at levels >50 but <150 µg/m3 were found to be close. In addition, the ORs of PM2.5 at levels >75 µg/m3 were not much higher than those at levels >35 but <75 µg/m3. The distinct differential effect might not be detected because PM2.5 concentrations >75 µg/m3 were only observed in one location in our survey (75.4 µg/m3). This may also explain why we set the cutoff value of 150 µg/m3 as an upper limit of the second level for PM10 and 75 µg/m3 for PM2.5. Another reason may be that the adverse impact of PM on COPD is increasingly nonlinear, but in an ‘S’ or other pattern. Meanwhile, we found the effect of PM on COPD prevalence appeared to be statistically significant for men and smokers, though not for women and non-smokers (see online supplementary tables S1–4). It is well known that COPD prevalence is relatively low in non-smokers and women, which indicates that numerous investigation clusters are needed to discover the impact of PM on COPD. Given the complex composition of PM, it is difficult to define its true relationship with outcomes of interest.
A recent study showed that each 2 µg/m3 increase in the average PM2.5 was associated with a 13.5 mL (95% CI −26.6 to −0.3) lower FEV1 and a 2.1 mL/year (95% CI −4.1 to −0.2) decline in FEV1; there were similar associations with FVC after long-term exposure to traffic emissions.11 Each 2 µg/m3 increment in prior year PM2.5 was associated with lower FVC (−21.8 mL; −43.9 to 0.2) and higher odds of FEV1 <80% predicted (1.41; 1.03 to 1.93) in children.32 Another study showed that each 10 µg/m3 increase in the average PM2.5 was associated with a 0.09–1.5 decline in FEV1 % predicted21 These effects of lung function damage were relatively higher than those in our study. The reasons may be due to large composition and ratio differences between traffic PM2.5 and atmospheric PM2.5, and the population's sensitivity to pollutants. Exposure to highly mixed atmospheric pollutant PM may cause less damage to lung function than pure traffic-related PM.33 In addition, our study obtained only seven sample data points in Guangdong, a large province of southern China where air pollution is relatively light and has been substantially improved in recent years.34 These may in part explain why the effect we observed was smaller than that reported by other researchers. We found an increased concentration of 10 µg/m3 in PM2.5 was associated with the decrease in FEV1 and FVC. The decrease in FEV1 was about the same or even more serious than that for FVC, with the decrease in FEV1 % predicted a little higher than FVC % predicted. Thus it could be plausible for some long-term PM exposed individuals to develop COPD. However, associations for PM10 were weaker than those for PM2.5, and no clear significance for FEV1/FVC decline was observed. The Normative Aging Study of elderly men recently found that long-term estimates of exposure to black carbon, a traffic-related constituent of PM weighted towards diesel, were associated with accelerated decline in FEV1 and FVC.35 This study showed that the cross-sectional effect of black carbon exposure on baseline lung function was slightly stronger for FEV1 than for FVC, suggesting an obstructive effect. However, the longitudinal effect of black carbon on lung function decline was stronger for FVC compared with FEV1, a restrictive pattern. The ESCAPE meta-analysis found non-significant positive associations between long-term estimates of PM10 and odds of COPD (defined as FEV1/FVC of 0.7), suggesting a possible obstructive effect.36
However, we did not find clear associations between air PM exposures and lung function in participants with COPD (see online supplementary table S6). The results of Lagorio's study suggested that the short-term negative impact of exposure to air pollutants on respiratory volume and flow is limited to individuals with impaired respiratory function.5 The fine fraction of ambient PM seems responsible for the observed effects among COPD cases, with zinc and iron having a potential role via oxidative stress. The respiratory function of the relatively young and people with mild asthma included in his study seemed to worsen when ambient levels of NO2 increased.5 Differences in the source, composition and proportion of pollutants might also cause the differences in our results. In addition, insufficient numbers of sampling points may have biased the results.
Small sample size of clusters and the 1-year sampling time span are among the limitations in this study. However, they did not affect our conclusion because there have been no significant changes in industry, traffic and urbanisation construction in recent years and there have been stable levels of PM concentration in these areas for the past several years.34 ,37 The year-round daily mean PM concentration could be slightly on the high side relative to daily real-time monitoring concentrations published by official agencies since the PM sampling was conducted on non-rainy days. Thus, we used the ambient air quality standards for PM10 and PM2.5 with average concentration limits over 24 hours, not the yearly values. However, all the sampling and filter weighting processes were completed under the strict guidance of the environment protection department. The effect of the weather on each sampling point was quite consistent because the daily sampling proceeded almost synchronously and was restricted in Guangdong province. Another limitation is that our random sampling investigation might not have taken into account the possibility that participants moved to areas with more or less air pollution due to socioeconomic reasons. Nevertheless, migration, if any, might affect a limited number of individuals but not a large population. Moreover, subjects invited to participate were from the local registered population and had lived there for a long time when our investigation took place; in addition, the four cities in our study were located a long way from each other. These facts make such a migration effect less likely to play a role.
In conclusion, we have revealed that increased daily mean PM concentration is associated with higher COPD prevalence and lower lung function in a Chinese population with a relatively high level of ambient PM in southern China. More importantly, air pollution continues to impose a challenge to regulatory and health professionals in most countries around the world. Further research is needed to clarify the differential susceptibility to these pollutants and individual exposure differences, and to explore possible pathogenic mechanisms of COPD triggered by air PM.
References
Footnotes
Contributors Conceived and designed the experiments: PR; experiments: SL, YZ, WZ, DZ, XL, JP, LH, JC, BL; PM2.5 and PM10 concentrations measured and weighed: SL, SL; data collection: SL, XC; data analysis: SL, SL, YZ; wrote the first draft of the manuscript: SL, PR; contributed to writing the manuscript: SL, PR, SL, YZ, BL.
Funding The study was funded by Chinese central government key research projects of the 12th national five-year development plan grant no. 2012BAI05B01 (to PR), the National Natural Science Foundation of China grant no. 81170043 and 81470233 (to PR), and National Key Basic Research and Development Programme, 973 Program, no. 20l5CB553403 (to YZ).
Competing interests None declared.
Patient consent Obtained.
Ethics approval Ethical Society in Guangdong province.
Provenance and peer review Not commissioned; externally peer reviewed.