Article Text

Abstract
Background The obstructive sleep apnoea syndrome (OSAS) results from a combination of structural and neuromotor factors; however, the relative contributions of these factors have not been studied during the important developmental phase of adolescence. We hypothesised that adenotonsillar volume (ATV), nasopharyngeal airway volume (NPAV), upper airway critical closing pressure (Pcrit) in the hypotonic and activated neuromotor states, upper airway electromyographic response to subatmospheric pressure and the ventilatory response to CO2 during sleep would be major predictors of OSAS risk.
Methods 42 obese adolescents with OSAS and 37 weight-matched controls underwent upper airway MRI, measurements of Pcrit, genioglossal electromyography and ventilatory response to CO2 during wakefulness and sleep.
Results ATV, NPAV, activated and hypotonic Pcrit, genioglossal electromyography and ventilatory response to CO2 during sleep were all associated with OSAS risk. Multivariate models adjusted for age, gender, body mass index and race indicated that ATV, NPAV and activated Pcrit each independently affected apnoea risk in adolescents; genioglossal electromyography was independently associated in a reduced sample. There was significant interaction between NPAV and activated Pcrit (p=0.021), with activated Pcrit more strongly associated with OSAS in adolescents with larger NPAVs and NPAV more strongly associated with OSAS in adolescents with more negative activated closing pressure.
Conclusions OSAS in adolescents is mediated by a combination of anatomic (ATV, NPAV) and neuromotor factors (activated Pcrit). This may have important implications for the management of OSAS in adolescents.
- Sleep apnoea
Statistics from Altmetric.com
Key messages
What is the key question?
Although several studies have evaluated the pathophysiological basis for obstructive sleep apnoea in children and adults, little is known about the important transitional stage of adolescence; in particular, the relative contributions of structural and neuromotor factors to upper airway collapsibility in this population are unknown.
What is the bottom line?
This study shows that obstructive sleep apnoea syndrome in adolescents is mediated by both anatomic and neuromotor factors; in particular, adenotonsillar volume, nasopharyngeal airway volume and activated upper airway critical closing pressure (Pcrit) independently increase the risk for obstructive sleep apnoea.
Why read on?
This study provides a comprehensive evaluation of both anatomic and neuromotor contributors to obstructive sleep apnoea in adolescents compared with age-matched and weight-matched controls.
Introduction
The pathophysiology of the obstructive sleep apnoea syndrome (OSAS) has been investigated extensively in adults and to some degree in children. However, little is known about the important transitional stage of adolescence. Adolescence is associated with hormonal changes that affect upper airway structures1 and ventilatory control,2 as well as changes in somatic growth and cerebral remodelling.3 These developmental changes would be expected to affect upper airway patency during sleep. Furthermore, obesity has become very common during adolescence, affecting 17% of teenagers in the USA4 and putting them at increased risk for OSAS.
OSAS is thought to result from a combination of structural and neuromotor factors that lead to upper airway narrowing and dynamic collapse during sleep. The early literature debated the relative contributions of structure and neuromotor function to upper airway patency,5 ,6 but it is now recognised that both are important. In obese adolescents, OSAS is usually attributed entirely to obesity. However, we previously showed both anatomic and physiological differences in adolescents with OSAS compared with controls. Adolescents with OSAS had adenotonsillar hypertrophy and a smaller nasopharyngeal airway than controls,7 a more collapsible airway during both the activated state and the hypotonic state8 and blunted upper airway neuromotor reflex responses to subatmospheric pressure8 and hypercapnia9 during sleep. While these studies established important relationships with individual factors, the relative contribution and interaction of each of these physiological factors to OSAS risk is unknown; very few studies have evaluated both structural and functional components in the same individual.
The aim of this study was to comprehensively evaluate the major structural and neuromotor factors contributing to OSAS in obese adolescents. We hypothesised that both structural and neuromotor factors contribute significantly to OSAS and interact to increase risk beyond what would be expected from the additive combination of individual factors. Based on our previous publications, we specifically hypothesised that adenotonsillar volume (ATV), nasopharyngeal airway volume (NPAV), the upper airway critical closing pressure (Pcrit) in the activated and hypotonic states and the ventilatory response to CO2 during sleep would be major predictors of OSAS risk.
Methods
Detailed additional information on the methods is presented in the online supplementary material. Data were obtained from a comprehensive study examining the pathophysiology of OSAS in adolescents, and some components of this study have been published individually.7–10 Informed consent from guardians and assent from participants were obtained. Obese adolescents aged 12–16 years with OSAS and obese controls underwent hypercapnic ventilatory response testing (HCVR) and upper airway MRI awake; and polysomnography and measurement of genioglossal electromyogram (EMGgg) activity, Pcrit in the hypotonic and activated neuromotor states and the ventilatory response to CO2 during sleep. Due to the extensive resources required for testing, HCVR, EMGgg and CO2 responses during sleep were performed only on consecutive initial subsets of the population (N shown in table 1).
Summary of demographic and outcome variables
Supplemental material
Statistical analysis
Additional information is presented in the online supplementary material. Variables were compared between groups using t-tests and χ2 tests (parametric) and Wilcoxon and Fisher's exact tests (non-parametric). Logistic regression models, controlling for age, gender, race and body mass index (BMI) Z-score, examined associations between structural and neuromotor parameters and OSAS status. Continuous measures were standardised by subtracting the sample mean value and dividing by the SD. The area under the receiver operating characteristic curve (AUC) was used to compare model predictive values. The AUC estimates the probability that a randomly selected case has a larger predicted probability than a randomly selected control. To determine which variables to include in multivariate models, bivariate assessments of individual predictors and OSAS were performed; variables with p<0.05 were included in multivariate analyses. Partial Pearson's correlations, controlling for age, gender, race and BMI Z-score, were used to evaluate relationships between structural and functional variables and OSAS severity; multiple linear regression was used to assess independent effects. Pairwise interactions and response surface modelling (RSM) were used to examine the simultaneous association of any two factors on OSAS.11 ,12
Results
Study group
The sample (42 OSAS and 37 controls) was restricted to participants with available data on the primary predictors of interest (ATV on MRI and activated and hypotonic Pcrit). There were no significant differences between groups in age, gender, race, BMI Z-score (table 1) or Tanner stage (p=0.973). As previously reported,7 participants with OSAS had a larger ATV and smaller nasopharyngeal airway compared with controls. Moreover, participants with OSAS had a more collapsible upper airway, with a greater slope of the activated pressure–flow response curve and higher activated and hypotonic Pcrit. As previously reported,8 ,9 controls had a stronger (more negative) upper airway EMGgg response to subatmospheric pressure loading and a greater CO2 response during sleep, but no differences were observed between groups for the EMGgg slope under hypotonic conditions or the HCVR.
Bivariate associations of individual variables with OSAS risk
The results from logistic regression models examining associations between individual variables and OSAS risk are presented in table 2. All upper airway structure measures examined were significantly associated with OSAS risk. The combined ATV showed the strongest association, with a 2.5 times increased odds of OSAS (p=0.002) associated with a 1 SD increase. Similarly, smaller values of all nasopharyngeal airway measures were associated with OSAS risk; the strongest relationship was observed with NPAV, with greater volume related to decreased likelihood of OSAS (p=0.004). For neuromotor factors, higher (ie, more collapsible) activated (p=0.004) and hypotonic (p=0.001) Pcrit were associated with increased OSAS risk. Higher risk for OSAS was observed for both a less negative (blunted) activated EMGgg slope (p=0.036) and a lower (blunted) CO2 response during sleep (p=0.003). CO2 response showed the highest AUC statistic among all measures (AUC=0.915), although the available sample was relatively small (N=33).
Associations with OSAS status in obese OSAS and obese control participants
Multivariate associations with OSAS risk
Significant (p<0.05) associations were observed between OSAS and a number of variables in bivariate analyses. The most significant variables from lymphoid tissue (ATV) and nasopharyngeal airway size (NPAV) domains, as well as activated and hypotonic Pcrit values, activated EMGgg slope and CO2 response during sleep, were carried forward into multivariate analyses. Given the differences in the available sample sizes for these variables (see Methods), the combined effects were evaluated using the population subsets with non-missing values for all measures of interest. Primary analyses are presented adjusted for covariates (see online supplementary material for unadjusted estimates).
First, the combined effects of anatomic and neuromotor variables (table 3) were assessed within the full sample (42 OSAS, 37 controls). Models 1 and 2 illustrate the adjusted associations for anatomic and Pcrit variables only, respectively. In these domain-specific models, both ATV and NPAV were significantly associated with OSAS (table 3, Model 1), while the activated (p=0.068) and hypotonic (p=0.016) Pcrit measures showed borderline and significant associations, respectively (table 3, Model 2). When combining all measures (table 3, Model 3), there were significant associations with ATV (p=0.043), NPAV (p=0.003) and activated Pcrit (p=0.018), suggesting that each variable exerted an independent effect on OSAS risk in adolescents. After removing hypotonic Pcrit (which was not significantly associated) from this comprehensive model, higher ATV and activated Pcrit values and smaller NPAV were all associated with increased OSAS risk (table 3, final model). The model resulted in an AUC statistic of 0.867, suggesting strong predictive ability within this sample of adolescents.
Multivariate models in analysis sample with anatomic and Pcrit measures
Next, we examined whether activated EMGgg slope had an independent association with OSAS in models containing anatomic and neuromotor factors (table 4). Models assessing this association were fit on the subset of patients with available anatomic, Pcrit and EMGgg data (32 OSAS, 23 controls). Controlling for covariates in this smaller sample, activated EMGgg slope remained significantly associated with OSAS risk (p=0.044). This association remained significant in the full model (table 4, Model 4, p=0.040) and after removing hypotonic Pcrit (table 4, Model 5, p=0.043); ATV, NPAV and activated Pcrit also remained significant. Based on these results, it appears that activated EMGgg slope independently influenced OSAS risk in this small sample of adolescents, even after controlling for relevant covariates and significant anatomic and other neuromotor factors. However, as evidenced by the wide CI, larger samples are needed to obtain more robust estimates of the effect.
Multivariate models in sample with anatomic, Pcrit and activated EMGgg measures
As a final step, we examined the independent association with CO2 response during sleep within the smaller subset with available CO2, anatomic and neuromotor variables (16 OSAS, 17 controls). CO2 response remained significantly associated with OSAS after controlling for age, gender, race and BMI (OR (95% CI): 0.06 (0.01 to 0.50); p=0.010). However, due to the small sample size, we were unable to obtain a valid model fit for a model including covariates, ATV, NPAV and activated Pcrit. Thus, CO2 response remains an interesting potential predictor of OSAS risk, but larger samples are needed in order to assess its independent utility.
Associations with disease severity among participants with OSAS
The correlations between OSAS severity measures and the anatomic and neuromotor measures were examined among the adolescents with OSAS (table 5). Similar to analyses examining OSAS risk, higher values of ATV (r=0.66, p<0.0001) and activated Pcrit (r=0.36, p=0.027) were associated with a higher apnoea hypopnoea index (AHI) within the OSAS group, controlling for age, gender, race and BMI Z-score. Thus, these variables relate to OSAS risk and AHI severity. Moreover, ATV was associated with longer desaturation time (p<0.0001) and a lower arterial oxygen saturation (SpO2) nadir (p=0.003), but not with measures of hypercapnia. Tonsils showed stronger associations than adenoid for each severity measure (table 5). Activated Pcrit was also associated with desaturation time (p=0.037), but not with other gas exchange measures. Hypotonic Pcrit showed a borderline association with AHI (p=0.065) and a significant association with desaturation time (p=0.027). Interestingly, measures of nasopharyngeal airway size, which showed independent associations with OSAS risk, were not correlated with OSAS severity.
Adjusted* partial Pearson correlations with OSAS severity measures within adolescents with OSAS
Next, multivariate analyses were repeated examining whether the primary measures from multivariate models of OSAS risk were independently associated with OSAS severity among participants with OSAS (table 6). No measures were associated with hypercapnia degree or duration. Larger ATV was significantly associated with more severe OSAS in models adjusted for clinical covariates only or full models (all p<0.005). Thus, ATV appeared to be a robust and independent predictor of OSAS severity in adolescents. Although not significant in correlation analyses, there was an independent association between NPAV volume and percent sleep time with SpO2<90% in both covariate and anatomy only models and the full models. Conversely, Pcrit measures generally did not show associations in multivariate analyses, with only an association (p=0.012) between hypotonic Pcrit and percent sleep time with SpO2<90%. Thus, it appears that, within the current sample, although both anatomy and Pcrit were related to the risk of having OSAS, only anatomy showed consistent associations with disease severity.
Adjusted multivariate models for OSAS severity measures within adolescents with OSAS
Simultaneous associations of important risk factors
ATV, NPAV and activated Pcrit all showed evidence of independent associations with OSAS risk in the full sample. To evaluate the simultaneous associations of any two of these factors on the predicted probability of OSAS, we (1) tested whether there was evidence for pairwise interactions and (2) employed RSM, which allows the probability of OSAS to be modelled based on both linear and non-linear relationships.
When adding pairwise interaction terms individually to the main effects model including covariates, ATV, NPAV and activated Pcrit, a significant positive interaction between NPAV and activated Pcrit was observed (p=0.035). The results suggest that among adolescents with larger NPAV, increases in activated Pcrit had stronger associations with OSAS, whereas at smaller NPAV, increases in activated Pcrit were less important. For example, at an NPAV 1 SD above the mean, the adjusted OR for a 1 SD increase in activated Pcrit was 7.8 (2.3, 26.4), compared with 3.3 (1.5, 7.0) at the average NPAV and a non-significant OR of 1.4 (0.5, 3.7) at an NPAV 1 SD below the mean. Thus, the relationship between activated Pcrit and OSAS risk became stronger as NPAV increased. Similarly, among adolescents with more positive values of activated Pcrit, increased NPAV was less protective against OSAS, and among those with more negative Pcrit, decreases in NPAV size were more strongly associated with OSAS risk. There was no interaction between ATV and either NPAV (p=0.564) or activated Pcrit (p=0.819).
RSM was used to examine the simultaneous effects of each pair of measures. To interpret the relative contribution of individual components, note that the covariate only model (age, gender, ethnicity, BMI Z-score) resulted in an AUC=0.665 (p=0.174). Figure 1A shows the predicted probability from the RSM as a function of ATV and NPAV. Adolescents with larger ATV and smaller NPAV had a high predicted probability of OSAS (Point A), while participants with larger NPAV and smaller ATV had a very low probability (Point D). The full RSM resulted in an AUC=0.831 (p=0.001), showing strong predictive ability in this sample. When examining the AUC contribution of individual model components, variables involving NPAV had the greatest predictive value (p=0.073), followed by all variables involving ATV (p=0.111). There was limited evidence for a significant contribution from the quadratic terms (non-linear effects from terms involving squares (ie, NPAV2, ATV2, ATV•NPAV2 and NPAV•ATV2; p=0.602) or interaction effects between ATV and NPAV (p=0.887).

(A–C) 3D plots of the predicted probability (Pr) of obstructive sleep apnoea syndrome (OSAS) from response surface modelling (RSM) analyses are shown. High predicted probabilities of OSAS are shown in red, probabilities around 0.5 in grey and low predicted probabilities in blue. Points intersecting the edge of the cube (denoting the vertices of the probability plane) are highlighted in blue and labelled with letters (A–F). All axes are labelled qualitatively, with the primary predictor variables represented as standardised values, which are equal to the number of SDs above or below the sample mean. For reference, the mean (SD) values in the data were as follows: 18.561 (7.353) mm3 for adenotonsillar volume (ATV); 2.720 (1.419) mm3 for nasopharyngeal airway volume (NPAV) and −14.6 (9.7) cm H2O for activated critical closing pressure (Pcrit). Thus, for example, a standardised ATV value of 1.0 represents an underlying ATV of 25.914 mm3. (A) ATV and NPAV: the predicted probabilities from the RSM as a function of ATV and NPAV over the area where values were observed in the current population. There were no adolescents with a very large NPAV and large ATV and similarly no adolescents with a small NPAV and small ATV (see online supplementary figure S1A). The covariate only model (age, gender, ethnicity, body mass index (BMI) Z-score) had an area under the receiver operating characteristic curve (AUC) of 0.665 (p=0.174), compared with an AUC of 0.831 for the full RSM (p=0.001). The contributions to the overall AUC from individual RSM components were as follows: 0.036 (p=0.111) for ATV terms, 0.073 (p=0.073) for NPAV terms, 0.005 (p=0.887) for interaction terms and 0.023 (p=0.602) for quadratic terms. Highlighted points (standardised ATV, standardised NPAV, predicted probability of OSAS): A=(2.0, −1.4, 0.995); B=(−0.05, −1.4, 0.85); C=(−1.5, −0.4, 0.57); D=(−1.5, 2.05, 0.03); E=(−0.75, 2.05, 0.12); F=(2.0, 0.05, 0.92). Overall, adolescents with larger ATV and smaller NPAV had a high predicted probability of OSAS (Point A, Pr(OSAS)=0.995), while participants with larger NPAV and smaller ATV had a very low probability (Point D, Pr(OSAS)=0.03). For ATV ranging from 0 to 2 SD above the mean, adolescents with a small NPAV were predicted to have a ≥85% probability of OSAS regardless of ATV within that range (A, line AB) and similarly adolescents with large ATV were projected to have a ≥92% probability of OSAS for NPAV 1.4–0.05 SD below the population mean (line AF). Among those with smaller ATV, there was a decrease in the likelihood of OSAS as NPAV increased (line CD). In general, when holding NPAV constant, the risk of OSAS increased as ATV increased, although there are limited data at the extremes (eg, line DE). The full RSM, including pairwise interactions between squared and main effect terms, resulted in an AUC=0.831 (p=0.001), showing strong predictive ability in this sample. When examining the contribution of individual model components, variables involving NPAV had the greatest predictive value (p=0.073), followed by all variables involving ATV (p=0.111). There was limited evidence for a significant contribution from the quadratic terms (p=0.602) or interaction effects between the ATV and NPAV terms (p=0.887). (B) ATV and activated Pcrit: the predicted probabilities from the RSM as a function of ATV and activated Pcrit over the area with observed values in the current population. There were no adolescents with large ATV who also had very negative Pcrit values (see online supplementary figure S1B). The covariate only model (age, gender, ethnicity, BMI Z-score) had an AUC of 0.665 (p=0.174), compared with the AUC of 0.839 for the full RSM (p=0.001). The contributions to the overall AUC from individual RSM components were as follows: 0.093 (p=0.011) for ATV terms, 0.081 (p=0.054) for activated Pcrit terms, 0.025 (p=0.339) for interaction terms and 0.040 (p=0.431) for quadratic terms. Highlighted points (standardised ATV, standardised activated Pcrit, predicted probability of OSAS): A=(1.05, −1.05, 0.34); B=(−1.3, −1.05, 0.05); C=(−1.3, 1.4, 0.17); D=(3.3, 1.4, 1.00). Overall, adolescents with a larger ATV and a more positive activated Pcrit had over a 99.9% predicted probability of OSAS (Point D, Pr(OSAS)>0.999), while participants with a smaller ATV and a more negative activated Pcrit had the lowest probability (Point B, Pr(OSAS)=0.05). For ATV ranging from −1.3 SD below to 1.05 SD above the mean and a more negative activated Pcrit, the risk of OSAS remained low to moderate across values of ATV (line AB). Similarly, adolescents with a smaller ATV were projected to have a low to moderate risk of OSAS regardless of their activated Pcrit values (line BC). Among those with a more positive activated Pcrit, the model showed a strong impact of increasing ATV on increased risk for OSAS (line CD). In general throughout the probability region, when holding ATV as constant, activated Pcrit decreased (became more negative), so did the risk of OSAS. The full RSM, including pairwise interactions between squared and main effect terms, had good predictive ability in this sample, with an AUC=0.839 (p=0.001). When examining the predictive value of individual model components, predictors involving ATV (p=0.012) and activated Pcrit (p=0.054) were the most statistically significant. Once again, there was limited benefit to the overall model fit for the interaction (p=0.339) or quadratic (p=0.431) components of the RSM. (C) Activated Pcrit and NPAV: the predicted probabilities of OSAS as a function of activated Pcrit and NPAV. There were no adolescents with a large NPAV who also had very positive activated Pcrit values (see online supplementary figure S1C). The covariate only model (age, gender, ethnicity, BMI Z-score) had an AUC of 0.665 (p=0.174), compared with an AUC of 0.915 for the full RSM (p<0.0001). The contributions to the overall AUC from individual RSM components were as follows: 0.120 (p<0.0001) for activated Pcrit terms, 0.168 (p<0.0001) for NPAV terms, 0.056 (p=0.001) for interaction terms and 0.058 (p=0.007) for quadratic terms. Highlighted points (standardised activated Pcrit, standardised NPAV, predicted probability of OSAS): A=(1.7, −1.4, 0.99); B=(−1.05, −1.4, 0.70); C=(−1.05, 2.05, 0.00); D=(0.80, 2.05, 0.38); E=(1.7, 0.15, 0.45). The highest predicted probability of OSAS was observed for adolescents with a more positive activated Pcrit and smaller NPAV, as expected (Point A, Pr(OSAS)=0.99), and the lowest probability for those with a larger NPAV and a more negative activated Pcrit (Point C, Pr(OSAS)<0.001). All adolescents with very small NPAV had a moderate to high predicted probability of OSAS (line AB), although we note that there is some decrease in risk for the more extreme negative activated Pcrit values (Point B, Pr(OSAS)=0.70). Among those with a more negative activated Pcrit, there was a strong effect of NPAV, such that the predicted probability of OSAS decreased rapidly as the airway became larger (line BC). Assuming a larger NPAV, the predicted probability of OSAS remained ≤2.5% for activated Pcrit values from 0.6 SD above to 1.05 below the mean and began to rise from 0.6 to 0.8 SD above the mean activated Pcrit (line CD). As evidenced by the large region in the lower right corner of the RSM plot, for most combinations of a moderate to low activated Pcrit and moderate to large NPAV, the predicted probability of OSAS was <10%. For more positive values of activated Pcrit, the risk of OSAS was high to moderate, even as NPAV increased (eg, line AE), although the sparser data for larger NPAV and more positive activated Pcrit values are noted (see online supplementary figure S1C). Overall, this model had the highest AUC of the three RSMs (AUC=0.915, p<0.0001), with a combination of all terms involving NPAV (p<0.0001) or activated Pcrit (p<0.0001) and quadratic terms (p=0.007) significantly contributing to overall model fit. As suggested from the linear model interaction analyses, there was also a statistically significant impact of interactions between NPAV and activated Pcrit (p=0.001).
Figure 1B shows the predicted probability as a function of ATV and activated Pcrit. Adolescents with a larger ATV and a more positive activated Pcrit had a 99.9% predicted probability of OSAS (Point D), while participants with a smaller ATV and a more negative activated Pcrit had the lowest probability (Point B). The full RSM had strong predictive ability, with an AUC=0.839 (p=0.001). When examining the predictive value of individual components, predictors involving ATV (p=0.012) and activated Pcrit (p=0.054) were the most statistically significant. Once again, there was limited benefit to the overall model fit for the interaction (p=0.339) or quadratic (p=0.431) components of the RSM.
Figure 1C illustrates the predicted probabilities of OSAS as a function of activated Pcrit and NPAV. The highest predicted probability was observed for adolescents with a more positive activated Pcrit and smaller NPAV (Point A) and the lowest probability for those with a larger NPAV and a more negative activated Pcrit (Point C). This model had the highest AUC of the three RSMs (AUC=0.915, p<0.0001). All terms involving NPAV (p<0.0001) or activated Pcrit (p<0.0001), as well as quadratic terms (p=0.007), significantly contributed to overall model fit. As suggested from the linear model interaction analyses, there was also significant impact of interactions between NPAV and activated Pcrit (p=0.001).
Discussion
This study is the first to systematically evaluate both structural and functional risk factors for OSAS in adolescents. Adolescents have a high prevalence of OSAS,13 but few studies of OSAS have focused on the teenage years. Adolescence is associated with many developmental changes related to puberty, including increased linear growth and changes in the central nervous system. Thus, studies in younger or older populations cannot be extrapolated to the adolescent age group.
The primary finding of this study was that a combination of anatomic and neuromotor parameters, including increased ATV, smaller NPAV and higher activated Pcrit, were risk factors for adolescent OSAS (figure 2); with NPAV and activated Pcrit having a synergistic effect. Participants with the smallest NPAV and/or largest ATV and the most positive activated Pcrit were at the greatest risk for OSAS (figure 3). In addition, an increased CO2 response during sleep may be protective against OSAS, but larger studies are needed to evaluate this.
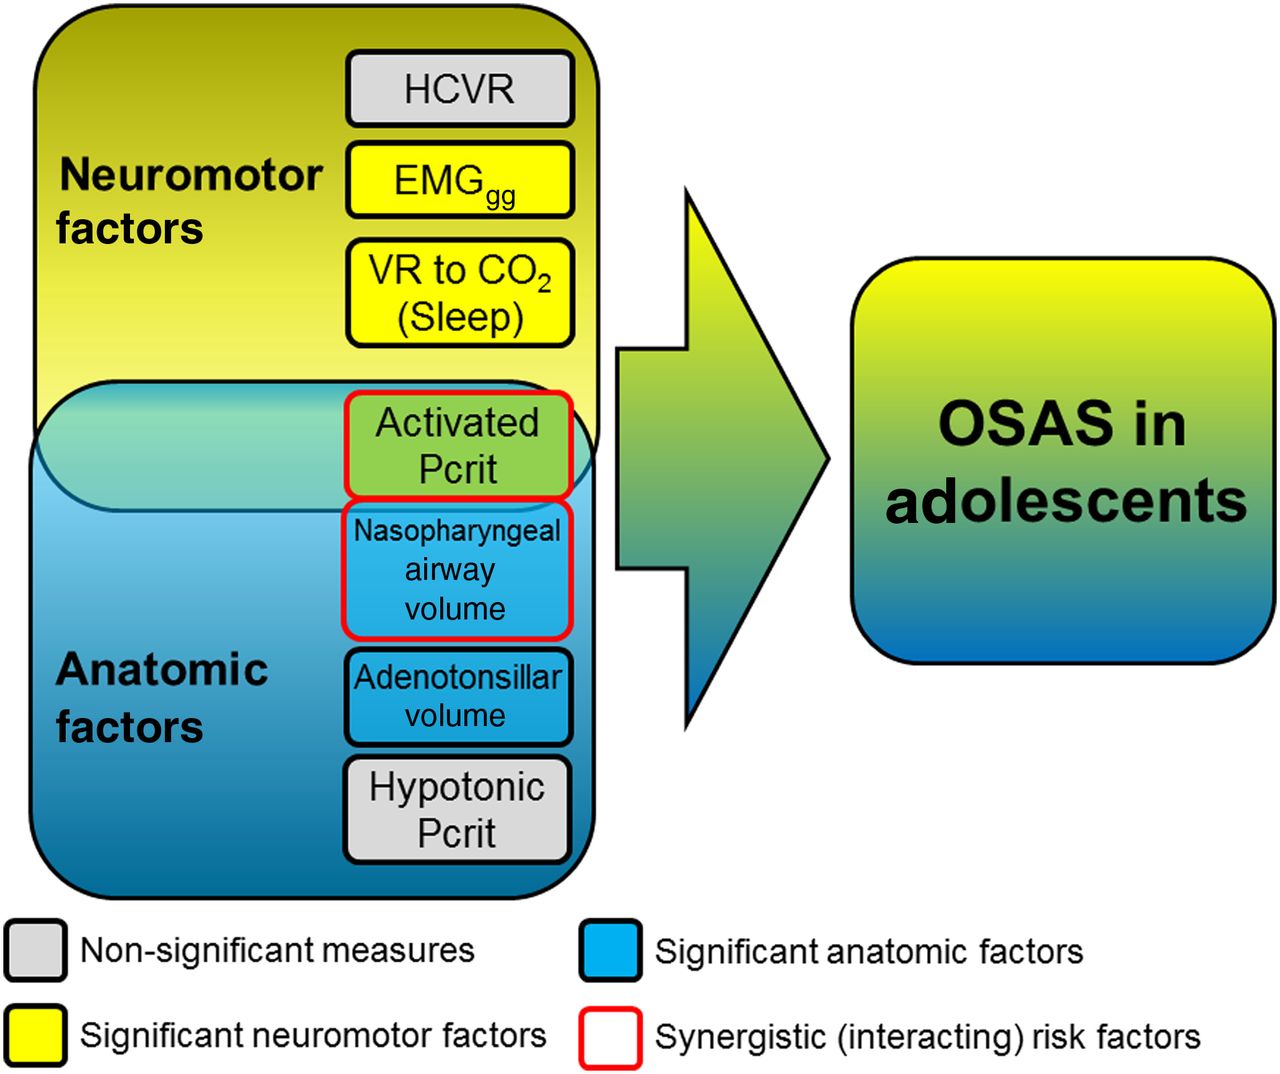
Putative pathophysiological factors for obstructive sleep apnoea syndrome (OSAS) are shown. Filled arrows show factors found to be significant, large open arrows show factors of interest that were underpowered in the current study and dotted arrows show factors that were not found to be significant. EMGgg, genioglossal electromyogram; HCVR, hypercapnic ventilatory response testing; VR, ventilatory response.

Schematic of interactive risk factors for obstructive sleep apnoea syndrome (OSAS) in adolescents showing the interaction between anatomic and neuromotor factors. Participants with the smallest nasopharyngeal (NP) airway volume/largest adenotonsillar volume and the most positive activated critical closing pressure (Pcrit) were at the greatest risk for OSAS.
Previous studies have evaluated either anatomic or neuromotor risk factors for OSAS, but the pathogenesis of the disease is likely to result from a combination of both, as supported by the current study. This would explain why OSAS improves after removal of anatomic burdens (eg, by adenotonsillectomy or weight loss), yet the presence or severity of OSAS cannot be predicted on an individual basis based on adenotonsillar size or degree of obesity. The finding that both anatomic and structural factors are relevant and synergistic has important therapeutic implications. Based on the findings, it is reasonable to consider adenotonsillectomy in adolescents with OSAS, even if obese. However, polysomnography should be repeated postoperatively to ensure that there is no residual OSAS due to underlying neuromotor deficits. New therapies that directly alter activated Pcrit, ranging from upper airway stimulation14 ,15 (not yet approved by the Food and Drug Administration for adolescents) to medications,16 are being developed.
Previous studies have shown that obesity is a major risk factor for OSAS, from infancy through adulthood.7 ,17–19 It has also been shown that adenotonsillar hypertrophy and a narrowed upper airway are risk factors for OSAS in children20 and adolescents.7 Fewer studies have addressed neuromotor factors. In the current study, we evaluated several neuromotor factors: activated Pcrit, EMGgg activation in response to subatmospheric pressure, HCVR during wakefulness and the ventilatory response to CO2 during sleep. Of these, activated Pcrit was found to be the most important functional risk factor. Pcrit has been measured in different ways. The hypotonic technique assumes that upper airway reflex responses to subatmospheric pressure develop over several breaths; thus, measurements during the first few breaths after a decrement in nasal pressure reflect a hypotonic airway.21 ,22 The level of upper airway collapsibility with this technique is therefore thought to represent primarily anatomic factors predisposing to obstruction.23 However, the airway is not totally atonic, as measurements of upper airway collapsibility under general anaesthesia and skeletal muscle paralysis give higher values than the hypotonic Pcrit.24 In this study, measurements of hypotonic Pcrit did not provide further information compared with direct MRI measurements of anatomy. The activated Pcrit measure is obtained by gradually decreasing upper airway subatmospheric pressure, thereby activating upper airway muscle reflexes.8 ,23 ,25 Thus, it is thought to reflect a combination of anatomic (ie, hypotonic Pcrit) plus neuromotor (activation of upper airway muscles) factors. In the current study, activated Pcrit was a significant predictor of OSAS, with the effect becoming stronger or weaker depending on the size of the nasopharyngeal airway. Previously, in the same cohort, it was shown that adolescents with OSAS had diminished EMGgg responses to subatmospheric pressure compared with controls. Similarly, the current study suggests that activated EMGgg is an independent risk factor, although larger samples are needed to obtain a robust effect size estimate.
The ventilatory response to CO2 during sleep was associated with increased risk for OSAS, although independence could not be fully evaluated due to the smaller numbers of participants. The ventilatory response to CO2 during sleep is likely a reflection of the effect of the central ventilatory drive on upper airway muscles. Previous studies have shown that the occlusion pressure in 1 ms (P0.1) correlates with upper airway collapsibility during sleep, but not wakefulness.26 Thus, blunted ventilatory drive in patients with OSAS appears to be sleep state specific. The hypercapnic ventilatory response during wakefulness was not found to be a risk factor for OSAS.
Although both anatomic and functional measures predicted OSAS risk, ATV volume was the primary variable associated with OSAS severity. Further studies are needed to determine the reasons for this. Given this association, adenotonsillectomy may be an important treatment for OSAS in obese adolescents.
Studies have elucidated the interaction of anatomic factors (assessed indirectly by hypotonic Pcrit) and neuromotor factors (EMGgg responses, arousal threshold and loop gain) in the pathophysiology of OSAS in adults.16 ,27 These studies showed variability in the traits, resulting in different individual risk profiles. The current study suggests that adolescents differ in the prominence of directly measured anatomic risk factors (ie, adenotonsillar hypertrophy) and neuromotor factors (activated Pcrit, ventilatory response to CO2 during sleep). Although arousal threshold was not measured in this study, previous studies suggest it is an important aetiological factor in paediatric OSAS.28 Loop gain was not measured in the current study, but is proportional to ventilatory drive,29 and the current study showed that the hypercapnic ventilatory drive during sleep was important in protecting against OSAS.
The strengths of this study include the detailed physiological assessments, the combination of examining anatomic and neuromotor factors to determine OSAS risk, the use of BMI-matched controls and robust statistical methodologies. Lean individuals were not included as OSAS is rare in non-obese adolescents in the absence of major neuromuscular or craniofacial disease. A limitation is that the study was underpowered for the CO2 evaluations. It should be noted that the model-determined probabilities depend on the percentage of OSAS cases in each analysis set, which was roughly 50%. Future studies should validate these findings using an independent group, as these results may not be generalisable to populations with different obesity or OSAS severity levels. Altogether, this study shows that both anatomic and neuromotor factors are important in the pathophysiology of OSAS in adolescents, and that these factors have a synergistic effect. Further studies examining the effect of treatment on these factors, and the longitudinal change in these factors across the developmental spectrum from children to adults, are warranted.
Acknowledgments
The authors thank all of the Children's Hospital of Philadelphia sleep laboratory and radiology technologists who helped conduct this study. We are grateful to the children and their families for their enthusiastic participation in this study.
References
Footnotes
Contributors CLM designed the study, analysed the data and drafted the manuscript. She is guarantor. BTK provided statistical analyses and assisted with manuscript preparation. JH, HY, SP, IET, CMC and DAT collected data, performed data analysis and reviewed the manuscript. RMB collected data, monitored data collection and approved the manuscript. CK, SB, F-LC and SW performed data analysis and reviewed the manuscript. GM provided statistical consultation and assisted with manuscript preparation. JT assisted with data collection and approved the manuscript. RJS performed data analysis and manuscript preparation.
Funding This study was supported by grants from the National Institutes of Health (HL058585, TR000003, HL089447, HL094307). Philips Respironics provided the airway pressure device to measure Pcrit.
Competing interests None declared.
Patient consent Obtained.
Ethics approval Children's Hospital of Philadelphia Institutional Review Board.
Provenance and peer review Not commissioned; externally peer reviewed.
Linked Articles
- Airwaves