Article Text

Abstract
Background Dyslipidaemia is an intermediary exacerbation factor for various diseases but the impact of obstructive sleep apnoea (OSA) on dyslipidaemia remains unclear.
Methods A total of 3582 subjects with suspected OSA consecutively admitted to our hospital sleep centre were screened and 2983 (2422 with OSA) were included in the Shanghai Sleep Health Study. OSA severity was quantified using the apnoea–hypopnea index (AHI), the oxygen desaturation index and the arousal index. Biochemical indicators and anthropometric data were also collected. The relationship between OSA severity and the risk of dyslipidaemia was evaluated via ordinal logistic regression, restricted cubic spline (RCS) analysis and multivariate linear regressions.
Results The RCS mapped a nonlinear dose–effect relationship between the risk of dyslipidaemia and OSA severity, and yielded knots of the AHI (9.4, 28.2, 54.4 and 80.2). After integrating the clinical definition and RCS-selected knots, all subjects were regrouped into four AHI severity stages. Following segmented multivariate linear modelling of each stage, distinguishable sets of OSA risk factors were quantified: low-density lipoprotein cholesterol (LDL-C), apolipoprotein E and high-density lipoprotein cholesterol (HDL-C); body mass index and/or waist to hip ratio; and HDL-C, LDL-C and triglycerides were specifically associated with stage I, stages II and III, and stages II–IV with different OSA indices.
Conclusions Our study revealed the multistage and non-monotonic relationships between OSA and dyslipidaemia and quantified the relationships between OSA severity indexes and distinct risk factors for specific OSA severity stages. Our study suggests that a new interpretive and predictive strategy for dynamic assessment of the risk progression over the clinical course of OSA should be adopted.
- Sleep apnoea
This is an Open Access article distributed in accordance with the Creative Commons Attribution Non Commercial (CC BY-NC 4.0) license, which permits others to distribute, remix, adapt, build upon this work non-commercially, and license their derivative works on different terms, provided the original work is properly cited and the use is non-commercial. See: http://creativecommons.org/licenses/by-nc/4.0/
Statistics from Altmetric.com
Key messages
What is the key question?
Dyslipidaemia is an intermediary exacerbation factor for various diseases and the impact of obstructive sleep apnoea (OSA) on dyslipidaemia remains unclear. Has research progress been hindered by linear and monotonic research strategies?
What is the bottom line?
Distinguishable sets of risk factors (including serum lipids) associated with different OSA severity stages independently.
Why read on?
Our study first revealed the multistage and non-monotonic relationships between OSA and dyslipidaemia and quantified the relationships between OSA severity indexes and distinct risk factors for specific OSA severity stages.
Introduction
Obstructive sleep apnoea (OSA) is a highly prevalent sleep disorder that affects 4% of adults.1 The main clinical manifestations of OSA are intermittent hypoxia, hypoxaemia, sleep fragmentation and excessive daytime sleepiness. The clinical consequences of OSA are contingent on its severity, the individual patient's susceptibility, and intricate associations between OSA and various comorbidities.2 ,3 Many neural, hormonal, thrombotic and metabolic pathways are malfunctional in patients with OSA, and most of those abnormalities are known to promote cardiovascular disease (CVD).4 ,5 Therefore, OSA has been considered a causative factor for CVD. This idea has gained support through the results of many cross-sectional, prospective and multicentre cohort studies.5–10 To explore the potential links between OSA and CVD, the role of metabolic disorders11 ,12 (including dyslipidaemia13) has drawn special attention, since it promotes CVD and always coexists with OSA.4 ,14
Many studies have attempted to address the relationship between OSA and dyslipidaemia but produced rather conflicting results (see reviews by Drager13 ,15 and Adedayo16). The reason underlying such conflicts is likely multifaceted, for example, the small sample sizes or inadequate adjustment for confounding covariates such as obesity, abdominal obesity, insulin resistance (IR) and excessive daytime sleepiness in previous studies.12 ,17–20 More importantly, there is an oversimplified assumption that dyslipidaemia is linearly related to OSA. The real relationship may be much more complex. In fact, the study of Shahar et al7 on the dose–effect relationship between the risk of CVD and OSA severity raised the possibility that a nonlinear relationship existed between the disorder in blood lipid homeostasis and OSA development.
Human diseases, especially chronic ones, are developed in a very complex manner, and the process of pathological development is influenced by many confounding factors and their interactions.21 When many risk factors are engaged, the causal relation for a complex disease is unlikely accounted for by a simple linear model. However, for research simplicity, a majority of studies aiming to explore a causal/correlation role of a factor in any given chronic disease often fit the data into a linear or log-linear model. These approaches might be justified for segmental description of a chronic disease or an acute disease itself, but is clearly deficient for studying the overall OSA–dyslipidaemia relationship seen across a long period of years. It is therefore highly desirable to develop a new analysis strategy that is solely based on raw data independent of any monotonic model assumption.
To explore if there is a nonlinear and even non-monotonic relationship between dyslipidaemia and OSA severity, we established a novel model adaptive strategy via mixed and multilevel statistical analyses to evaluate our data in a large sample across the whole range of OSA severity. Remarkably, our results reveal a nonlinear multistage relationship between the risk of dyslipidaemia and the severity of OSA, and establish a new set of quantitative indices that can be readily used both in clinical research on and management of dyslipidaemia in patients with OSA. The detailed clinical implications of our findings are herein discussed.
Methods
Patients and study design
The data reported in the present paper are from the Shanghai Sleep Health Study (SSHS) cohort, in which we consecutively recruited 3582 unrelated patients from January 2007 to July 2013 who were suspected to have OSA. All patients were hospitalised and observed in the Sleep Center of the 6th Affiliated Hospital of Shanghai Jiao Tong University. The sample comprised mainly residents of cities in southern China. Every participant was asked to complete a questionnaire regarding his or her history of illnesses. The exclusion criteria were (1) a history of continuous positive airway pressure (CPAP) treatment or upper airway surgery, (2) the use of nocturnal oxygen or oral appliances, (3) the use of lipid-lowering drugs, (4) unstable cardiopulmonary disease such as congestive heart failure or intrinsic pulmonary disease, (5) a drug dependency, (6) severe psychiatric disturbances, chronic kidney disease, or pregnancy, (7) alcoholism (for definition, see online supplementary materials), (8) systemic steroid treatment or hormone-replacement therapy, (9) sleep disorders other than OSA (such as upper airway resistance syndrome, restless leg syndrome or narcolepsy), and (10) unavailable clinical data (figure 1). Informed consent was obtained in writing according to the guidance of the National Ethics Regulation Committee of China. This study was approved by the Institutional Ethics Committee of the 6th Affiliated Hospital of Shanghai Jiao Tong University.
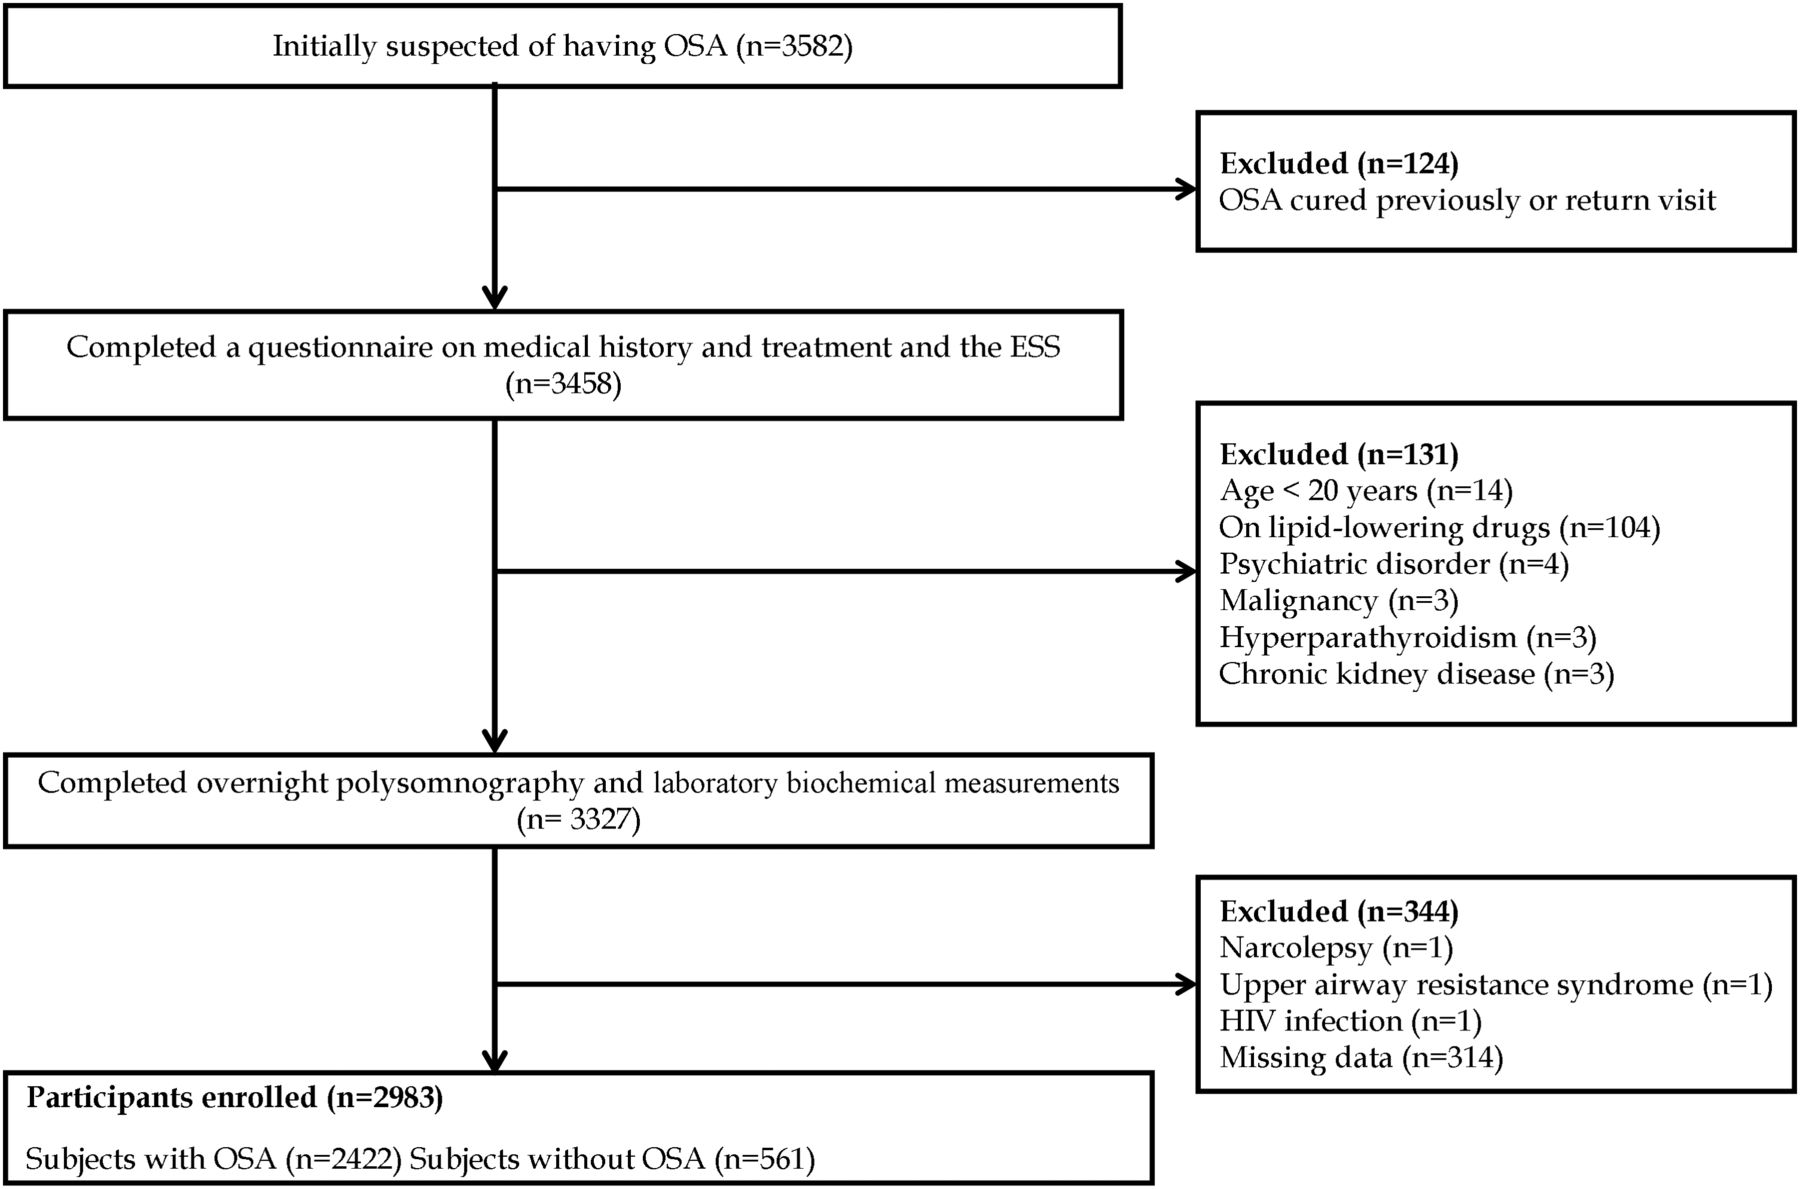
Enrolment flow chart for the study population. The Shanghai Sleep Health Study cohort included 3582 unrelated patients suspected to have obstructive sleep apnoea (OSA) who were consecutively recruited after being admitted to the hospital sleep centre from January 2007 to July 2013. In total, 2983 patients met the inclusion criteria and were enrolled in this study. ESA, Epworth Sleepiness Scale.
Please see the online supplementary materials and data for details regarding the following items: anthropometric measurements, the Epworth Sleepiness Scale (ESS) questionnaire, the definitions of polysomnography and sleep events, laboratory biochemical measurements, the definition and assignment of all variables (see online supplementary tables S1 and S2).
Statistical analysis
Normally distributed data are presented as means±SDs, skewed data are presented as medians with IQRs, and categorical data are presented as percentages. Differences in baseline characteristics among the four groups were examined using the Kruskal–Wallis H test, one-way analysis of variance (ANOVA), or the χ2 test according to the distribution characteristics of the data.
To determine whether dyslipidaemia is independently related to OSA severity, ordinal multivariate logistic regression analysis was performed in which the apnoea–hypopnea index (AHI) was ordered into four categories of OSA severity using current standards (<5.0, 5.0–14.9, 15.0–29.9 and ≥30.0). Ordinal multivariate logistic regression was used to model the associations between OSA indices and dyslipidaemia. The ordinal model specifies a log-linear relation for the odds of being in one category (eg, mild OSA (5.0≤AHI<15.0)) compared with being in a lower category (eg, normal (AHI<5.0)), and assumes proportional odds for any dichotomy in the four levels of OSA status. The following variables were included in the analysis: five lipid components (total cholesterol (TC), triglycerides (TGs), high-density lipoprotein cholesterol (HDL-C), low-density lipoprotein cholesterol (LDL-C) and apolipoprotein E (ApoE)) and the covariates age, glucose level, IR index, body mass index (BMI), waist to hip ratio (WHR), ESS score, sex, hypertension and smoking status. The assumption of proportional odds was verified by parallel line testing.
The association between OSA severity and the probability of dyslipidaemia for each lipid component (TC, TG, LDL-C, HDL-C, apolipoprotein A-I (ApoA-I), apolipoprotein B (ApoB) and ApoE) was quantitatively assessed using restricted cubic spline (RCS) modelling after adjustment against major covariates including age, sex, BMI, WHR and IR.7 ,22 Knots for the AHI, oxygen desaturation index (ODI) and arousal index (ArI) were identified in the RCS analysis using MATLAB 8.0 and the R software package (http://www.r-project.org/), and the knots of the AHI were referenced for subsequent analyses.
Segmented multivariate linear regression analyses were respectively performed against the lipid indices and all variables (age, sex, BMI, WHR, glucose level, IR, hypertension and smoking status) to verify potential interactions among these independent risk factors and OSA severity. After integrating the clinical definition of OSA severity and the OSA knots generated in our RCS analysis, the patients were regrouped according to the AHI into a new set of four severity stages, in which multiple stepwise regressions were performed using the AHI, ODI and ArI as dependent variables, respectively, against the independent risk factors listed above. Before further statistical analysis, collinearity diagnostics were performed to eliminate any possible multicollinearity among variables. Statistical analyses were performed using SPSS V.17.0.0 (SPSS, Chicago, Illinois, USA). p Values of <0.05 were considered to reflect statistical significance.
Results
Patients’ baseline characteristics
Of the 3582 patients initially recruited, 599 met the exclusion criteria (figure 1). The remaining 2983 patients were categorised into the following four groups of OSA severity according to current standards: no OSA (AHI<5, n=561), mild OSA (5≤AHI<15, n=505), moderate OSA (15≤AHI<30, n=478) and severe OSA (AHI≥30, n=1439). Table 1 summarises the baseline characteristics of all variables in each group. Consistent with previous reports, the percentages of female patients, non-smokers and non-drinkers, serum HDL-C and ApoA-I concentrations, and mean oxygen saturation (SaO2) and minimum SaO2 were negatively correlated with the AHI. However, BMI, neck circumference, waist circumference, hip circumference, WHR; serum concentrations of glucose, insulin, TC, TG, LDL-C, ApoB, and ApoE; IR; ESS score; the percentages of patients with dyslipidaemia, hypertension, and diabetes were positively correlated with the AHI. All changes were statistically significant (univariate analysis) with the exception of lipoprotein (a).
Characteristics of the groups classified according to OSA severity using current clinical definitions
Multivariate ordinal logistic analysis and dyslipidaemia stratification analysis
Multivariate ordinal logistic analysis was performed to examine the association between the AHI and lipid levels and thus determine whether and how OSA is associated with dyslipidaemia. Results were generated using the Logit link function, but none passed the parallel line test (p<0.05) (see online supplementary table S2). This result suggests that the ordinal linear model was not valid. This unsuitability of the ordinal log-linear model indicated that inadequate stratification of OSA might have concealed the actual correlations. Given the wide range of severity of OSA (AHIs (30–114)) and the fact that our sample was skewed toward high AHI values (1439 patients in the high-severity group), we engaged in further stratification to describe our data more clearly.
To explore this problem, we divided the patients in the OSA group of AHI>30 into quartiles corresponding to an AHI of 44.6, 57.7 and 70.4, yielding a seven-group stratification. The distribution patterns for the proportion of patients with dyslipidaemia shown under the two stratifications are compared in figure 2A and 2B (for the definitions of the variables, please see online supplementary table S1). When a traditional four-group stratification was used, a linear increase in the proportion of patients with dyslipidaemia was seen with an increasing AHI for every lipid component (figure 2A and table 1). However, under the seven-group stratification, the functions were not linear or monotonic (figure 2B): for some lipid components, the proportion of patients with dyslipidaemia decreased dramatically at very high AHI values. Obviously, conventional log-linear or linear models cannot reveal nonlinear or non-monotonic relationships between dyslipidaemia and OSA severity.

Distribution pattern of dyslipidaemia. The proportion of dyslipidaemia according to total cholesterol (TC), triglycerides (TG), high-density lipoprotein cholesterol (HDL-C), low-density lipoprotein cholesterol (LDL-C), apolipoprotein E (apoE), apoA-I and apoB in each group is shown. (A) Current four clinical categories. (B) The severe obstructive sleep apnea group (apnoea–hypopnea index (AHI) ≥30) was further divided equally according to quartile.
Nonlinear model RCS analysis
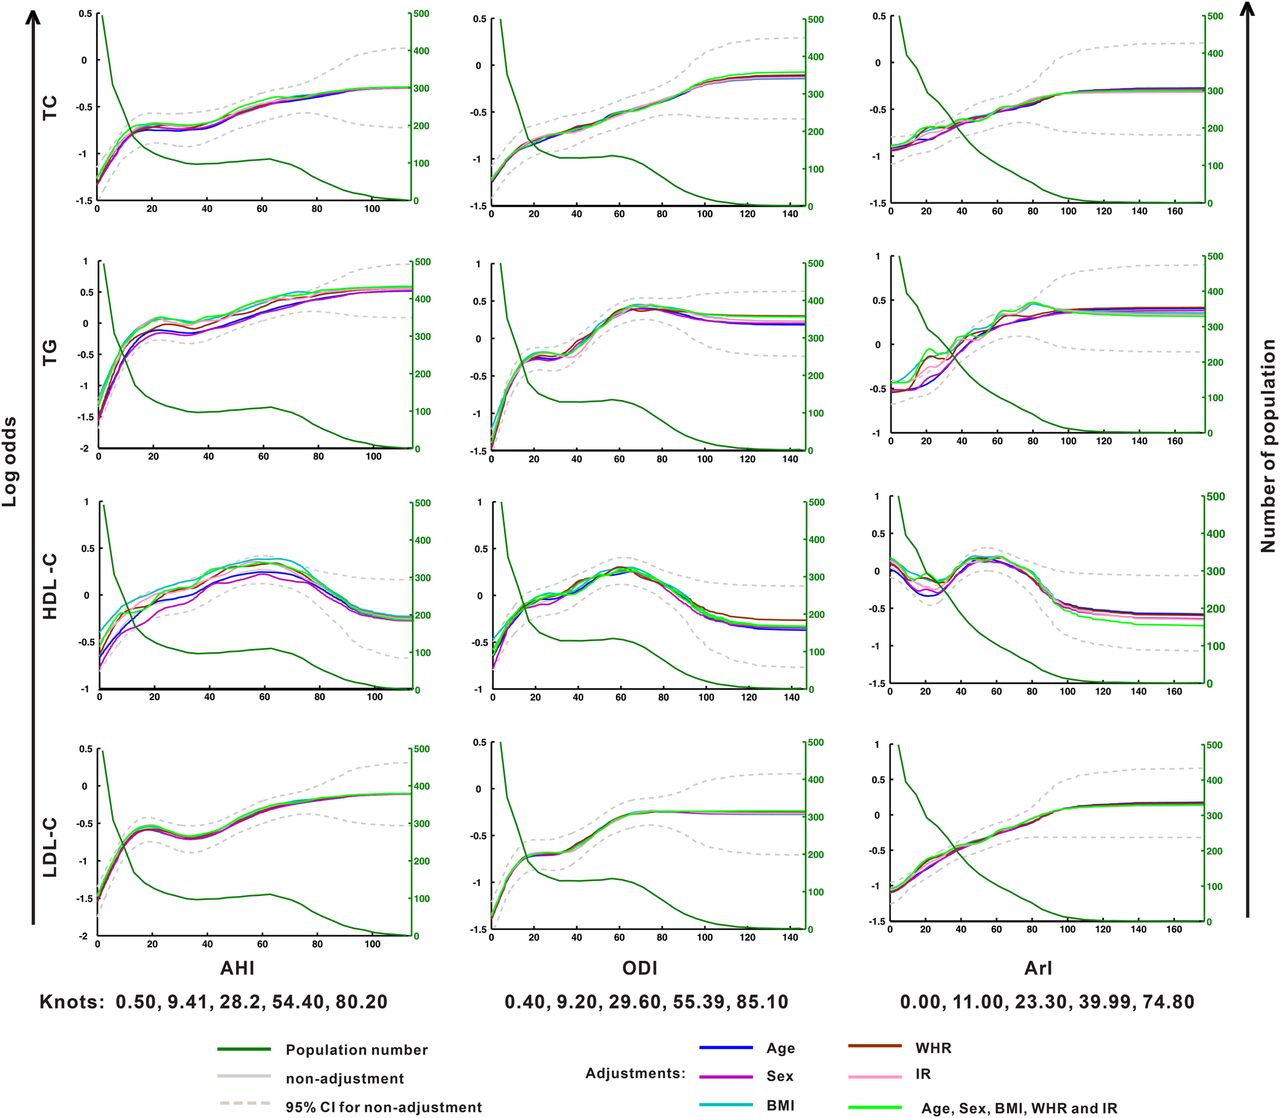
To delineate the dose–effect relationship between the risk of dyslipidaemia and OSA severity, the serum concentration of each lipid component was first defined as either normal or abnormal according to the diagnostic criteria (see online supplementary table S1). This information was then used in RCS analysis to establish the functions between the log odds of dyslipidaemia (figure 3, left y-axis) for each lipid component and the AHI, ODI and ArI, respectively, under adjustments for five covariates (age, sex, BMI, WHR and IR), independently and in combination. The results are shown in figure 3 (TC, TG, LDL-C and HDL-C) and online supplementary figure S1 (ApoA-I, ApoB and ApoE), in which each panel exhibits one lipid against one OSA index. For simplicity, only the 95% CI is shown for the unadjusted data (dashed lines). The dyslipidaemia risk curve of each lipid varied slightly across the adjustments against the different covariates, suggesting that the stability and robustness of RCS modelling were ensured by the large sample size.
Restricted cubic spline regression of the multistage correlation patterns between dyslipidaemia and the severity of obstructive sleep apnoea (OSA) (showing total cholesterol (TC), triglycerides (TG), high-density lipoprotein cholesterol (HDL-C) and low-density lipoprotein cholesterol (LDL-C) data). The left y-axis represents the log odds of dyslipidaemia for each serum lipid level. The right y-axis represents the number of patients. The x-axis represents the continuous values of the apnoea–hypopnea index (AHI), oxygen desaturation index (ODI) or arousal index (ArI). The population number for each OSA severity measure unit is indicated by the green line. BMI, body mass index; IR, insulin resistance; WHR, waist to hip ratio.
Notably, the risk of any lipid factor did not increase linearly with OSA severity. The presence of plateaus in many curves provided evidence of this nonlinearity and non-monotonicity. For example, the change in the risk of LDL-C disorders against the AHI and ODI exhibited a rapid rise during the mild stage of OSA (AHI<10), followed by a ‘plateau’ throughout the moderate to severe stages and then a tardily rising period associated with further increase in OSA severity. Such a plateau was seen in many panels in which the OSA severity was quantified by the AHI and ODI (figure 3). Further evidence of this nonlinearity was the non-monotonic feature of many curves: the lipid risk did not always grow with increasing OSA severity, but sometimes decreased with greater OSA severity (see figure 3 and online supplementary figure S1, see the HDL-C and ApoA-I data). Interestingly, a similarity was observed between the AHI curves and ODI curves for every lipid factor investigated; no such similarity was seen between AHI/ODI and ArI.
For further analysis, knots for the AHI, ODI and ArI were calculated from the curves in figure 3 using the MATLAB and R software (AHI: 0.4, 9.2, 29.6, 55.4 and 85.1; ODI: 0.5, 9.4, 28.2, 54.4 and 80.2; ArI: 0.0, 11.0, 23.3, 39.9 and 74.8).
Segmented stepwise multivariate linear regression
To explore independent associations between dyslipidaemia and OSA severity after multistage patterning, a segmented multivariate linear regression analysis was used to identify risk factors. Because the current clinical categorisation standard for OSA severity is mainly based upon the AHI, we used this index for regression. However, based upon the AHI knots generated by RCS analysis, we regrouped the patients into a new set of four-stage groups: AHI<10, 10≤AHI<30, 30≤AHI<55 and AHI ≥55 (see online supplementary table S3 for the baseline data of the new groups). In each stage, we performed multivariate linear regressions between each of the three indices of OSA severity and the risk factors of dyslipidaemia with selected lipid components (LDL-C, HDL-C, TG and ApoE), and the covariates of dyslipidaemia (such as BMI, WHR, etc) based upon the multicollinearity analysis. Surprisingly, the risk factors for dyslipidaemia and the covariates were differentially associated with three OSA severity indices (the AHI, ODI and ArI) across different OSA stages. These results are shown in 4×3 models (four stages and three indices of OSA severity) (tables 2⇓–4).
Segmented multivariate stepwise regression analysis (dependent variable—apnoea-hypopnea index (AHI))
Segmented multivariate stepwise regression analysis (dependent variable: oxygen desaturation index (ODI))
Segmented multivariate stepwise regression analysis (dependent variable: arousal index (ArI))
When OSA severity was indexed by AHI, BMI and/or WHR (the indicators of obesity or central obesity) were always independent risk factors across all four stages. Notably, in stages II and III, BMI (β=0.163, p=0.029) and WHR (β=16.671, p=0.002), but not other factors were risk factors associated with the AHI. However, age, sex, IR, ESS score and hypertension were risk factors only in stages I and IV, and the serum glucose level was an associated factor only in stage IV. LDL-C (β=0.331, p=0.009) was the only lipid component that was an independent risk factor in stage I (table 2).
When OSA severity was indexed by ODI, ApoE was the only lipid component that was an independent risk factor only in stage I (β=−0.453, p=0.016). IR and BMI remained as independent risk factors in all four stages, and were dominant risk factors in stages II and III. Sex was an independent risk factor in stages II and IV. No lipid component appeared to be a risk factor in stages II and III (table 3).
Only when the OSA severity was indexed by the sleep fragmentation index-ArI, serum lipids appear as actively independent risk factors. In fact, HDL-C remained an independent risk factor, with only slight changes in the regression coefficients for all stages, whereas ApoE, LDL-C and TG remained as risk factors in stages II–IV (table 4).
Discussion
In the present study, we mapped a nonlinear, multistage relationship between the severity of OSA and the risk of dyslipidaemia. Complicated changes in the risk of dyslipidaemia were revealed in association with distinct stages of OSA severity. Such complexity was evident in the quantitative relationships between OSA severity revealed by different indices and specific lipid-related risk factors for each index.
The first important finding of this study is the clear multistage and non-monotonic relationship between dyslipidaemia and OSA severity. Our data showed that the risk of lipid disorders did not linearly increase with OSA exacerbation, but rather plateaued, and even non-monotonic patterns were evident at certain OSA stages. A plateau in the relationship between CVD and OSA was revealed in the Sleep Heart Health Study by Shahar et al,7 which focused on patients with a moderately elevated AHI. However, the plateau was attributed to the inherent limitations of the portable device used for AHI testing, rather than to a real trend in the relationship.7 As laboratory-standard polysomnography was used in the present study, we believe that the complex curves and the plateau reflect the genuine presence of a multistage nonlinear dose–effect correlation between the risk of dyslipidaemia and OSA severity.
The mechanisms underlying the plateau are unclear, but are likely associated with protective adaptations evident in many aspects of system homeostasis. For example, during highland anoxia, protective adaptation reduces the incidence of myocardial infarction.23 Additionally, ischaemic preconditioning24 exerts a cardio-protective benefit if applied within the appropriate paradigm. As in sleep apnoea, intermittent hypoxia may have either beneficial or detrimental effects according to the severity and duration of exposure.3 Therefore, the plateau with lipid metabolism is likely to be the result of an adaptation that may cause remodelling of lipid homeostasis in patients with chronic intermittent hypoxia and long-term sleep fragmentation in OSA.
The second important finding is that the OSA indices are differentially associated with different risk factors in different stages of OSA. Because obesity is closely related to both dyslipidaemia and CVD, the BMI and WHR have been traditionally considered as important confounding factors for OSA. However, previous reports have shown different and even conflicting outcomes. For example, in a large community-based sample25 and a clinical sample of older patients,26 OSA quantified by the AHI was reported to be positively correlated with the lipid abnormalities but was independent of BMI. However, in a study by Sharma et al18 OSA was associated with obesity (BMI), but not lipid levels. We found that, in both stages I and IV, lipid factors were associated with OSA severity as indicated by the AHI; in stages II and III, however, only BMI and WHR were independently associated. Previous studies might have been biased toward different stages of OSA because of small sample size. Therefore, earlier results might have revealed only one phase of the correlation pattern between dyslipidaemia and OSA, creating conflicting conclusions. Our findings may help us to comprehend the uncertainties of previous reports, but also provide a new framework for comprehensive clinical investigation and treatment of relationships between dyslipidaemia and OSA severity.
In this work, we have demonstrated that OSA severity indices are associated with different lipid risk factors (tables 2⇑–4). A large number of previous studies used only the AHI25 ,27 ,28 or ODI29 to quantify the severity of OSA. Our study was the first to simultaneously use three indices, including the ArI. The AHI, ODI or ArI alone may not comprehensively or accurately indicate the severity of breathing and sleeping disorders or their impacts on lipid metabolism.5 ,20 ,30 Specifically, the ArI was strongly associated with the risks of multiple lipid components. This interesting finding suggests that sleep fragmentation as quantified by the ArI is an important parameter when studying the relationship between OSA and dyslipidaemia, especially moderate and severe OSA. However, the results also suggest that further investigations are required to explore the implications of different indices.
Our data indicate that the risk of HDL-C disorders decreased with OSA severity at an AHI of ≥55. This is an intriguing finding that necessitates further investigation because an increasing HDL-C level is currently used as a major protective index of serum lipids in patients with CVD.31 Therefore, whether an increasing HDL-C level contributes to a lowered risk of CVD in patients awaits further evaluation.32 ,33
Our study was based on an unusually large sample size in terms of OSA severity (1439 cases), which ensured the accuracy of the data for the population with 30≤AHI≤80. However, among the 1439 patients, only 153 (10.6%,) had an AHI≥80. Thus, as shown in figure 3, the 95% CI for this population was very broad.
The identification of a non-linear and non-monotonic pattern between the risk of dyslipidaemia and the severity of OSA, as revealed in our study, has several important clinical implications. The unique strategy used in this study allowed us to unravel the complex nature of the interactions of multiple risk factors. This would have been impossible with a simple linear model. Our results go far in explaining the discrepancies in interventional and prospective studies34–37 as well as in observational studies18. This is best exampled by our findings regarding patients in stage I (figure 3), in whom dyslipidaemia increased with OSA exacerbation; in these patients, CPAP treatment might reduce dyslipidaemia significantly. By contrast, in plateau stage II disease, dyslipidaemia development was not associated with OSA exacerbation such that these patients are unlikely to respond to CPAP. Taken together, our results suggest that mixed and multilevel statistical models can be used to evaluate and quantify the complicated relationship between OSA and other chronic diseases.
Although it was based on clinical samples analysed using a cross-sectional approach, this observational study was of high quality and was optimised by large-scale sampling, strict data acquisition and innovative analytical approaches (including hierarchical modelling, determination of dose–effect relationships, and adequate control of potential confounders), in line with the guidelines for evidence-based medicine.38 In addition, our study was large scale and used data collected by laboratory-based polysomnography, including patients with a wide range of AHIs. This strategy of sample collection reduced the risk of selection bias and met our goal of exploring the relationship between dyslipidaemia and OSA severity. Although a causal role of a factor to a disease is to be revealed by an interventional or a prospective study, it is not readily feasible for OSA and dyslipidaemia, such as ethical issue.39 To avoid bias, study of the OSA–dyslipidaemia relationship must follow the subjects from the very beginning of OSA for a long period to cover the multiple stages of OSA development. Additional large-scale, well designed randomised controlled trials featuring good adherence to therapy and long-term follow-up are required.40
In our study, as in most other studies, there were numerous confounding factors that were difficult to overcome. For example, alcohol consumption is well known to influence lipid metabolism. Although we excluded alcoholism, the lack of a covariate of alcohol consumption was a deficiency of our study.
Conclusions
A multi-stage relationship exists between OSA severity and dyslipidaemia, and the definition of unique risk factors for each stage lays a solid foundation for better understanding of OSA relative to CVD and other comorbidities.
Acknowledgments
The authors thank Professor Lu-Yang Wang (SickKids Research Institute and Department of Physiology, University of Toronto) for constructive comments on our manuscript.
References
Supplementary materials
Supplementary Data
This web only file has been produced by the BMJ Publishing Group from an electronic file supplied by the author(s) and has not been edited for content.
- Data supplement 1 - Online supplement
Footnotes
Contributors SY and JG had full access to all of the data in the study and take responsibility for the integrity of the data and the accuracy of the data analysis. Study concept and design: JG, YW and SY. Acquisition of data: JG, HY, JZ, LM, XT, HZ, DY, HZ and KS. Analysis and interpretation of data: JG, YW, JZ, MY, HC and SY. Drafting of the manuscript: JG, JZ, MY, YW and HC. Critical revision of the manuscript for important intellectual content: YS and JW. Statistical analysis: JG, JZ, MY and HC. Obtained funding: SY. Administrative, technical, or material support: SY and JG. Study supervision: SY.
Funding This study was supported by grants-in-aid from the Science and Technical Committee of Shanghai in China (07JC14029) and Shanghai Shen-Kang Hospital Management Centre Project of Shanghai (SHDC12010209).
Competing interests None declared
Patient consent Obtained.
Ethics approval The Institutional Ethics Committee of the Hospital of Shanghai Jiao Tong University approved the study.
Provenance and peer review Not commissioned; externally peer reviewed.