Article Text

Abstract
Background Clinical trials in cystic fibrosis (CF) have been hindered by the paucity of well characterised and clinically relevant outcome measures.
Aim To evaluate a range of conventional and novel biomarkers of CF lung disease in a multicentre setting as a contributing study in selecting outcome assays for a clinical trial of CFTR gene therapy.
Methods A multicentre observational study of adult and paediatric patients with CF (>10 years) treated for a physician-defined exacerbation of CF pulmonary symptoms. Measurements were performed at commencement and immediately after a course of intravenous antibiotics. Disease activity was assessed using 46 assays across five key domains: symptoms, lung physiology, structural changes on CT, pulmonary and systemic inflammatory markers.
Results Statistically significant improvements were seen in forced expiratory volume in 1 s (p<0.001, n=32), lung clearance index (p<0.01, n=32), symptoms (p<0.0001, n=37), CT scores for airway wall thickness (p<0.01, n=31), air trapping (p<0.01, n=30) and large mucus plugs (p=0.0001, n=31), serum C-reactive protein (p<0.0001, n=34), serum interleukin-6 (p<0.0001, n=33) and serum calprotectin (p<0.0001, n=31).
Discussion We identify the key biomarkers of inflammation, imaging and physiology that alter alongside symptomatic improvement following treatment of an acute CF exacerbation. These data, in parallel with our study of biomarkers in patients with stable CF, provide important guidance in choosing optimal biomarkers for novel therapies. Further, they highlight that such acute therapy predominantly improves large airway parameters and systemic inflammation, but has less effect on airway inflammation.
- Cystic Fibrosis
- Imaging/CT MRI etc
- Lung Physiology
Statistics from Altmetric.com
Key messages
What is the key question?
-
What are the optimal biomarkers to track clinical improvement in patients with cystic fibrosis (CF) following treatment of an acute exacerbation?
What is the bottom line?
-
In this three-centre observational study we report on a range of novel and conventional measures of CF disease activity across all the key domains (symptoms, lung physiology, lung structure and pulmonary and systemic inflammation) in response to a standard intervention (intravenous antibiotic course). We found major improvements in large airway parameters (spirometry, CT measures of mucus load) and systemic inflammation, with more subtle improvements in lung clearance index. Response in pulmonary markers of inflammation was more variable and showed less consistent correlation with other measures.
Why read on?
-
This study represents an important step in biomarker assessment, presents data on a wide range of novel and conventional measurements, and offers potential insights into the underlying pathophysiology of response to treatment in CF.
Introduction
The issue of how best to measure response to therapies in cystic fibrosis (CF) is not a new one.1 ,2 Clinical trial outcome measures should optimally fulfil a number of requirements: a clear difference between patients with CF and healthy controls; relevance to the underlying pathology; capable of being undertaken at multiple sites; an intra-subject and inter-subject variability which would allow a clinical trial to be performed in a pragmatically achievable number of patients with CF; and showing changes with conventional treatment (ie, a positive control).2 Currently, the only primary pulmonary endpoint recommended by the European Medicines Agency for CF clinical trials is the forced expiratory volume in 1 s (FEV1),3 yet the limitations of this measurement as a trial outcome have been recognised by CF researchers for many years.1
The UK CF Gene Therapy Consortium (http://www.cfgenetherapy.org.uk) conducted this study to aid identification of optimal trial outcome measures. We assessed a panel of conventional and novel assays in response to treatment for a pulmonary exacerbation with intravenous antibiotics. Most CF exacerbation studies have included relatively small numbers of subjects (n=7–32) and a restricted number of biomarkers.4–14 We considered these findings too limited to inform our understanding of the potential effects of pulmonary gene therapy on the CF airway. This study provides a comprehensive and coordinated assessment of all five key domains of CF lung disease: symptoms, physiology, structure, and pulmonary and systemic inflammation.
Our aims were to assess the response to treatment of an exacerbation in a broad range of outcomes to establish those that changed appropriately and might be used in future clinical trials. In addition, we hoped to explore relationships between different domains of CF lung disease to broaden our understanding of the pathophysiology and effects of pulmonary exacerbations.
Methods
This study was performed at three university hospital sites: Royal Brompton and Harefield NHS Foundation Trust, London; Western General Hospital, Edinburgh; and Royal Hospital for Sick Children, Edinburgh. This was a longitudinal analysis of patients with CF, aged 10 years and over, treated for a pulmonary exacerbation with intravenous antibiotics. The decisions on when to commence treatment, the choice of antibiotics and any additional therapies, and the duration of treatment were made by the clinical CF team, independent of the research group. Patients were excluded if FEV1 was less than 30% predicted, or if they received systemic corticosteroids during the study or preceding month (to avoid confounding influences on inflammatory markers). Full inclusion and exclusion criteria are provided in the online supplement.
Participants were requested to complete a series of assessments (table 1) in a structured order at two time points: visit 1 (V1), within 72 h of commencing intravenous antibiotics for a pulmonary exacerbation, and visit 2 (V2), within 5 days of completion of therapy.
Summary of assays performed at start and end of exacerbation in order of sequence performed
The study was approved by the Lothian Research and Ethics Committee, and the Royal Brompton, Harefield and NHLI Research Ethics Committee. All subjects signed informed consent and paediatric subjects gave their assent for inclusion.
Clinical assays
Full details of all the assays and techniques are given in the online supplement.
Symptoms
Symptoms were assessed on a five-point scale developed for this study and designed to reflect intra-subject acute change in major respiratory symptoms. Patients scored each of seven symptom-related questions from –2 (much worse than normal) to +2 (much better): the final summed score thus ranged from –14 to +14.
Lung physiology
Spirometry
FEV1 and mid-expiratory flows were expressed as SD scores, or z scores, using the modified National Health and Nutrition Examination Survey III reference ranges.15 For comparison, FEV1 was also expressed as percent predicted using separate reference ranges for adults (≥17 years)16 and children (≤16 years).17
In nine cases V2 spirometry was not recorded using the EasyOne spirometer. For these patients, we substituted both FEV1 values with those obtained from a portable spirometer previously provided to the patient (Piko-6, Ferraris Respiratory, Hertford, UK). This substitution was only performed if spirometry had been recorded on the portable device at both study visits and furthermore these readings had been shown to be reliable (ie, absence of outliers defined by >2 SD from within-patient means on repeated measures analysis of variance (ANOVA); see online supplement). If portable spirometer data could not be used to substitute for incomplete spirometry, FEV1 for that patient was treated as missing.
Lung clearance index
Multiple breath washout was performed as previously described18 using a modified Innocor (Innovision, Odense, Denmark) gas analyser and 0.2% sulfur hexafluoride (SF6) as the tracer gas.
Pulmonary markers of inflammation
Sputum was expectorated spontaneously or induced as previously described.19 Sputum plugs were harvested and processed in dithiothreitol before storage at –80°C. Details of individual assays are given in the online supplement.
Systemic markers of inflammation
Venous blood was analysed locally for full blood count and C-reactive protein (CRP). Serum was separated from whole venous blood by centrifugation and stored at –80°C. Details of individual assays are given in the online supplement.
CT assessment of lung structure
Contiguous thin-section chest CT images were acquired at inspiration without contrast. Anonymised images were scored by two independent radiologists blinded to clinical details, based upon a previously described grading methodology (see online supplement for details).20
Statistical analysis
Data were analysed using Prism and SPSS version 19. Normal distribution was assessed using the D'Agostino and Pearson omnibus normality test. Results are quoted as mean (SD) or median (IQR) values unless otherwise stated. No attempt was made to substitute missing data.
Skewed data were log transformed prior to analysis. A paired t test was used for comparison of change in variables between paired visits and comparisons between multiple groups were performed using a one-way ANOVA and Tukey's honestly significant difference test. Biomarkers reported as below the lower limit of the assay have all been ascribed a value equal to the lower limit of detection (see online supplementary table E1).
Correlations between different assays were performed on assessments performed at V1, and included all those with valid assessments at that visit even if subsequent assessments were missing or excluded because of protocol violation. Correlations were assessed using the Pearson correlation coefficient (normally distributed data) or Spearman rank correlation (skewed data). Change in assays was calculated as the V2 value minus the V1 value. A p value of below 0.05 was considered statistically significant.
Multiple correlations are presented in the online supplement (see tables E5–E11). These are intended to assist generation of hypotheses about the pathophysiology of CF and response to therapy and are therefore presented in full, with no correction for multiple comparisons.
Results
Patient demographics and clinical characteristics
Forty-six patients consented to participate in the study. Two patients were subsequently excluded for concomitant use of oral corticosteroids; cross-sectional data correlations from V1 were therefore performed on 44 patients. Longitudinal data are presented on 38 patients: six V2 assessments were excluded because of excessive time delay (n=2) or non-attendance (n=3) at V2, or because of commencing oral corticosteroids between assessments (n=1) (see online supplementary figure E2).
Demographic data are summarised in table 2. Twenty-six patients (59%) were chronically colonised with Pseudomonas aeruginosa (see online supplement for further details). Details on treatments are given in the online supplement. Thirty-six (95%) V1 assessments were performed within 24 h of starting intravenous antibiotics and 31 (82%) V2 assessments within 48 h of completion of intravenous antibiotics.
Demographics and symptoms at start of treatment
Change with treatment of exacerbation
A summary of the changes in individual assays is given in table 3.
Summary of changes after antibiotic treatment
Symptoms and clinical observations
Following treatment, total symptom score improved by an average of 9.5 points (figure 1). Mean symptom score at V2 (2.8) was significantly higher than zero (p<0.01).

Effect of antibiotics on total symptom score. Each pair of points represents a single subject. Horizontal grey lines represent group means. A symptom score of 0 represents no change from usual baseline for that patient.
Consistent with previous observations on haemodynamic response to treatment of an exacerbation, there were small but statistically significant decreases in mean HR, relative risk and diastolic blood pressure with treatment.21
Lung physiology
There were significant improvements in FEV1 and forced vital capacity (figure 2A). FEV1 percent predicted increased by a mean of 9.6 absolute percent predicted points to 64.6 (16.8) percent predicted at end of treatment, corresponding to a relative improvement of 20.6% (p<0.001). FEV1 became normal (z score >–2) with treatment in six subjects (19%).

Change in lung physiology. (A) Change in forced expiratory volume in 1 s (FEV1) with treatment. FEV1 is expressed as SD scores (SDS); values greater than -2 (horizontal dotted line) are considered to be within the normal range. (B) Change in lung clearance index (LCI) with treatment. The horizontal dotted line represents the upper limit of normal LCI in a healthy control population.19 Each pair of points represents a single subject. Horizontal grey lines represent group means.
There was significant improvement in lung clearance index (LCI) with treatment of 0.8 units (figure 2B), but no significant change in functional residual capacity (FRC). LCI fell (ie, improved) in 22 (69%) subjects. The lowest LCI at V2 was 9.4, significantly greater than the upper limit of normal LCI described in healthy controls of 7.5.18
Pulmonary markers of inflammation
Sputum was expectorated spontaneously in 100% of patients at V1 and 85% of patients at V2. There was a significant reduction in median 24 h sputum weight, though no significant change in the proportion of solids (percent dry weight). Total sputum cell count also fell, but there was no significant change in sputum differential cell counts expressed as percentage of total. There were significant changes in the level of sputum inflammatory markers matrix metalloprotease 9, interleukin (IL)-1β and tissue inhibitor of metalloproteinases 1 (see figure 3), but no significant change was seen in the other sputum markers (neutrophil elastase (NE), myeloperoxidase, regulated upon activation, normal T-cell expressed and secreted, tumour necrosis factor (TNF)-α, IL-8 and IL-12). In contrast to serum, there was no significant change in sputum calprotectin. IL-6 and interferon γ were generally undetectable in sputum at both time points. No significant change was observed in DNA content, sputum viscosity or elasticity.

Change in sputum matrix metalloproteinase 9 (MMP9), tissue inhibitor of metalloproteinases 1 (TIMP1) and interleukin (IL)-1β in patients with cystic fibrosis treated for an exacerbation. Each pair of points represents a single patient before and after treatment with intravenous antibiotics. Grey bars represent group means.
There was a small but significant increase in exhaled breath condensate pH, but no change in levels of nitrite or ammonia.
Systemic markers of inflammation
Significant reductions in four markers of systemic inflammation were seen following treatment: white cell count, CRP, IL-6 and calprotectin (table 3; figure 4). No changes were observed for IL-8 or TNF-α levels. Serum IL-10 and IL-1β were generally undetectable at both time points.
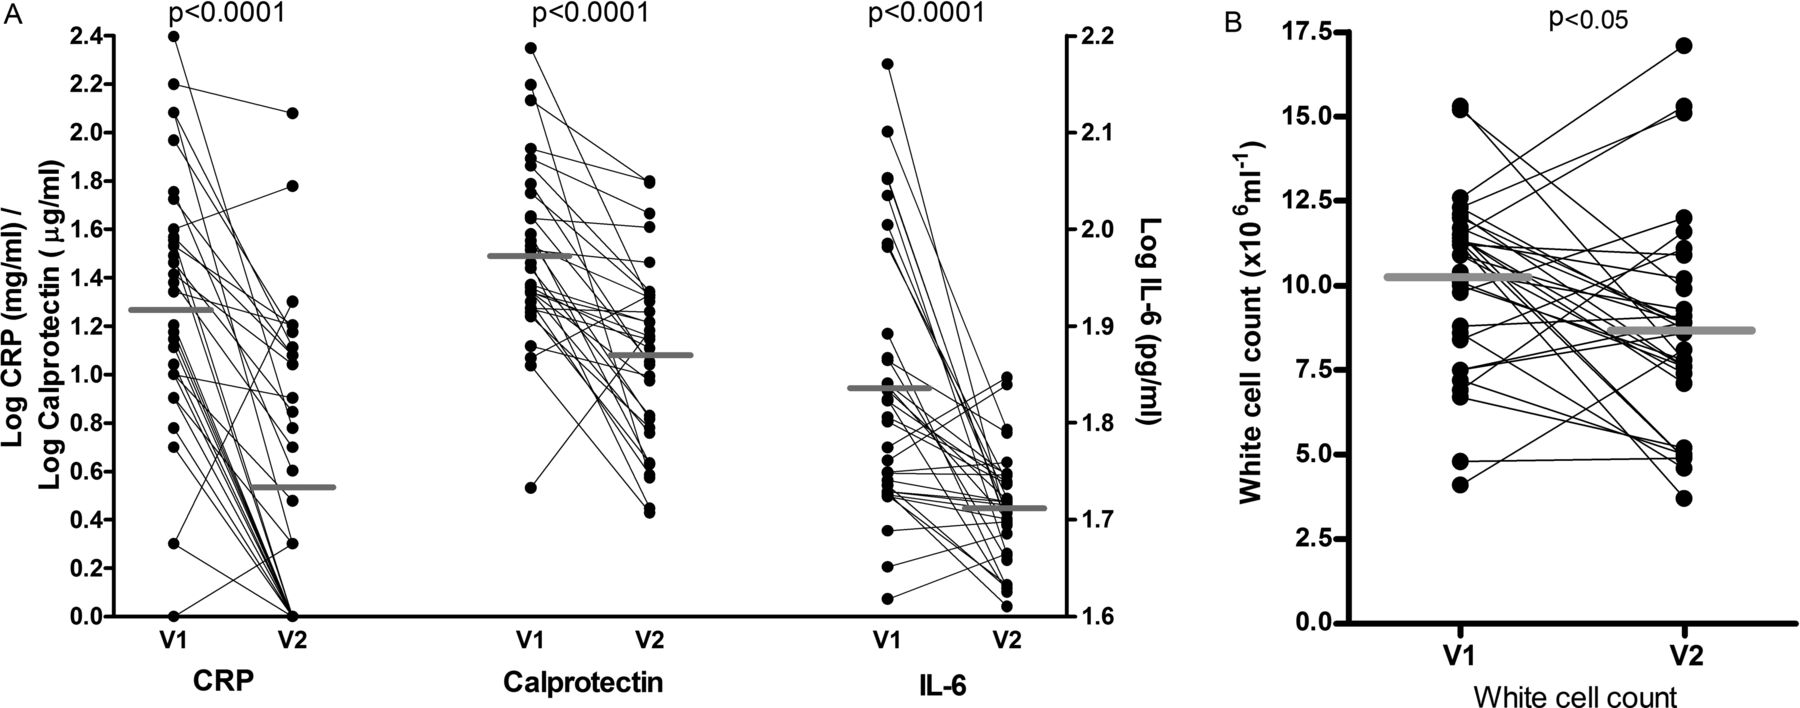
Change in serum inflammatory markers (A) and white cell count (B) in patients with cystic fibrosis treated for an exacerbation. Each pair of points represents a single patient before (V1) and after (V2) treatment with intravenous antibiotics. Group means are shown as horizontal grey bars. CRP, C-reactive protein; IL-6, interleukin 6.
Lung structure
Significant improvement was observed on CT for airway wall thickness, mucus plugs and air trapping (figure 5). Although lung consolidation score fell significantly (p<0.05), this was not a prominent feature of the CT scans, with an average score of only 1.9% at V1. No significant changes were observed for ground glass opacification, and extent and severity of bronchiectasis.

Change in features of cystic fibrosis (CF) lung disease at CT with treatment of a CF exacerbation. Each pair of points represents a single subject assessed before (V1) and after (V2) treatment of a CF exacerbation. Each CT feature was independently assessed by two radiologists, and the final score represents an average of their scores. Horizontal grey bars represent group means.
Correlations between measurements
In the online supplement we present cross-sectional correlation ‘mileage charts’, divided by assay domain, for all assays at V1. In addition, we have presented a second correlation chart comparing change in assays between visits.
Discussion
This is the first study to simultaneously assess such a comprehensive range of biomarkers in CF. The aim of the study was to provide clues towards biomarker optimisation alongside a subsequent longitudinal study of these biomarkers in patients with stable disease (the gene therapy ‘run-in’ study), and to help harmonise working across multiple sites. The findings may also provide fresh insights into CF pathophysiology.
Researchers have long recognised the problems of using spirometry in monitoring response to therapy in CF and sought alternative endpoints which either show improved sensitivity or are more closely aligned with the underlying pathophysiology.1 We hypothesised that if a therapeutic signal was not observable in this acute context, it is reasonable to anticipate that the biomarker is unlikely to prove optimal for a trial in patients with stable disease in whom a smaller positive change might be anticipated. This issue affects all clinical trials in CF and is not limited to gene therapy. We have therefore presented the assay data and accompanying correlations in full (see online supplement), so that others can access these data when selecting biomarkers for their own research. We will consider the changes observed in each domain separately.
Symptoms
The importance of assessing patient-reported outcomes is now well established in CF clinical trial methodology.22 The symptom score used here was devised by our group and, unlike conventional quality of life assessments, was specifically designed to assess response to acute change in major respiratory symptoms. Although different scores had been used previously to assess acute change,5 ,23 when this study was initiated none had been subjected to a formal evaluation process and there was no accepted gold standard. The score we used was appropriate for the current study and provided a simple and effective method of confirming clinical response against which to compare assay performance. We recognise however that it is less well suited to long-term monitoring of patients with stable disease, or indeed to repeated delivery of gene therapy, when changes may be more subtle and multidomain. Symptom and quality of life assessments are key endpoints in our run-in study and gene therapy trials, and we have selected the Cystic Fibrosis Questionnaire Revised for these assessments.24
Lung physiology
Tackling disease in smaller airways is an important objective of CF therapies, but may not be easily correlated to change in FEV1 or symptoms.25 LCI is one of the major emerging endpoints in CF clinical trials.18 ,26 ,27 As a measure of overall ventilation heterogeneity, LCI will be affected by fixed airway abnormalities due to fibrotic and destructive processes, and modifiable differences in inflammation and mucus retention. Subjects with mild (and potentially reversible) airways disease are not well represented in the current cohort—only six had FEV1 within the normal range at V2, and all had abnormalities on CT and considerable elevation in LCI. As previously described,5 there was considerable heterogeneity of LCI response. Less well ventilated lung regions may be revealed as mucus is cleared, increasing overall inhomogeneity, and thus LCI. In vivo, the effects on LCI and FRC of mucus clearance are likely to be complex and unpredictable,28 and this test may be best suited to those with milder disease.
Pulmonary markers of inflammation
Sputum is an abundant source of inflammatory markers. Assays that accurately reflect endobronchial infection or inflammation are clinically and biologically relevant, and have considerable potential as pulmonary outcome measures for clinical trials.29 All the sputum inflammatory markers selected here have previously been reported to be elevated in CF populations, and are amongst several candidate biomarkers of CF airways inflammation.29 Sputum IL-8 and NE in particular have been shown to correlate with FEV1 in a large cross-sectional analysis.30 Despite the fall in sputum total cell count, we however found no change in sputum IL-8 or NE following treatment, and little correlation with other non-sputum assays. The validity of sputum biomarkers depends on reproducible measurements that also reflect other measures of health or lung function. These data cast doubt over the applicability of many of these potential biomarkers in interventional studies. We also recognise that this study alone is insufficient to dismiss most of the sputum biomarkers entirely, and we have continued to measure the majority in our subsequent longitudinal study. We have however discontinued assessments of sputum rheology and the biomarkers that were only poorly detectable (see online supplement).
Systemic markers of inflammation
The most significant changes in inflammation were observed in serum rather than sputum: CRP, a non-specific marker of inflammation, and calprotectin, a marker of neutrophilic inflammation previously shown to be elevated in CF.14 ,31 Both markers showed greater change than either sputum or blood cell counts, or any sputum soluble markers, and calprotectin showed correlations with a number of other measures of severity, including symptom score, spirometry and LCI (see online supplement). Whether these prove useful in monitoring responses to treatment in patients with stable disease is being addressed in our longitudinal study.
Structure
The CT scoring assessed individual morphological abnormalities, rather than using a single composite score.32 This allows separation of fixed (eg, bronchiectasis) from potentially reversible (eg, wall thickness parameters) features, preventing signal from a change in the latter being diluted by a lack of change in the former. Three previous studies have investigated CT changes following antibiotic treatment,4 ,10 ,11 demonstrating improvements in peribronchial thickening, mucus plugging and air trapping, although no single study demonstrated improvements in all three features. We observed significant improvements in mucus plugging, air trapping and bronchial wall thickness. The grading of the latter two features was designed to maximise the chances of demonstrating small changes over a short time frame by increasing the number of grades within the severity score. Inter-observer reproducibility of the scoring ranged from good to excellent, which we believe justifies the use of the scoring method33 (see online supplement). This score has now been adopted for the run-in and gene therapy studies.
Limitations
Some potential limitations with the current study deserve discussion. Interventional trials usually seek improvement from stable baseline. This study however addresses a complementary objective: that of demonstrating response to a positive intervention. In this regard, treatment of pulmonary exacerbation is an appropriate and pragmatic model against which to evaluate assays. Although the definition of exacerbation in this study was not protocol predefined, the decision to treat was made by the clinician independent of this study, reflecting standard clinical care. Likewise, treatment is not limited to intravenous antibiotics alone, and will include additional nebulised and physical therapies as appropriate, maximising the impact of the intervention. Although data are incomplete for some analyses, the majority contained data on at least 30 pairs, making this one of the largest CF exacerbation studies reported.
In addition to the practical benefits of the study, this multidomain collection of data may provide useful insights into CF pathophysiology. Correlations will require verification in subsequent studies. A potentially interesting pathophysiological outcome was the predominance of large airway changes during treatment. Thus, some of the most statistically significant improvements were seen in FEV1 and large airway plugs. In contrast to systemic inflammation, lung inflammation assessed by a range of sputum biomarkers altered little. Short-term reassurance provided by normalisation of symptoms may therefore not reflect longer-term pulmonary inflammation. Novel therapies aimed at the underlying defect, rather than the consequences of it, would clearly be beneficial.
Our overarching aim was to identify and optimise outcome measures for a gene therapy trial. Several airway inflammatory and mucus markers were below the limits of detection even at the start of an exacerbation, while others failed to improve with intravenous antibiotics. In addition we have established the use of LCI in a multicentre setting and refined our understanding of its role as an outcome measure. We are in the process of analysing data from our parallel run-in study of biomarkers in patients with stable CF. Preliminary indications suggest that spirometry, LCI, CT scores and quality of life scores also feature prominently.34 Data from these studies have played an important role in the selection of biomarkers for our recently started multidose CF gene therapy trial.
Acknowledgments
This work would not have been possible without the assistance of the clinical, laboratory and radiology staff at all three sites, or without the assistance of the Wellcome Trust Clinical Research Facility (WGH). We also warmly thank Professor C. Marriott (Department of Pharmacy, Kings College London, UK) for his help with sputum rheology measurements. The CF Gene Therapy Consortium are enormously grateful to all the patients, and their families, who gave up their time to take part in this study.
References
Supplementary materials
Supplementary Data
This web only file has been produced by the BMJ Publishing Group from an electronic file supplied by the author(s) and has not been edited for content.
Files in this Data Supplement:
- Data supplement 1 - Online supplement
Footnotes
ARH and JCD are joint first authors.
-
Contributors ARH, JCD, RDG, KAM, JD, ZA, NJB, MR, SM-I, NV, MHD, CS, JSG, JP-L, MDL, SJ, SS, YB, MGM, PT, AD, DH, DA, SCH, DRG, APG, DJP, JAI, ACB, UG, SC and EWFWA all made substantial contributions to the study conception and design, acquisition of data, and analysis and interpretation of data; revised the article critically for important intellectual content; and gave final approval of the version to be published. In addition, ARH, RDG, KAM, JD, ZA, NJB, MR, CM, DH, APG, ACB and UG made substantial additional contributions to assay development and interpretation. ARH, JCD and SC wrote the first draft of the manuscript. EWFWA conceived the study, jointly raised the funding and oversaw its completion.
-
Funding This study was funded by a grant from the UK Cystic Fibrosis Trust (GT001-007). It was supported by the NIHR Respiratory Disease Biomedical Research Unit at the Royal Brompton and Harefield NHS Foundation Trust and Imperial College London.
-
Competing interests None.
-
Ethics approval Lothian Research and Ethics Committee, and Royal Brompton, Harefield and NHLI Research Ethics Committee.
-
Provenance and peer review Not commissioned; internally peer reviewed.
-
Data sharing statement All relevant study data are presented in this paper.