Article Text

Abstract
Background The effects of workplace second-hand smoke (SHS) on lung function remain uncertain because of a lack of objective measures for SHS exposures.
Objective To determine whether an exposure–response association exists between lung function and two different markers of SHS based on indoor fine particulate (PM2.5) and urinary cotinine levels in non-smoking catering workers.
Design A cross-sectional study during a 1.5-year exemption of licensed catering premises from smoke-free legislation.
Participants 186 non-smoking catering workers aged 18–65 years in Hong Kong were recruited. A declared non-smoking status was accepted in workers with exhaled breath carbon monoxide levels <6 ppm and urinary cotinine levels <100 ng/ml.
Main outcome measures Lung function measures of forced expiratory volume in 1s (FEV1 in litres), forced vital capacity (FVC in litres) and forced expiratory flow as 25–75% of FVC (FEF25–75 in l/s) were recorded.
Results Indoor fine particulate (PM2.5) concentrations were 4.4 times as high in smoking premises (267.9 μg/m3) than in non-smoking premises (60.3 μg/m3) and were strongly associated with the probability of permitted smoking (R2=0.99). Smoking was the dominant source of particulates (R2=0.66). Compared with workers exposed to the lowest indoor PM2.5 stratum (<25 μg/m3), lung function was lower in the three higher PM2.5 strata (25–75, 75–175, >175 μg/m3) with FEV1 −0.072 (95% CI −0.123 to −0.021), −0.078 (95% CI –0.132 to −0.024), −0.101 (95% CI −0.187 to −0.014); FEF25–75 −0.368 (95% CI −0.660 to −0.077), −0.489 (95% CI −0.799 to −0.179), −0.597 (95% CI −0.943 to −0.251); and FEV1/FVC (%) −2.9 (95% CI −4.8 to −1.0), −3.2 (95% CI −5.1 to −1.4) and −4.4 (95% CI −7.4 to −1.3), respectively. Urinary cotinine was associated positively with indoor PM2.5 but negatively with lung function. Consistently lower values for lung function per unit increase of indoor PM2.5 were found.
Conclusion Lung function is inversely associated with workplace SHS. Workplace exemptions and delays in implementing smoke-free policies and current moves to relax legislation are a major threat to the health of workers.
- Tobacco smoke pollution
- particulate matter
- respiratory function tests
- cotinine
- legislation
- tobacco and the lung
Statistics from Altmetric.com
- Tobacco smoke pollution
- particulate matter
- respiratory function tests
- cotinine
- legislation
- tobacco and the lung
Key messages
What is the key question?
Does second-hand smoke exposure cause measurable changes in adult lung function?
What is the bottom line?
Incomplete or delayed workplace smoking bans damage respiratory health.
Why read on?
This report provides the first complete analysis on the association between PM2.5, urinary cotinine and lung function.
Introduction
Exposure to second-hand smoke (SHS) in catering workers is among the highest of all occupations,1 with increased risks for respiratory and cardiovascular diseases.2 A recent Cochrane review of 49 studies of smoking bans in 13 countries from 1988 to 2007 concluded that a reduction of SHS in indoor workplaces, especially among bar workers, is effective in reducing adverse health outcomes.2
With increasing evidence showing the benefits of smoking bans, the Hong Kong Special Administrative Region amended its Smoking (Public Health) Ordinance to ban smoking in indoor public and workplace areas on 1 January 2007 with exemptions until 1 July 2009 for many indoor areas,3 postponing public and workers' health protection by 2.5 years.
Cigarette smoke particulates cause damage to the arterial endothelium4 and pulmonary epithelium.5 The 2006 US Surgeon General's Report6 concluded that the evidence is sufficient to infer that exposure to SHS causes lung cancer and coronary heart disease morbidity and mortality. However, causality for effects on lung function in healthy non-smoking adults has been described as less clear,2 6 inconsistent7 8 and unlikely to be clinically significant.8 While the gap in evidence is acknowledged, many jurisdictions allow exemptions or partial bans2 and vested interests lobby for repeal of existing legislation.
A PubMed search for the period from January 1960 to September 2010 found several relevant reports on lung function changes in workers before and after smoke-free legislation,2 9–11 but none showed a clear exposure–response relationship. In this study we examined the associations between lung function in non-smoking catering workers and their exposures to workplace SHS using the biomarker cotinine and PM2.5, a marker of tobacco aerosols with high penetration of airways12 and a strong association with mortality.13 14
Methods
Recruitment and selection
From February to June 2008 we surveyed 495 randomly selected catering premises, including Chinese, western, Hong Kong style (cha-chaan-teng) and fast-food restaurants. The sampling frame was a list of licensed premises in 19 districts, from the Food and Environmental Hygiene Department, and we randomly selected seven for the survey. We recruited a total of 222 workers from 99 premises after excluding premises with undefined indoor areas (figure 1). Unrestricted indoor smoking was allowed in 36 of these 99 venues and, in 63 venues, indoor smoking was prohibited by law including 12 premises with alfresco seating. Participants in the study were either never-smokers (85%) or ex-smokers who had quit for at least 3 months (15%). The purpose of the study was explained to the owner or manager and the benefits of participation were explained to the workers, including reports on lung function tests and urine cotinine levels and payment of HK$100 (US$12.8) as compensation for their time.
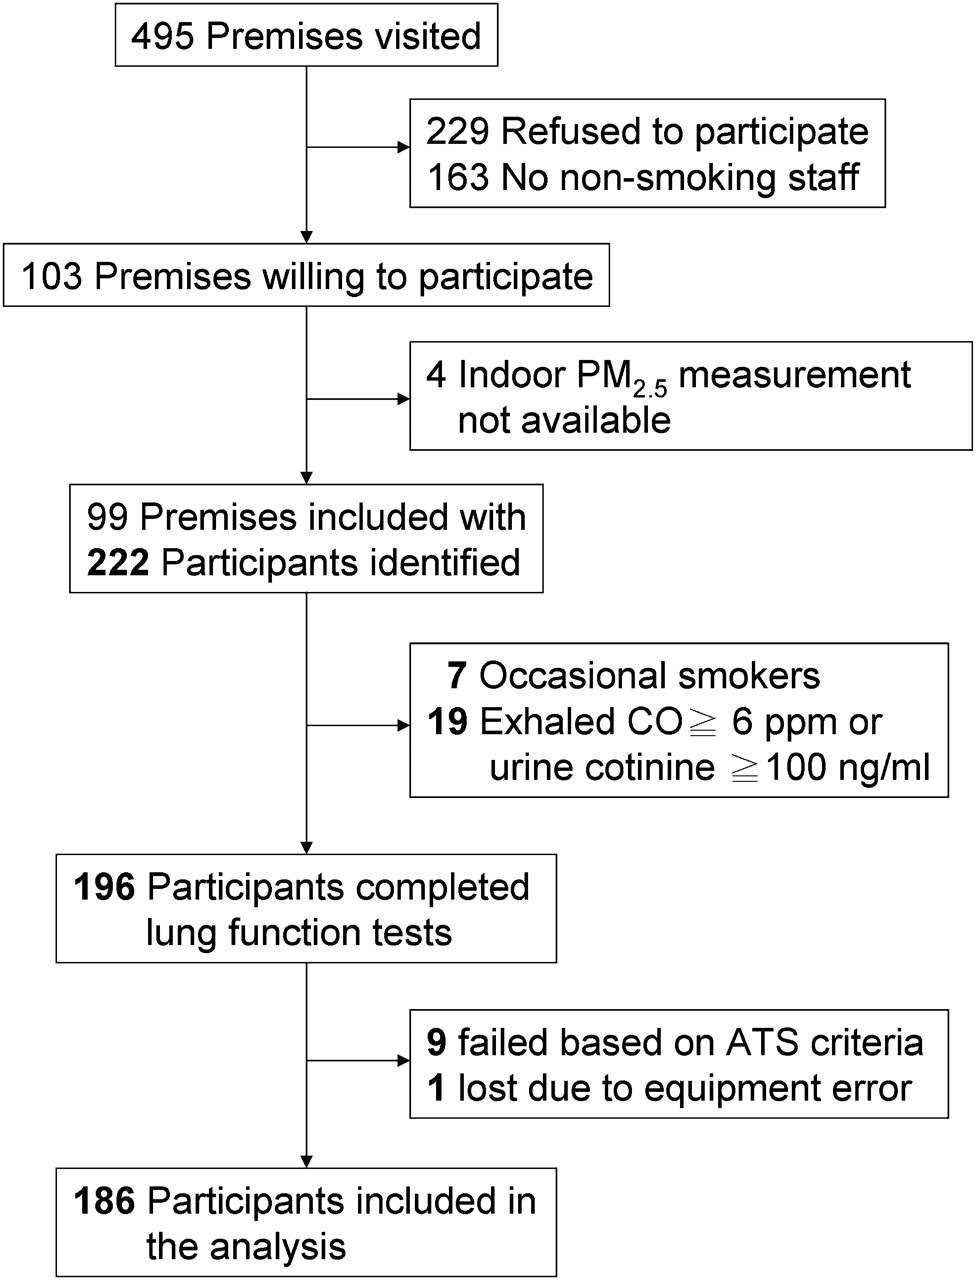
Participant recruitment, flow and dropouts. Sample sizes of the participants are shown in bold.
Assessment
All recruited workers were interviewed using a standard schedule to collect demographic and socioeconomic data, smoking history, SHS exposure and work patterns. Forced vital capacity (FVC), forced expiratory volume in 1 s (FEV1) and forced expiratory flow as 25–75% of FVC (FEF25–75) were measured using a portable spirometer (MicroLoop, MicroMedical, Basingstoke, UK) following an American Thoracic Society/European Respiratory Society protocol. All pulmonary function tests were conducted by the same trained researcher and a demonstration video was shown to all subjects before the tests. We accepted declared non-smoking status in workers with exhaled breath carbon monoxide levels <6 ppm15 (Micro 4 Smokerlyzer, Bedfont Scientific, Maidstone, Kent, UK) and urinary cotinine levels <100 ng/ml16 (liquid-chromatography-tandem-mass-spectrometry, UCSF Clinical Pharmacology Laboratory, USA). The final data analysis included 186 of the 222 recruited workers (table 1) after exclusions for inadequate spirometry readings and failure to meet the criteria for non-smoking status (figure 1).
Characteristics of recruited workers
Measurement of PM2.5
Two portable SidePak particulate monitors based on laser photometry (SidePak Aerosol Monitor AM510, USA) were used to measure PM2.5 concentrations indoors and outdoors simultaneously for approximately 30 min at each location. For indoor measurements, the monitor was placed at least 1.1 m above the floor and away from vertical surfaces, ventilation units, direct sunlight, hallways or passageways, elevators and outside doors. For outdoor measurements, the monitor was carried while constantly walking around the catering premises. The relative humidity (RH), temperature (Oregon Scientific Wireless Weather Station, Tualatin, Oregon, USA), dimensions of the room (Leica Disto laser meter A2, Switzerland), number of smokers, burning cigarettes, other burning objects, ventilation type, cooking activities and the separation of the kitchen from the rest of the premises were recorded.
All indoor and outdoor SidePak readings were adjusted for RH to account for aerosol hygroscopic growth.17 For calibration, we placed one SidePak at a Hong Kong government Environmental Protection Department particulate monitor (http://www.epd-asg.gov.hk/english/backgd/monitor.html) for 2 weeks in April and confirmed a high correlation between the SidePak readings adjusted for RH and government monitor concentrations (R=0.91). The calibration factor of the other SidePak was adjusted to match the one tested. Before each sampling day, each monitor was cross-calibrated for 30 min in the laboratory to rectify any systematic differences.
Statistical analysis
Distribution plots were constructed for all data to assess normality, logarithmically-transformed indoor PM2.5 data and square root-transformed outdoor PM2.5 data, and descriptive analyses were tabulated for smoking and non-smoking premises. We examined whether there were differences in pulmonary function between ex-smokers and never-smokers among the recruited non-smokers.
Regression-based determinant analysis was used to examine whether smoking was the major determinant of indoor PM2.5 concentration compared with a number of a priori selected determinants including outdoor PM2.5 concentration, indoor volume of premises, type of kitchen and ventilation, and the presence of burning objects other than cigarettes.
To determine the relationship between indoor PM2.5 concentrations and the probability of permitted indoor smoking, we divided the 99 premises into categories by unit increment of natural log indoor PM2.5 concentration and calculated the probability of permitted smoking by using the number of smoking premises divided by the total sum of smoking and non-smoking premises in each category. We used a non-linear regression to achieve a better fit to the data.
Multiple regression based on generalised estimating equations was used to analyse the associations between the lung function variables FEV1 (l), FEF25–75 (l/s), FEV1/FVC (%) and FVC (l) and indoor PM2.5 exposure levels with adjustment for clustering effects of premises and for possible modifying factors (table 2). Analyses of FEV1 and FEF25–75 were additionally adjusted for FVC.18 To satisfy the normality assumption for the regression model, we divided the indoor PM2.5 distribution into four strata based on a natural log scale with PM2.5 ≤25 μg/m3 as the referent stratum. Regression was used to test the linear trend between lung function and PM2.5 strata, and sensitivity analyses were performed for the less exposed subgroups (never-smokers, those not exposed to co-workers' SHS and workers in non-smoking premises) and the older subgroup. We analysed the regression coefficients for continuous variables of lung function and natural log indoor PM2.5 concentration and then predicted lung function using the average indoor PM2.5 levels in smoking and non-smoking premises.
Lung function indices (with 95% CI) of non-smoking catering workers and indoor workplace PM2.5 concentrations expressed with the associated probability of permitted indoor smoking
The same approach was used to examine associations between workers' lung function and urinary cotinine levels. To satisfy the assumption of normality for regression, we divided the cotinine values into four strata based on the unit intervals of a natural log-log scale with a reference cotinine stratum of ≤0.8 ng/ml3, a reported geometric mean for non-smokers in a non-occupational setting.19 We tested the linear trend between lung function and cotinine strata.
A partial residual plotting method20 was used to quantify the associations between levels of indoor PM2.5 and urinary cotinine, a biomarker of SHS exposure,2 taking into account possible modifying factors (table 3).
Lung function indices (with 95% CI) of non-smoking catering workers for different ranges of urinary cotinine (ng/ml)
SPSS Version 16 and SAS Version 9.1.3 were used for analyses with statistical significance defined at an α level of 0.05 (two-tailed) and estimates are presented with 95% CIs.
Results
Recruited catering workers
There were more female (67%) than male workers in both smoking and non-smoking premises. Among the 186 non-smokers, lung function indices in ex-smokers adjusted for age, sex and height (FEV1 2.59 l, FEF25–75 3.30 l/s, FEV1/FVC 92%), were not statistically different (p=0.40–0.46) from never-smokers (FEV1 2.65 l, FEF25–75 3.44 l/s, FEV1/FVC 91%). Compared with workers in non-smoking premises, those in smoking premises were younger (p<0.001), taller (p=0.008), better educated (p<0.001), with more income (p=0.008) and more exposure to SHS in other places (p=0.014) (table 1).
Indoor and outdoor PM2.5 concentrations
The indoor PM2.5 concentrations ranged from 2.6 to 847.2 μg/m3. In smoking premises the indoor PM2.5 geometric mean (GM) (211.6 μg/m3 (95% CI 161.1 to 277.8)) was 3.5 times as high as that in non-smoking premises (60.3 μg/m3 (95% CI 48.0 to 75.8)), but with no differences (p=0.109) in their corresponding outdoor PM2.5 concentrations (figure 2A). In smoking premises with active smoking during our visits, the PM2.5 GM (267.9 μg/m3 (95% CI 199.4 to 359.9)) was 4.4 times as high (p<0.001) as the GM (60.3 μg/m3 (95% CI 47.8 to 76.1)) in non-smoking premises without active smoking (figure 2B).

Boxplots of PM2.5 concentrations and their indoor-outdoor (I/O) ratios. (A) All smoking (n=36) and non-smoking (n=63) premises. (B) Premises with (n=27) and without (n=62) observed indoor smoking. The boxes show the medians, interquartile ranges and the bars that were away from the box by 1.5 times the interquartile range; p values were obtained by the ANOVA F-test (two-tailed).
Association between indoor PM2.5 and indoor smoking
The multiple regression model indicated that, in terms of variation explained, the most important determinant of indoor PM2.5 was smoking (57.2%, p<0.0001), followed by ventilation type (10.1%, p=0.014), outdoor PM2.5 (7.0%, p<0.0001), presence of burning objects (2.1%, p=0.026), indoor volume of the premises (2.0%, p=0.046) and kitchen type (0.1%, p=0.803; table 4). Higher indoor PM2.5 concentrations were strongly associated with the probability of permitted indoor smoking, ranging from 0 to 1 for concentrations of 20–400 μg/m3, respectively (figure 3).
Smoking as a key determinant of natural log indoor PM2.5 concentrations (μg/m3) in catering premises (n=99) compared with other variables
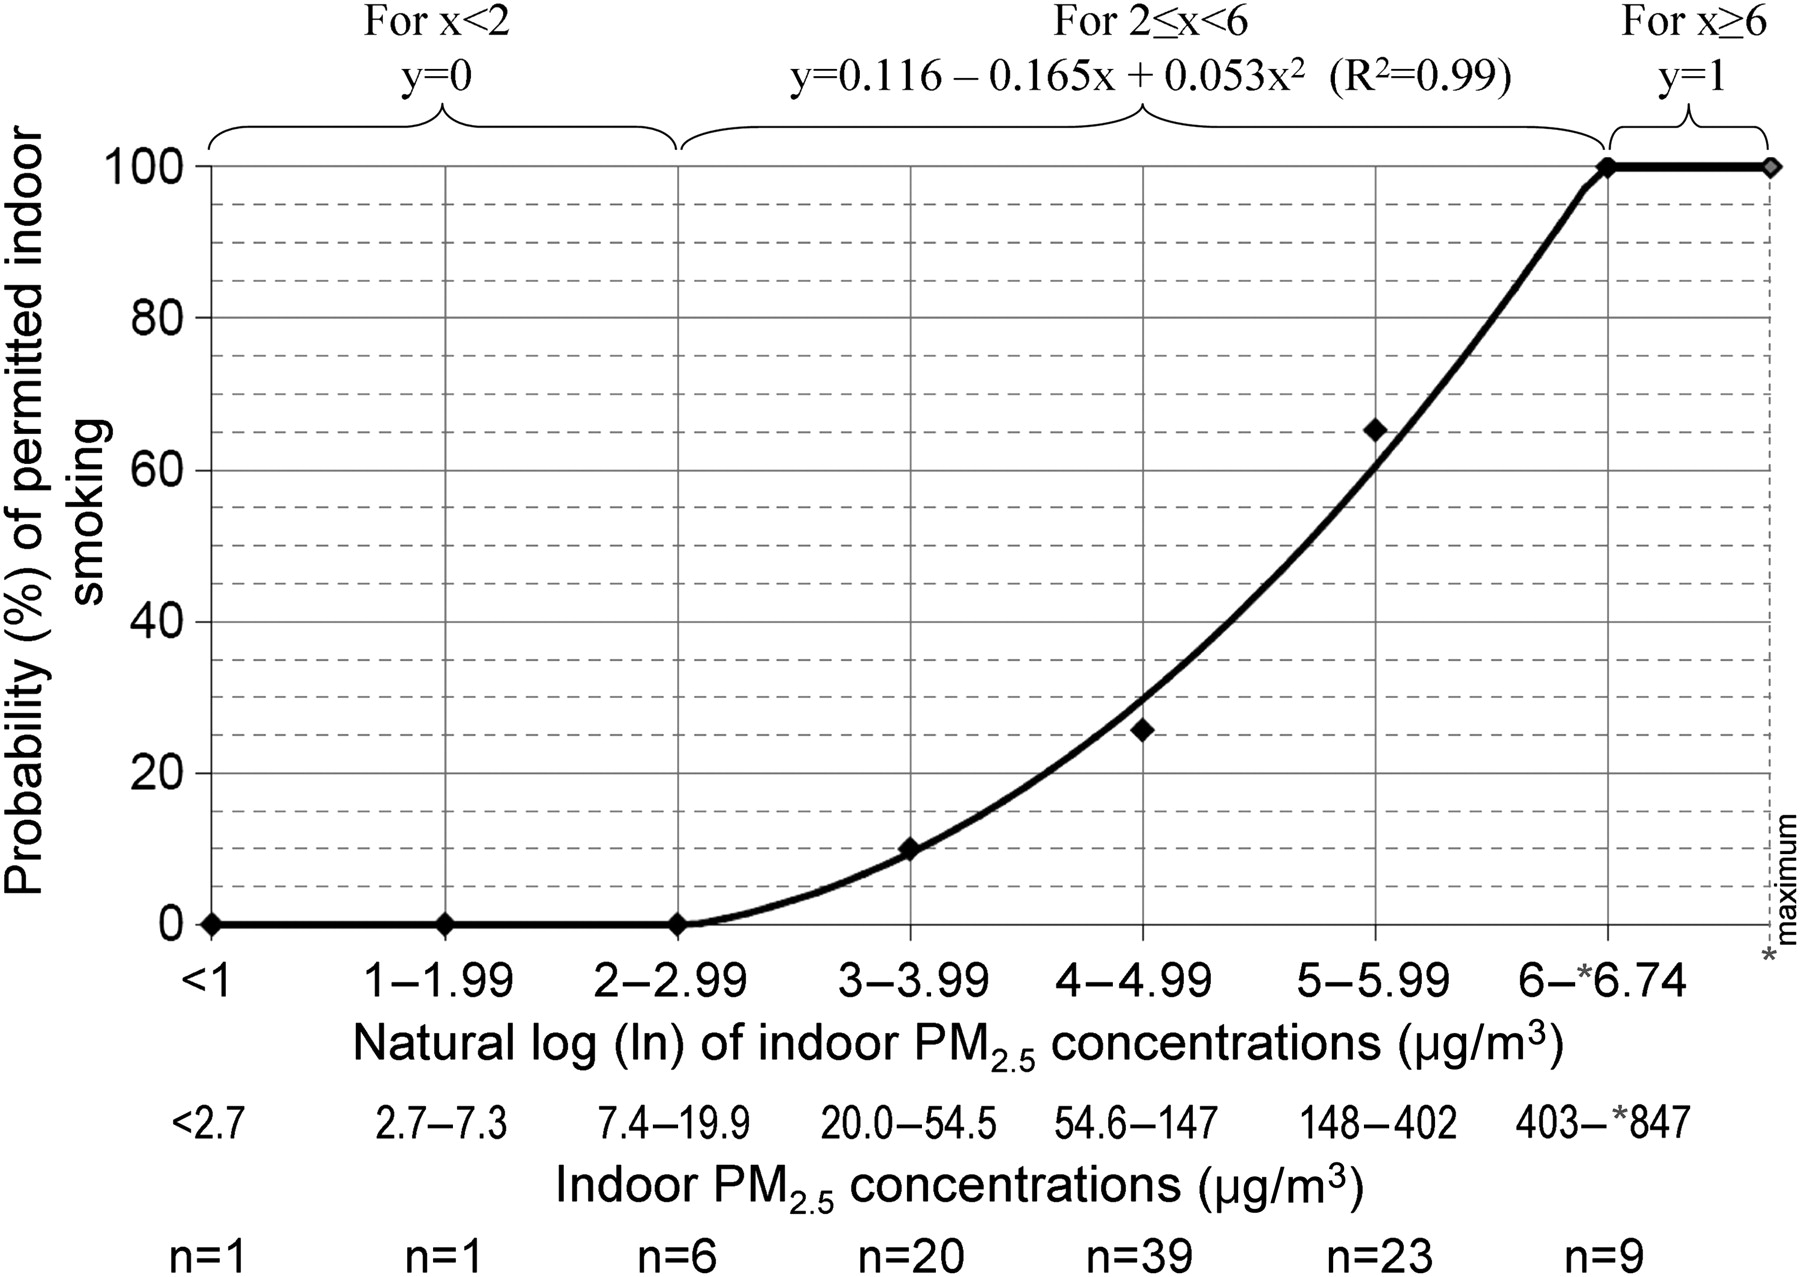
Probability of permitted indoor smoking in Hong Kong (y) versus natural log indoor PM2.5 concentration (x) among all smoking (n=36) and non-smoking (n=63) catering premises.
Association between indoor PM2.5 and biomarker of SHS exposure
Workers' urinary cotinine levels were strongly associated with indoor particulate concentrations. Indoor PM2.5 concentrations in all premises were positively associated with cotinine residuals (p<0.0001), with 45% of the variation explained after removal of the effects attributable to gender, age, height, duration from the last work shift, exposure to co-workers' SHS, daily SHS exposure duration at home and in other places and socioeconomic status (figure 4).

Partial residual plot for association between urinary cotinine level (ng/ml) and indoor PM2.5 concentration (μg/m3).
Association between lung function and SHS exposure
There was a strong exposure–response relationship between the strata of indoor PM2.5 concentrations and the three lung function indices measured (table 2). When the analysis was restricted to subgroups that were older or less exposed to smoking, greater negative values in these lung function indices were observed with clear exposure–response relationships. Tests for interactions between indoor PM2.5 and sex, age, smoking history and exposure to co-workers' SHS for effects on lung function were not significant. Workplace exposure to SHS measured as urinary cotinine levels was inversely associated with lung function (table 3), including FEV1 and FEF25–75 but not FEV1/FVC, as there was also an inverse association between FVC and cotinine (p=0.041). When compared with the referent group, the point estimates for FVC among the urinary cotinine strata showed a significant trend (p=0.026) from the lowest to the highest stratum (−34 ml (95% CI −202 to 134), −55 ml (95% CI −217 to 108), −157 ml (95% CI −308 to −6)).
Lung function indices per unit of natural log indoor PM2.5 concentration
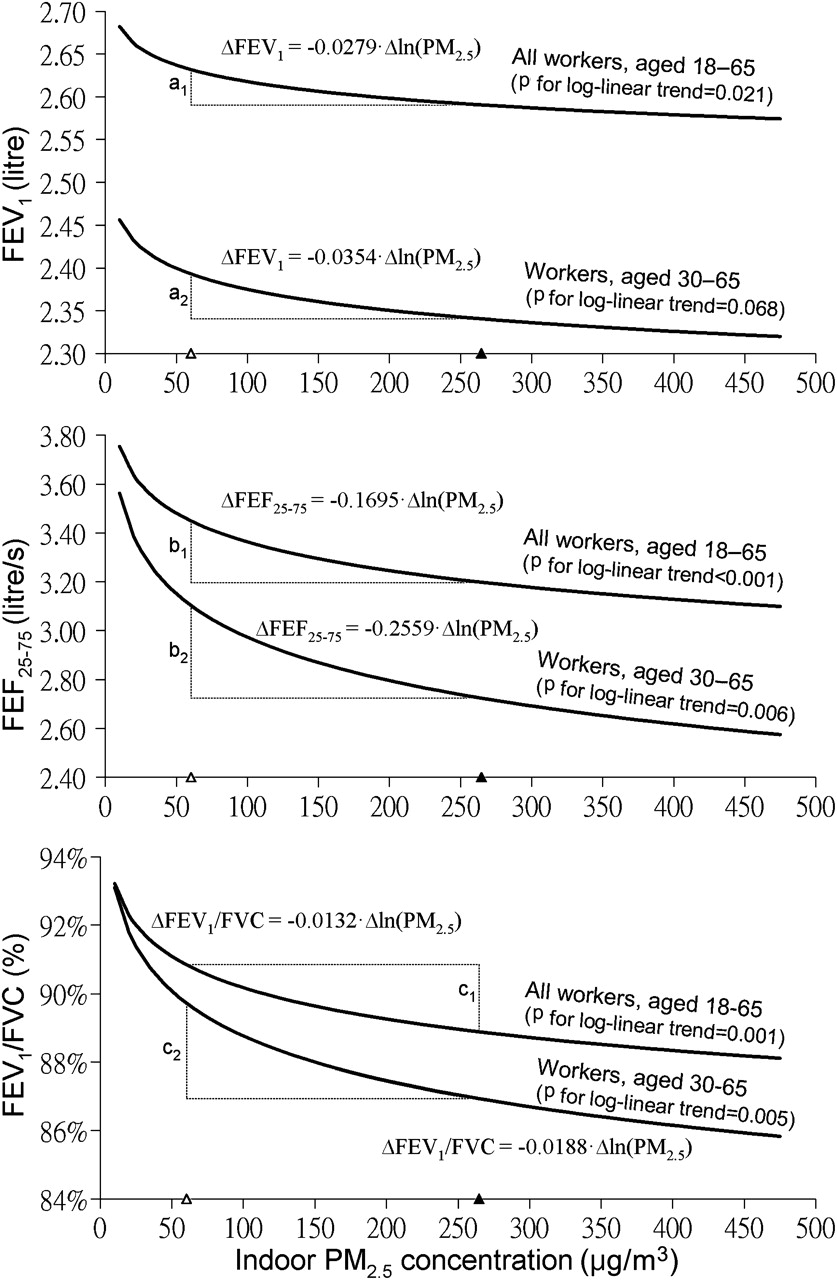
Indoor PM2.5 concentrations were consistently negatively associated with lung function indices (p=0.001–0.021, figure 5). When the analysis was restricted to the older workers, larger negative effects were observed in FEF25–75 (p=0.006), FEV1 (p=0.068) and FEV1/FVC (p=0.005). Tests for interactions between indoor PM2.5 and age group for effects on lung function were not significant. Based on the lung function indices for all workers in the sample, the predicted lung function for exposure to the average indoor PM2.5 levels in smoking premises compared with non-smoking premises were lower by 42 ml (FEV1), 253 ml/s (FEF25–75) and 2.0% (FEV1/FVC). These apparent reductions in lung function were lower by 26–50% in the older subgroup compared with the average for all workers. No associations were found between FVC and natural log indoor PM2.5 concentrations (p=0.156).
Estimated lung function per unit change of indoor PM2.5 concentration among all recruited workers (n=186). a1=0.04, a2=0.05, b1=0.25, b2=0.38, c1=2.0, c2=2.8 represent the difference in the estimated mean lung function corresponding to the mean indoor PM2.5 concentrations 60.3 μg/m3 (open triangle) and 267.9 μg/m3 (solid triangle) in non-smoking and smoking premises, respectively. Lung function indices were adjusted where appropriate for gender, age, height, duration of SHS exposure at work, daily duration of SHS exposure at home and in other places, education, income, job position, the effect of patio seating and FVC. FEV1, forced expiratory volume in 1 s; FEF25–75, forced expiratory flow as 25–75% of FVC; FVC, forced vital capacity; SHS, second-hand smoke.
Discussion
This is the first study on non-smoking catering workers which clearly shows an inverse exposure–response relationship between lung function and workplace SHS levels quantified by both indoor fine particulate concentrations and urinary cotinine levels. The lack of a consistent relationship in previous studies may be explained by insufficient precision of exposure measurements to allow detection of changes in lung function. Most studies21–23 have measured SHS by questionnaires in which the participants self-reported exposures as yes/no answers, exposure duration and number of smokers or cigarettes. However, these measures may be biased by either over-reporting or limited awareness of exposure by the participants.21 Self-reported SHS exposure of 3534 adult never-smokers in Switzerland showed no associations between workplace exposure and lung function except for subjects with asthma and women.21 A questionnaire survey in 7882 never-smoking adults in 16 European countries reported no significant associations between FEV1 and SHS exposure at work.22 In 1033 Chinese subjects, a questionnaire survey found significant associations mimicking an exposure–response relationship between FEV1 and categories of SHS exposures based on exposure ‘only at work or at home’ and ‘both at work and at home’ in never-smokers.23
The evidence for the effects of SHS on lung function is supported when cotinine is used as the exposure measure. For example, a salivary cotinine study of 1623 non-smokers demonstrated an exposure–response relationship in the highest two of five levels of cotinine, but no association among the never-smoker subgroup.24 A study of a composite score for both self-reported exposure data and serum cotinine samples in 301 never-smokers in Scotland reported an exposure–response association between both FEV1 and FVC and SHS exposure, but the association was less clear when using either self-reported data or cotinine levels separately.25 Another study in the USA of self-reported exposure data and serum cotinine levels in 10 581 non-smokers found a clear exposure–response relationship for the FEV1/FVC ratio, but only for FEV1 among the female subgroup.26
One of the major limitations of using cotinine as a biomarker of exposure to nicotine in SHS is the inter-individual variation in cotinine metabolism, with a delay of 4–6 h to the peak plasma cotinine level after SHS exposure followed by a reduction at different individual removal rates.27 Plasma cotinine concentrations could vary at different times of the day,27 so heterogeneity in the sample collection timing from the last exposure could lead to marked variation in estimates of SHS exposures. Our urine samples were collected in workplaces during evening business hours with the advantage that the times elapsed since previous workplace exposures were similar. Our regression adjustments for SHS from sources outside workplaces also reduced residual effects due to multiple sources.
Measurement of both indoor PM2.5 concentrations and lung function at the same time and location, and analysis of their associations with adjustments for long-term exposure7 and other microenvironmental sources of SHS, can eliminate errors in the exposure timing and source. There are few reports on lung function and indoor PM2.5 as a measure of SHS level in the workplace. Non-tobacco PM2.5 sources were unlikely to have affected our exposure estimates as we found smoking was the dominant determinant of indoor PM2.5 with eight times the contribution from outdoor PM2.5. Since reverse causality is impossible given the involuntary nature of SHS exposure, the strong exposure–response relationships with triangulated linear associations between lung function and two different exposure measures (indoor PM2.5 and cotinine) provide the strongest evidence so far reported for impairment of lung function by SHS.
Our study showed that the differences in lung function between smoking and non-smoking premises (figure 5) are similar to those from the pre- and post-smoking ban studies.2 9–11 This finding, together with the well-established ageing effects on lung function28 consistent with the greater negative coefficients in our older subgroup, support the validity of our results. A cotinine study which reported that newly exposed subjects showed a greater decline in lung function while those who had been living with a smoker showed the smallest decline24 also supports our finding that the lung function indices in all PM2.5 exposure strata consistently became more negative when restricted to subgroups that were relatively less exposed to SHS (table 2).
Although we used a portable office spirometer rather than a standard diagnostic spirometer in a hospital laboratory setting, the MicroLoop spirometer has a precision comparable to that of a standard instrument and is one of the few that has acceptable limits of agreement with standard instruments in all lung function measures.29
The downward levelling trends of the estimated lung function per unit increase of indoor PM2.5 concentration (p=0.001–0.021) indicate the sensitivity of pulmonary function to SHS with apparent greater reductions in lung function at lower than at higher particulate concentrations (figure 5), similar to the observations on the non-linear effect of both combustion and ambient particulates on cardiovascular disease mortality.30 Particulates that penetrate to the deepest part of the lung and cause alveolar epithelial injury are associated with both acute reversible inflammatory responses and cumulative irreversible pulmonary damage as indicated by structural changes in airways.31 32 The observed trends may be related to a saturation mechanism occurring at lower exposure levels30 where both irreversible and reversible processes may simultaneously exist. The cross-sectional nature of our study limits further interpretation.
To our knowledge, this is the first study showing a non-linear relationship between indoor PM2.5 and the probability of smoking being permitted. This method may be particularly useful for tobacco control inspections and enforcement following smoking ban legislation.
Our exposure–response coefficients for lung function also provide a basis for health impact assessments and policy reviews. Lung function is an important indicator of future health and life expectancy.33 Adverse health effects attributable to the lack of workplace smoking bans include higher risks for respiratory, nasal and ocular symptoms, and hospital admissions for coronary heart disease including acute myocardial infarction.2 We found strong evidence that the respiratory health of non-smoking workers in exempted premises was damaged by tobacco smoke emissions, and harm to the respiratory system would also occur in workers who were current smokers.34 In female workers, who comprised two-thirds of the catering workforce, pregnancy could result in retarded fetal growth as a result of SHS exposure.35
Our data show that complete prohibition of smoking can reduce indoor fine particulate levels by more than 75% (from 267.9 to 60.3 μg/m3) on average, even in locations close to the roadside, and protect the respiratory health of the catering workforce. In Hong Kong's highly polluted environment, mean ambient PM2.5 levels (38.4 μg/m3 in 2008) are well above the WHO annual Air Quality Guideline of 10 μg/m3. There is consistent evidence worldwide that legislative bans are effective in reducing SHS exposure and improving health,2 but public and occupational health principles have been set aside owing to the influence of vested interests and poor legal draftsmanship on smoke-free legislation.
Conclusion
The lung function of workers is inversely associated with exposure to workplace SHS, with a clear exposure–response relationship. The 30-month exemption period of the smoke-free legislation in Hong Kong (2006 Smoking (Public Health) Ordinance) was directly responsible for the impairment of workers' health.
Acknowledgments
We thank LY Ho, WL Cheung, J Chen and CH Lee for their help in data collection and LC Wong for her help in study preparation and data management.
References
Footnotes
Funding AJH received funding for this study from the Health and Health Services Research Fund of the Hong Kong SAR government (HHSRF#05060661).
Competing interests None.
Ethics approval This study was conducted with the approval of the Institutional Review Board of the University of Hong Kong/Hospital Authority Hong Kong West Cluster.
Provenance and peer review Not commissioned; externally peer reviewed.