Article Text

Abstract
Background Healthcare associated infections, including ventilator associated pneumonia, are difficult to diagnose and treat, and are associated with significant morbidity, mortality and cost. We aimed to demonstrate proof of concept that breath volatile profiles were associated with the presence of clinically relevant pathogens in the lower respiratory tract.
Methods Patients with sterile brain injury requiring intubation and ventilation on the intensive care unit were eligible for inclusion. Serial clinical and breath data were obtained three times a week, from admission up to a maximum of 10 days. Bronchial lavage for semiquantitative culture was collected immediately prior to breath sampling. Breath samples were collected in triplicate for off-line analysis by thermal-desorption/gas chromatography/time-of-flight mass spectrometry. Breath data were recorded as retention time/mass ion pairs, and analysed (pathogen present vs absent) by ANOVA-mean centre principal component analysis.
Results Samples were collected from 46 patients (mean (SD) age 49 (19) years; 27 male). The dominant factors affecting breath sample analysis were the individual breath profile and duration of intubation. When these were taken into account, clear separation was seen between breath profiles at each time point by the presence/absence of pathogens. Loadings plots identified consistent metabolite peaks contributing to this separation at each time point.
Conclusions Breath volatile analysis is able to classify breath profiles of patients with and without significant pathogen load in the lower respiratory tract. If validated in independent cohorts, these findings could lead to development of rapid non-invasive point-of-care surveillance systems and diagnostics for lower respiratory tract infection in the intensive care unit.
- Bacterial Infection
- Exhaled Airway Markers
- Pneumonia
- Respiratory Infection
Statistics from Altmetric.com
Key messages
What is the key question?
-
Are specific breath volatile profiles associated with the presence of lower respiratory tract pathogens in ventilated patients at high risk of pneumonia?
What is the bottom line?
-
The breath profile contains volatile biochemical species that could reliably discriminate between pathogen-positive and pathogen-negative patients when tested at multiple time points during the course of their critical illness.
Why read on?
-
This is the first study to demonstrate that metabolites in breath profiles are associated with pathogens in the lower respiratory tracts of ventilated patients, and might form the basis of novel diagnostic algorithms.
Introduction
Hospital acquired infections are a leading cause of morbidity and mortality, and result in significantly increased healthcare costs.1–3 Invasively ventilated patients are at particular risk of ventilator associated pneumonia (VAP), as they often have severe concomitant illness, and many of the normal defence mechanisms are either suppressed or bypassed. Surveillance and diagnosis are difficult, relying on clinical assessments in conjunction with time-consuming microbiological laboratory evidence which requires the culture of respiratory tract samples.4 ,5 Pathogen identification is critical for accurate diagnosis and treatment, but currently based on culture technology, which can take days to realise. The inevitable consequence is the frequent use of broad spectrum antimicrobial therapy when VAP is suspected, which can result in the development of multiresistant organisms, Clostridium difficile infections and associated acquisition costs. An urgent global challenge has therefore emerged, to develop surveillance and diagnostic technologies that could provide accurate information within a short time frame and so allow more informed use of antibiotic therapy at an early stage.6 This challenge has been championed by WHO,7 endorsed by national governments2 and highlighted within international consensus-derived sepsis guidelines.8
Metabolic degradation products include volatile organic compounds (VOCs), which can be detected in the gas emitted from an organism, from the headspace above pathogen cultures9 and in human breath using highly sensitive technologies such as nuclear magnetic resonance spectroscopy and mass spectrometry.10 ,11 These compounds offer great potential as pathogen biomarkers—they are direct consequences of metabolic processes, whether normal or altered, and can be analysed rapidly, accurately and non-invasively at a relatively low cost,12 with the potential for point-of-care testing once suitable sensors are developed for the recognition of diagnostic chemical species.
We therefore aimed to investigate whether breath metabolic profiling could be used to identify specific patterns of volatiles associated with lower respiratory tract pathogens in patients at risk of developing VAP. We first developed a breath sampling methodology for use in invasively ventilated patients on intensive care, and then performed a first-in-man clinical study with longitudinal sampling of patients at risk of acquiring pathogens in the lower respiratory tract during mechanical ventilation.
Methods
Participants
Patients undergoing invasive mechanical ventilation in the intensive care unit (ICU) at Salford Royal Hospital were considered for recruitment to this study. Inclusion criteria at recruitment were: age over 17 years; presenting diagnosis of sterile tissue injury; and requirement for invasive ventilation. Exclusion criteria at recruitment were: clinical suspicion of sepsis; malignancy; expected survival under 48 h. Patient samples were collected as part of routine emergency care with samples included in the study if patient consent and/or assent from consultees was given. We destroyed the data where permission was not granted or achieved.
Study design
Patients were sampled serially over the course of their ICU stay, up to a maximum of five occasions. Sampling occurred every 2–3 days, between 9:00 and 11:00 on Mondays, Wednesdays and Fridays to coincide with routine clinical microbiological surveillance of the lower respiratory tract of mechanically ventilated patients.5 Clinical details related to the patient diagnoses and investigations were recorded, including data related to physiology, radiology, microbiology as well as blood biochemistry and haematology. In addition serum was analysed for the inflammatory cytokines interleukin (IL)-6 (Sanquin Pelikine Compact Human IL-6 (M1916), Mast Diagnostics, Bootle, UK), IL-10 (Sanquin Pelikine Compact Human IL-10 (M1910), Mast Diagnostics, Bootle, UK) and procalcitonin (VIDAS BRAHMS (30450), BioMerieux, Basingstoke, UK).
Immediately prior to breath sampling airway suction was performed via the endotracheal tube in order to clear secretions, followed by non-directed bronchial lavage with installation of 10 mL of sterile 0.9% saline, with the sample aspirated using a fresh suction catheter, and sent for microbiological analysis.
Measurements
Breath sampling
A novel sampling apparatus was developed for the specific purpose of capturing volatiles from the distal intratracheal air of mechanically ventilated patients (figure 1). Samples were collected by connecting the breath sampling system to a sterile closed suction catheter (Ref: 215125-5, Kimberly-Clark, Kent, UK), in turn connected to a bacterial and hydrophobic filter (Ref: 2000/05, Air Safety Limited, Lancashire, UK) and this to a sterile adsorbent sampling tube packed with Tenax TA/Carbotrap (Markes International, Rhondda Cynon Taff, UK) for off-line analysis. Standard disposable oxygen tubing was used to connect the components of the breath sampling system. Endotracheal samples were drawn using a precision air sampling pump (Escort ELF Pump, Supelco, Dorset, UK) set up at 0.5 L/min. During sample collection the inspired oxygen fraction was set at one.

Schematic: breath sampling equipment for ventilated systems. Intratracheal air is sampled at 1 L/min (regulated by an air-sampling pump (G)) onto an adsorbent trap (F) via oxygen tubing (E), a bacterial/hydrophobic filter (D), and a suction catheter (C) placed in the endotracheal tube (A) via the standard access port (B).
Three consecutive samples of 0.5 L each were taken per patient per study visit. Electronic sample tracking was facilitated using sampling tubes supplied with TubeTAG (Markes International, as before) radio-frequency ID tag assemblies. Patient reference study code, time and date was logged for each sampling TubeTAG for later laboratory identification and analysis. If samples were not sent to the lab for immediate analyses, they were stored in a refrigerator at 4°C for a maximum of 7 days.
Sample analysis
Analysis of breath samples was performed by thermal desorption/gas chromatography/time-of-flight mass spectrometry (TD/GC-MS, Markes Unity, Markes International, as before and GCT Premier, Waters Corp, Manchester, UK). Four-bromofluorobenzene 110 L in N2 1ppmv (Thames Restek, Bucks, UK) was added to the breath samples as an internal standard prior to analysis. Between each patient sample a quality control mix (EPA GRO mix, Supelco, as before), and tube-blank were run through the system in order to monitor stability and cleanliness of the system. Adsorbent tubes underwent two-stage thermal desorption (Series 2 Ultra autosampler, Markes International, as before) by first heating the adsorbent tube to 250°C for 10 min and directing the resultant compounds at 50 mL/ min towards a cold trap kept at 1°C. For the second stage, the cold trap was heated for 10 min at 280°C and volatiles transferred to the GC column for separation, prior to analysis by a time-of-flight MS (GCT Premier, Waters, as before). Flow path temperature was 160°C. An Agilent 6890 oven was equipped with a RTX-5 amine column (30 m, 0.25 mm I.D., 0.5 μm film thickness, Thames Restek, as before). The GC oven operated on a ramp program with an initial temperature of 40°C (no hold time), ramp to 100°C at 8°C/min, then ramp to 170°C at 6°C/min and finally to 225°C at 8°C/min. The total GC run was 26 min. A post run was set up where the oven was ramped from 225°C to 250°C for 2 min. The ToF-MS (7000 Resolution FWHM definition) was in electron ionisation mode, set at 70 eV. The source temperature was set to 200°C, at a trap current of 200 μA and spectra were recorded in dynamic range extension mode at 10 scans/s over a range of 50–650 m/z.
Microbiology
A dilution method5 was used with each lavage fluid sample to give a quantitative bacterial count with a cut-off of 104 colony forming units/mL. In summary, 0.5 mL of vortexed sample was pipetted into 5 mL of diluent and mixed. Using a 10 μL plastic loop, sample was inoculated onto a range of selective agar media and processed using standard laboratory techniques. All isolates with a growth of more than 10 colonies were reported as >104 colony forming units/mL. If there was no growth (or less than 10 colonies) after 48 h incubation, cultures were reported as ‘no significant growth’.
Data analysis
Clinical data were summarised using descriptive statistics. Analysis of the GC-MS data followed Metabolomics Standards Initiative (MSI) reporting standards13 and was performed on the total ion intensities, with the chromatograms baseline corrected, aligned, square root scaled and normalised such that the sum of squares for each chromatogram equalled one as described previously.14
To investigate the difference in breath profiles between classes (ie, pathogen present vs pathogen-free) we used principal component analysis and its extension ANOVA-mean centre (ANOVA-MC)15 which is a recently developed model which aims to overcome the high between-subject variability that results from the dominant effect of the personal breath profile, a common problem in breath studies. The results were validated using a permutation test as described in ref 15. For further details please see the online supplementary methods. The ANOVA-MC analysis was performed on each time point separately, in order to see whether any separation between classes was consistent across time points. This is important because multivariate analysis performed on data sets containing large numbers of variables is associated with a high risk of overfitting.16 An appropriate validation is therefore always needed to confirm whether the pattern revealed by the data analysis is genuine or the result of overfitting. We therefore subjected our data to two forms of validation; internal (same time point) validation using bootstrap resampling and permutation test, and external (later time point) to examine whether the separation between classes was repeated over time. The loadings plots of the ANOVA-MC model at each of the five time points were compared and VOCs with significantly high loadings across all time points were considered as potentially discriminatory variables. The full mass spectra of these compounds were extracted by using a multivariate curve resolution-alternating least square procedure and tentative identifications (MSI level 217) assigned by comparing the pure spectra with the National Institute of Standards and Technology 02 (NIST 02) library.
Results
Samples were collected from 54 patients and assent obtained for 46 consultees between January and July 2010. Demographic details are shown in table 1
Demographics of the 46 patients included in the study
The first sampling day for 33 (71%) patients was within 2 days of admission to the ICU, and for 2 (4%) it was more than 10 days. Twenty-six (57%) patients provided breath samples on at least two sample days, and eight (17%) provided five samples, over the course of 10 days. There were a total of 107 sample days. Details of individual patient-sampling days and microbiology results are given in the online supplementary table. Thirty-one (67%) patients had negative respiratory and blood culture samples at baseline, and 20 (43%) remained culture-negative for the duration of the study, although only 2 of these were sampled on more than two occasions. The most commonly isolated pathogens were Haemophilus influenzae (in 12 samples from 10 patients) and Staphylococcus aureus (18 samples from 10 patients). There were no differences in age, gender or frequency of significant medical comorbidity between those with and without infection (either at baseline or at any time).
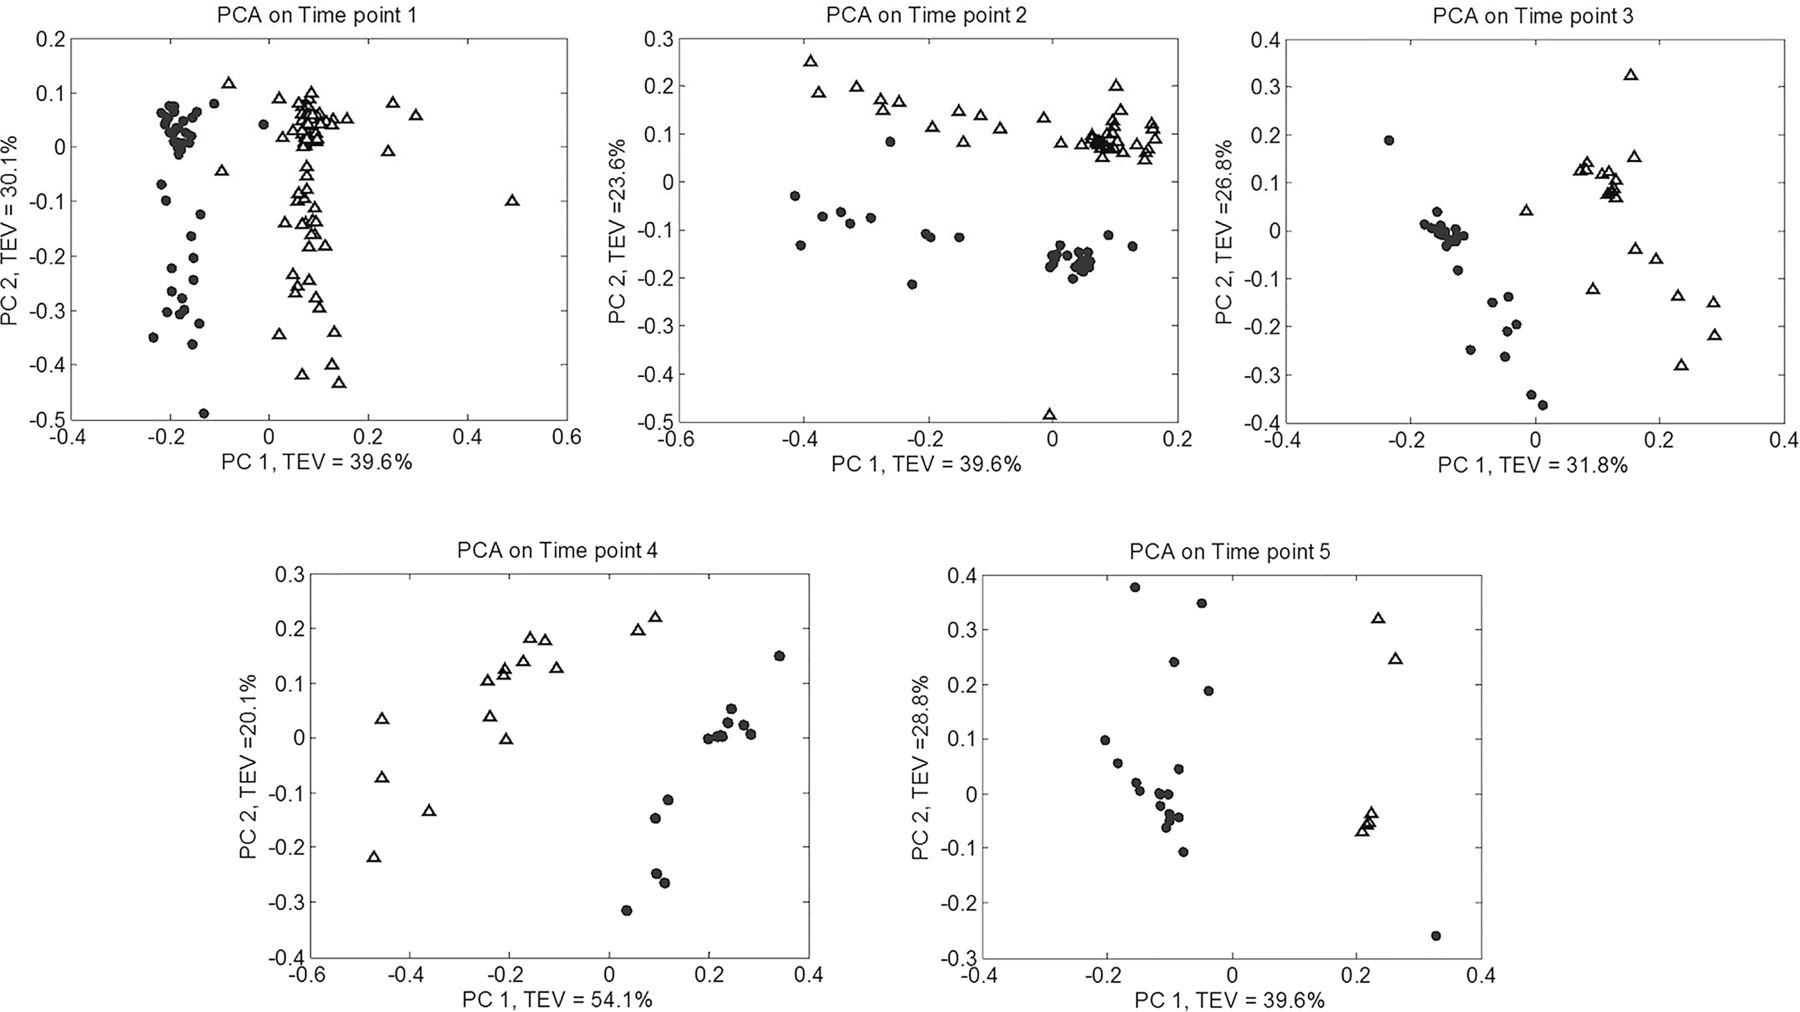
When the data from time point 1 were initially analysed by principal component analysis no evidence of separation between samples from pathogen-positive and pathogen-negative patients was observed; the signal was dominated by the personal breath signature, with individual patient samples clustering very closely together. When ANOVA-MC transformation was applied however, a clear separation was seen between data from infected and non-infected patients, and furthermore this separation was replicated when data from the other four time points were analysed in this way (figure 2). A loadings plot that illustrates the relative contributions of the chromatographic peaks to this separation at each time point is shown in figure 3. It can be seen that several of these peaks have high loadings for each model (arrows). Many of these peaks could not be identified, but putative identification (MSI level 2) was possible for some by matching retention time and GC-MS data against an external metabolite library (NIST 02). Compounds found to be lower in concentration in the breath of infected versus non-infected patients include (database reverse match factor in parentheses; perfect match=1000) ethanol (929), 2-methyl cyclopentanone (809), heptane (785) and N-cyclohexyl-N′(2-hydroxyethyl)thiourea (546); while those found in higher concentration included 3-carene (913), n-butyric acid 2-ethylhexyl ester (856), nonanal (833) and 2,6,11,15-tetramethyl-hexadecane (780).

The ANOVA-mean centring approach was used to successfully adjust for the individual signature. By analysing the five sampling days separately, clear separation between samples from infected (solid circles) and non-infected (open triangles) patients can be seen. PCA, principal component analysis; PC, principal component; TEV, total explained variance.

Loadings plots for the data derived from the ANOVA-MC analysis for each of the five sampling time points. Arrows and dashed lines represent the eight putatively identified compounds in the text. It can be seen that there are many other compounds with significant impact on the separation which have not been possible to identify. PC, principal component; RT, retention time.
The internal validation procedure using bootstrap resampling and the corresponding permutation tests suggests a very low chance of false-positive and an even lower percentage of false-negative results as shown in table 2. For example, at the first sampling day the model sensitivity (true positive rate) showed an average of 98% and specificity (true negative rate) of 97%. The sensitivity, and to a lesser extent the specificity, decreased at the later sampling days, almost certainly due to the decreasing numbers of patients sampled at later time points.
Averaged clustering results derived by bootstrapping for the classification of breath samples by the presence of airway pathogens
Sampling was performed without incident throughout, except for one occasion where the procedure had to be interrupted due to the patient rousing, and the patient settled quickly before sampling recommenced successfully.
Multivariate analysis (independent t test using log10 transformed data) showed none of the blood inflammatory biomarkers measured (procalcitonin, IL10, IL6, Il10/6 ratio, total white cell count) predicted the presence of lower respiratory tract pathogens.
Discussion
This is the first study to our knowledge that reports a systematic investigation of breath profiles in severely ill ventilated patients for VOC changes associated with the presence of lower respiratory tract pathogens. Multivariate analysis, after compensation for the large personal VOC signature, clearly showed separation of breath VOC profiles between patients with and without pathogens. Our confidence that these represent true differences is increased by two forms of validation. First, permutation testing demonstrated that the chance of false discovery was very low, especially at the earlier time points where sample numbers were large. Second, those VOCs that contributed most to the classification were observed across all five time points. Future work now should aim to provide true external validation using samples collected in an independent group of patients, recruited from other ICUs.
We chose to address a very clearly defined clinical question in this study: whether the volatile metabolites from breath profiles were discriminatory in patients with and without clinically significant numbers of lower airway pathogens. This is linked to, but not the same as, clinical terms such as infection and VAP. However such terms are themselves composite measures defined on the basis of a combination of clinical factors, whereas we felt that for our proof of concept we needed a more defined pathogen surveillance-based outcome. What we have demonstrated is that breath VOC analysis now merits investigation as a potentially rapid, minimally invasive and reliable alternative to lower respiratory tract surveillance using non-directed bronchial lavage. The relatively high number of patients found to have pathogens present at the initial sampling days (33%) corroborates previously reported data and therefore highlights the need for fast methods in high-risk clinical settings. In addition, with this proof of concept we would have more confidence in suggesting breath analysis now also merits further study in the setting of lung infection-related syndromes such as VAP, in association with more invasive reference standards such as semiquantitative microbiological culture and protein biomarker measurements from bronchoalveolar lavage samples.18
It is worth considering the origin of the VOC changes that we have demonstrated. There is much literature on pathogen-related VOCs isolated in vitro but these have not been shown to be diagnostically useful in vivo (reviewed in ref. 9). It may be that the dominating metabolic influence on the breath VOC profile in infection is not related solely to the pathogens, but to the inflammatory sequelae. Some of the VOCs that we have putatively identified as markers do have some precedence in the literature and support this hypothesis. We demonstrated ethanol levels were lower in the pathogen-positive group, in keeping with Rai and colleagues who demonstrated that low exhaled ethanol levels were found in the exhaled breath condensate of patients with acute respiratory distress syndrome.19 Aldehydes and methylated alkanes have repeatedly been associated with oxidative stress and inflammation,10 ,20–22 and indeed we identified higher levels of such compounds (nonanal and 2,6,11,15-tetramethyl-hexadecane) in the pathogen-positive patients.
For this proof of concept study we studied a group of patients with sterile tissue injury in order to minimise the effect of confounding comorbidities, in particular patients admitted due to complications of acute or chronic lung disease and hence perhaps with altered airway microbiomes at admission. Although four of our participants had asthma and two COPD, this was not the reason for admission, and indeed while three of these six did have pathogens present at the time of first sampling, this proportion was not different from the rest of the cohort (where 12 of 40 grew pathogens in the first sample).
Advantages of our sampling methodology include: first, it was developed specifically to enable us to sample from beyond the endotracheal tube and hence to exclude air from the upper respiratory tract. Second, the procedure was safe and relatively simple to perform by a trained researcher embedded within the critical care environment, without interfering with routine patient-focused care and procedures. Third, our procedure was minimally invasive and the analytical methodology by GC-MS can return results within a matter of hours, compared with days with traditional culture methods. Further refinement of the sampling process should aim to simplify it yet further, potentially by moving the sample point further downstream, away from the patient. Refinement of breath analysis would aim to speed up the process, ideally towards online analysis for example using electronic nose technology, as has been tested with some success in adult respiratory distress syndrome.23 ,24 In the future when highly diagnostic markers are discovered these can be assayed directly at the bedside using simple bioassays targeted at these discriminatory molecules.
In conclusion we have demonstrated that volatile metabolites in the breath of ventilated patients at high risk of developing VAP show distinct patterns that enable the differentiation of patients with and without pathogens in the airway. If these findings are replicated in independent prospective cohorts then integrative clinical protocols should be developed for testing in this critically ill patient population, with the aim of improving disease stratification and treatment selection.
Acknowledgments
The authors gratefully acknowledge the patients who took part in this study, and their relatives; Ann Keen, research nurse, who provided invaluable assistance with the collection of breath samples and clinical data; Dr Geoffrey Warhurst for cytokine analysis; Dr Murad Ghrew for assistance with clinical data collection; and Waters Corporation for loan of mass spectrometry equipment. YX thanks the Cancer Research UK (including Experimental Cancer Medicine Centre award) and the Wolfson Foundation, and RG thanks BBSRC for support.
References
Supplementary materials
Supplementary Data
This web only file has been produced by the BMJ Publishing Group from an electronic file supplied by the author(s) and has not been edited for content.
Files in this Data Supplement:
- Data supplement 1 - Online supplement
Footnotes
-
SJF and MB-S contributed equally.
-
Contributors All authors were involved in study conception and design, data interpretation and manuscript revision. All authors have approved the final manuscript. In addition SJF took overall responsibility for study procedures, developed the sample methodology with MB-S and PMD, and drafted the manuscript. MB-S developed the analytical methodology and performed breath sample analysis. YX performed metabolomic data analysis. RG supervised data analysis; and PMD developed and wrote the clinical trial protocol and ethical application; and oversaw clinical data collection.
-
Funding Funding for this study was provided jointly by University of Manchester Intellectual Property (UMIP) and Manchester: Integrating Medicine and Innovative Technology (MIMIT).
-
Competing interests None.
-
Ethics approval North West 6 Research Ethics Committee.
-
Provenance and peer review Not commissioned; externally peer reviewed.
Linked Articles
- Airwaves