Article Text

Abstract
Background Forced expiratory volume in 1 s as a percentage of predicted (%FEV1) is a key outcome in cystic fibrosis (CF) and other lung diseases. As people with CF survive for longer periods, new methods are required to understand the way %FEV1 changes over time. An up to date approach for longitudinal modelling of %FEV1 is presented and applied to a unique CF dataset to demonstrate its utility at the clinical and population level.
Methods and findings The Danish CF register contains 70 448 %FEV1 measures on 479 patients seen monthly between 1969 and 2010. The variability in the data is partitioned into three components (between patient, within patient and measurement error) using the empirical variogram. Then a linear mixed effects model is developed to explore factors influencing %FEV1 in this population. Lung function measures are correlated for over 15 years. A baseline %FEV1 value explains 63% of the variability in %FEV1 at 1 year, 40% at 3 years, and about 30% at 5 years. The model output smooths out the short-term variability in %FEV1 (SD 6.3%), aiding clinical interpretation of changes in %FEV1. At the population level significant effects of birth cohort, pancreatic status and Pseudomonas aeruginosa infection status on %FEV1 are shown over time.
Conclusions This approach provides a more realistic estimate of the %FEV1 trajectory of people with chronic lung disease by acknowledging the imprecision in individual measurements and the correlation structure of repeated measurements on the same individual over time. This method has applications for clinicians in assessing prognosis and the need for treatment intensification, and for use in clinical trials.
- Cystic fibrosis
- longitudinal
- model
- lung function
- %FEV1
- clinical epidemiology
- COPD epidemiology
- paediatric asthma
- paediatric lung disease
- paediatric physician
- respiratory infection
- viral infection
This is an open-access article distributed under the terms of the Creative Commons Attribution Non-commercial License, which permits use, distribution, and reproduction in any medium, provided the original work is properly cited, the use is non commercial and is otherwise in compliance with the license. See: http://creativecommons.org/licenses/by-nc/2.0/ and http://creativecommons.org/licenses/by-nc/2.0/legalcode.
Statistics from Altmetric.com
- Cystic fibrosis
- longitudinal
- model
- lung function
- %FEV1
- clinical epidemiology
- COPD epidemiology
- paediatric asthma
- paediatric lung disease
- paediatric physician
- respiratory infection
- viral infection
Key messages
What is the key question?
-
Now that people with cystic fibrosis are living much longer, how can we optimally describe the changes in forced expiratory volume in 1 s as a percentage of predicted (%FEV1) over time in a way that is useful for clinicians at the individual and the population level?
What is the bottom line?
-
We describe a novel modelling approach for analysing changes in %FEV1 over time that can be applied at the individual level to interpret the clinical significance of sudden changes in %FEV1, and at the population level to quantify the effect of factors such as Pseudomonas aeruginosa acquisition.
Why read on?
-
Lung function measures are correlated for over 15 years, and a baseline %FEV1 value explains 63% of the variability in %FEV1 at 1 year, 40% at 3 years and about 30% at 5 years.
Introduction
Understanding the long-term natural history of changes in lung function in people with lung diseases is a research priority.1 In order to do this, objective measures of disease progression are necessary. The per cent predicted forced expiratory volume in 1 s (%FEV1) is commonly used to monitor lung function, and to describe disease severity in cystic fibrosis (CF)2 and chronic obstructive pulmonary disease (COPD).3 %FEV1 is used to inform clinical decisions about changing or intensifying treatment, and as an outcome measure in clinical studies.4–6 Furthermore %FEV1 has been shown to be related to survival in CF. Kerem et al's study in 1992 demonstrated that patients with a %FEV1 <30 had a 2-year mortality over 50%,7 though a more recent study shows that survival rates at low levels of lung function have improved in subsequent cohorts.8
Interpreting the significance of changes in %FEV1 in CF to inform patient management and to counsel patients regarding prognosis requires an understanding of the inherent variability of %FEV1 measures within individuals, to determine what constitutes a clinically significant deterioration in %FEV1, rather than a change due to measurement error, or recoverable day-to-day fluctuation in lung function.9 ,10 Furthermore, this variability needs to be understood to make valid inferences about the association between covariates and %FEV1 in observational studies.
As survival in CF improves with successive cohorts, there are many more people surviving into late adulthood. An implication of this, coupled with the availability of long-term follow-up data in CF registers, is that up to date methods should be adopted to interpret the long-term dynamics of lung function in CF. Statistical techniques for longitudinal data analysis have been the subject of much methodological development over the past 20 years, and the random intercept and slope model has become a popular analysis framework.4 ,5 ,11–14 While this is often appropriate for relatively short follow-up periods, there are theoretical reasons to suggest that this approach makes assumptions that will lead to incorrect inferences if applied over longer follow-up periods. One central assumption is that the variability in %FEV1 increases as a quadratic function over time (in proportion to time squared), which leads to estimates that diverge unrealistically over longer time periods. Methods for undertaking these analyses over longer time periods have been described,15 but have not been commonly applied.
In this study we analyse a unique population-level dataset of people with CF that includes longitudinal %FEV1 measures taken monthly for up to 30 years. We apply these methods to develop a general model for %FEV1 decline that goes beyond the popular random-intercept and slope approach, and explicitly describes the variability in %FEV1 within individuals over time. We show how this could be applied clinically to help interpret the significance of changes in lung function, and at a population level to explore the association of covariates (eg, Pseudomonas aeruginosa acquisition) with %FEV1 decline.
Methods
Subjects
All patients aged over 5 years whose %FEV1 data were entered on the Danish CF database between 1969 and 2010 were eligible. Post-transplant data from patients who had received a lung transplant were excluded. Patients attending the two Danish CF centres (Copenhagen and Aarhus) are seen routinely every month in the outpatient clinic for evaluation of clinical status, pulmonary function and microbiology of lower respiratory tract secretions. It is estimated that coverage of people with CF resident in Denmark is almost complete from 1990 when CF care was centralised. This coverage and the unparallelled frequency of measurement make this a unique dataset for epidemiological research. The study was approved by the Danish Data Inspectorate (Datatilsynet).
Lung function testing
The primary outcome for this analysis was %FEV1. Pulmonary function tests were performed according to international recommendations,16 measuring FEV1, expressed as a percentage of predicted values for sex and height using reference equations from Wang or Hankinson.17 ,18
Covariates
Covariates in the analysis were age, sex, genotype coded as the number of Delta F508 alleles (0, 1 or 2), onset of chronic Pseudomonas infection (coded 0 or 1 as a time-varying covariate), pancreatic insufficiency determined on the basis of pancreatic enzyme usage (coded 0 or 1 as a baseline covariate), birth cohort (six 10-year cohorts starting at 1948), and CF-related diabetes (CFRD) diagnosed using the WHO criteria (coded 0 or 1 as a time-varying covariate).
Statistical analysis
A detailed explanation is given in the online appendix. Repeated %FEV1 measures on individuals are correlated, and this must be accommodated to obtain valid inferences. We used a linear mixed effects model with longitudinally structured correlation,15 ,19 and contrasted our approach with the widely used random intercept and slope model.20 We modelled random variation in %FEV1 over time for an individual subject so that the strength of the correlation of the random variation between two values depends on the corresponding time separation. The model decomposed the overall random variation in the data into three components: between subjects, between times within subjects, and measurement error.
First, we fit a provisional model for the mean response by ordinary least squares and used the empirical variogram of the residuals (see figure E1 in the online appendix) to provide initial estimates for the three components of variation, and for the shape of the correlation function of the between-times-within-subjects component. We then re-estimated all of the model parameters by maximum likelihood estimation, and used generalised likelihood ratio statistics to compare nested models, and Wald statistics to test hypotheses about model parameters. We assessed associations between single or multiple covariates and the population mean %FEV1 over time, and explored alternatives to a linear function for the population-averaged time trend.
Results
Population characteristics
The dataset contained 70 448 lung function measures on 479 patients seen between 1969 and 2010 in Denmark (table 1). The median number of %FEV1 measures per person was 101 (range 2–597). The median follow-up period was 10.5 years (range 0.1–31.5), with a total of 6500 person-years of follow-up. Forty-two patients were followed up for more than 30 years (see also figures E2 and E3 in the online appendix).
Baseline characteristics of the Danish cystic fibrosis (CF) population
Limitations of random intercept and slope model
The high degree of short-term and long-term variation in predicted %FEV1 is illustrated in figure 1. The standard random intercept and slope model approach is illustrated over long and short follow-up periods in figure 1A,C. This approach assumes that any deviation of an individual's trajectory from the population mean is linear in time over the whole of the follow-up period apart from independent random errors. One can see that this assumption is reasonable over short time periods, as illustrated by the fit of the shorter dotted-line segments (figure 1A,C), but over longer time periods the individual data traces diverge unrealistically from their fitted linear mean trajectories (long solid line). Our proposed model produces a much closer fit to the data (figure 1B,D), and one that better reflects the relative magnitude of the three estimated components of variation in %FEV1 over time.

Comparison of conventional random intercept and slope model over short and long follow-up periods, versus our proposed Gaussian process model. (A) Data for a single individual, illustrating that a linear trend fits reasonably well over short time periods, but gives a very poor fit to this individual's complete data; linear trends are fitted by ordinary least squares. (B) The same data with the fitted trajectory of the stationary Gaussian process model. The smoothed fitted trace is a better representation of the ‘true’ underlying lung function, and could be used in real time to guide the interpretation of sudden changes in lung function. For instance, the sudden drop to under 30% indicated by the arrow is not mirrored in the model trace, suggesting that this may be recoverable random fluctuation. (C, D) Corresponding plots for a second individual. %FEV1, forced expiratory volume in 1 s as a percentage of predicted.
Quantifying the variability in %FEV1 over time
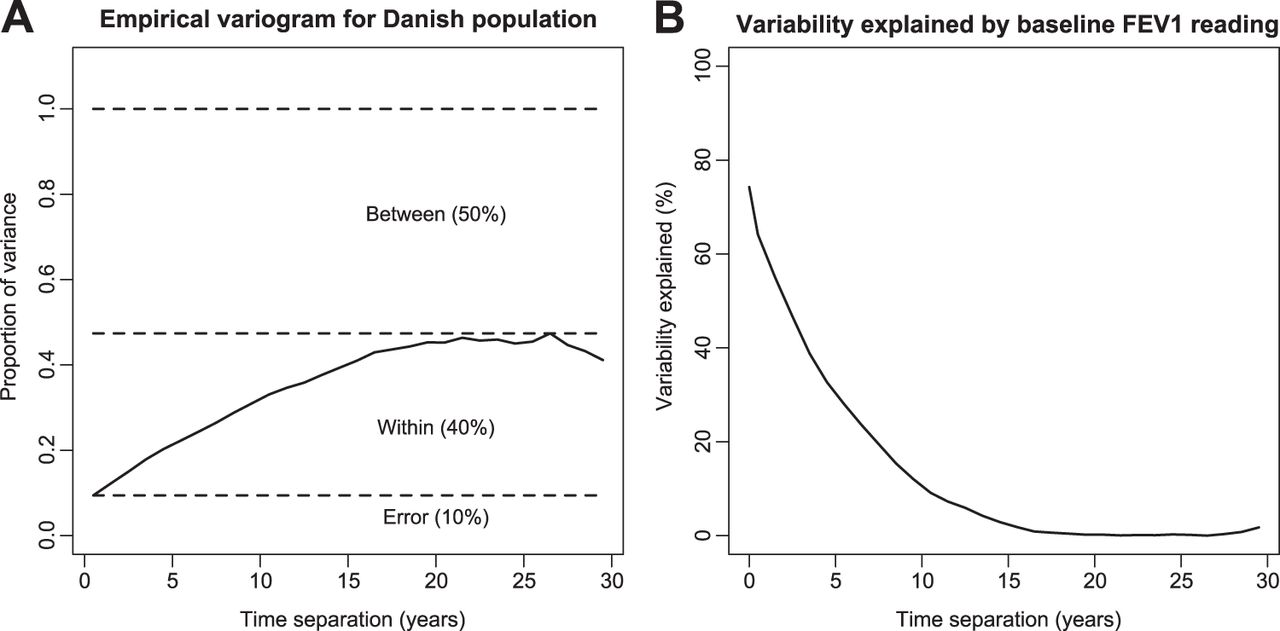
The empirical variogram quantifies the variability in the dataset (figure 2A). The intercept at time zero represents measurement error because there can be no true within-person variation at a time lag of zero. Of the total variance in the Danish dataset, about half is due to systematic differences between patients (eg, genotype, sex or pancreatic status), two-fifths is within patients, representing change over time (disease progression), and one-tenth is ‘measurement error’. In practice, this last component represents the combined effects of technical errors, and physiological variability occurring at time intervals less than the monthly interval of measurement, for example, day-to-day variability. This error variance equates to an average SD of 6.3% for repeated measures on the same individual at short time intervals. Figure 2B shows the proportion of the within-person variability in %FEV1 at follow-up time (t), which can be explained by their %FEV1 value at baseline. For example, about 50% of the within-patient variability at t=2.5 years is explained by the baseline measurement, and about 30% at t=5 years. Overall, the dependence on baseline measures gradually decays and is negligible at 15 years.

Quantifying the variability in forced expiratory volume in 1 s as a percentage of predicted (%FEV1) with the variogram approach. (A) Scaled empirical variogram for the Danish data. The solid line (variogram function) represents the variance of the difference between residual errors within individuals at time lags from 0 to 30 years. The variogram function increases up to about 15 years, corresponding to a decreasing correlation between paired lung function measures with increasing time separation. The variogram partitions the variability in the data into three components: within person, between person, and error. (B) Proportion of variability in an individual's %FEV1 at follow-up time t that is explained by their %FEV1 at baseline. This shows that the variogram can predict 63% of the variability from the population average at 1 year, which decreases to around 60%, 40%, 30% and 10% at 2, 3, 5 and 10 years respectively.
Clinical utility of our proposed model
The model can be used to guide interpretation of sudden changes in lung function. Consider seeing the person in figure 1B at around age 9 (as indicated by the arrow in the figure), when her lung function has dropped to below 30%. On the basis of this one-off measurement, one might be quite guarded in terms of prognosis. However, our modelled trace (thick black line in figure 1B) suggests that her underlying lung function is changing less dramatically, with a modelled %FEV1 of around 50%. We suggest that this estimate provides a more realistic assessment of underlying lung function by smoothing out the short-term variability. This could be a useful adjunct to clinical decision-making. As well as providing information about the significance of a sudden change in lung function, figure 2B also quantifies the predictive value of a contemporary %FEV1 measure. In terms of counselling patients, this means that a higher %FEV1 today is associated with a higher %FEV1 at subsequent time points, but the predictive value deteriorates over time as illustrated in the figure.
Effect of covariates on lung function in the Danish population
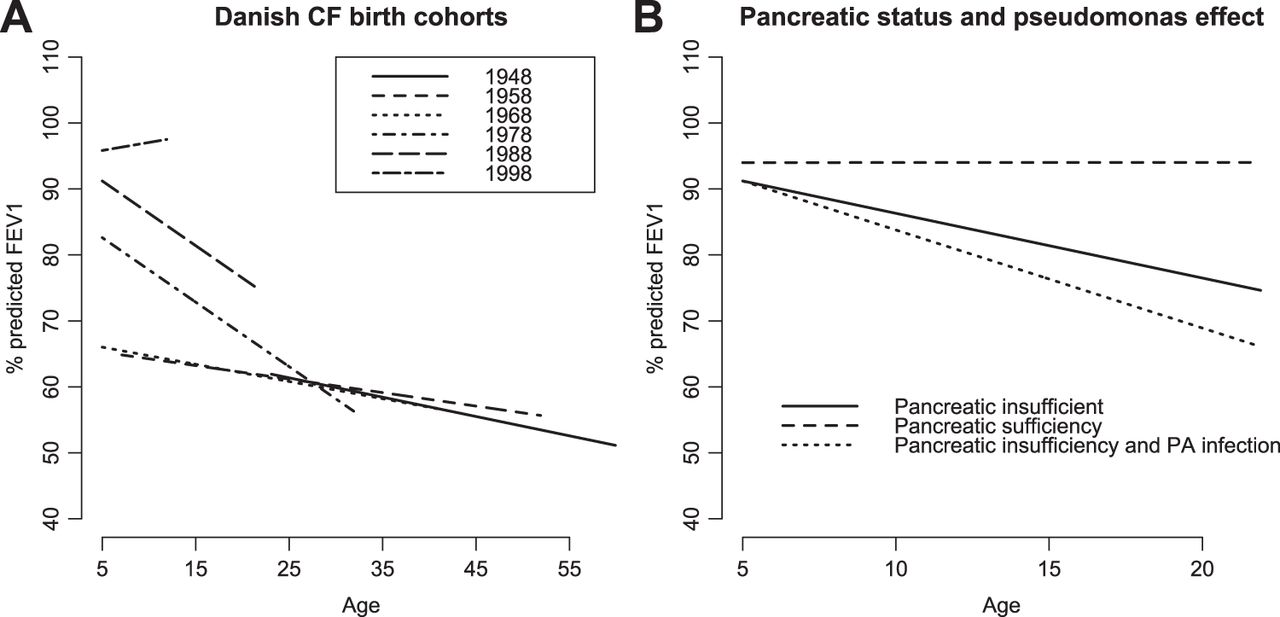
We explored the effect of covariates that have been associated with %FEV1 in previous studies to demonstrate how this model can be used to answer questions at the population level (see table E1 online appendix for univariate associations).4 There was no evidence to suggest that covariate effects were nonlinear (see figure E4 in online appendix). The final model included age, Pseudomonas status, pancreatic status, cohort and CFRD (table 2). Note that the estimated covariate effects in table 2 are population-averaged effects, that is, they describe average values of %FEV1 for sub-populations of individuals sharing the same explanatory characteristics, rather than for any one individual. The most prominent effects are associated with birth cohort, pancreatic function and the onset of Pseudomonas infection (figure 3). There is clear separation between the three most recent birth cohorts, with a successive increase in the intercept term at age 5 (83% in the 1978–88 cohort vs 96% in the post-1998 cohort) (figure 3A and figures E9–E10 in online appendix). There is a large change in the point estimate for the rate of change of lung function in the post-1998 (0.24%) compared with the 1988–98 cohort (−1% per year), such that the post-1998 cohort appears to be improving over the period of measurement. The three cohorts spanning the years 1948–1978 have a similar overall rate of decline around −0.3% per year, with an intercept at age 5 of 66%. Pancreatic insufficiency is associated with a significantly steeper rate of decline of lung function (−0.92% per year, 95% CI −1.7 to −0.3), as is acquisition of Pseudomonas infection (−0.5% per year, 95% CI −0.72 to −0.3) (figure 3B and figure E8 in online appendix). CFRD is associated with a drop in intercept of −2.5% (95% CI −3.6% to −1.37%), but has no effect on the rate of decline of lung function.
Estimates from final multivariate model
Effect of covariates on forced expiratory volume in 1 s as a percentage of predicted (%FEV1). (A) Birth cohort effect in the final model. There is clear separation between the three most recent birth cohorts, with a successive increase in the intercept term at age 5 years. (B) Effect of pancreatic insufficiency and Pseudomonas infection on the predicted population trajectory for a person born in the 1988–1998 cohort. CF, cystic fibrosis; PA, Pseudomonas aeruginosa.
Discussion
We describe a novel longitudinal modelling technique specifically aimed at analysing long sequences of repeated measurements, and apply this to %FEV1 from a CF population. We show how this approach could be used to inform patient management, by aiding the interpretation of sudden changes in lung function, and by quantifying the predictive value of a baseline %FEV1 measure up to 15 years later. At the population level, we show how our model can be used to quantify the effect of covariates on populations or sub-populations. Translation of these methods into clinical practice is important because people with CF are living longer, and we have shown how commonly applied approaches are unhelpful over long follow-up periods.
This study quantifies the short-term variability in %FEV1 in this population (SD 6.3%), and demonstrates that %FEV1 measures within individuals are correlated over time lags of 15 years or more. We have also explored the effect of previously studied risk factors for lung function decline in the Danish CF population, and have demonstrated significant effects of birth cohort, pancreatic status and Pseudomonas infection status.
The findings from this study have a number of clinical applications. Quantifying the variability in lung function measures is essential to make correct clinical interpretation.10 Exploiting the unusually high frequency of data collection in Denmark, this study implies that on average a change in %FEV1 of >13% (ie, twice the error SD, to give a 95% confidence range) is likely to represent true within-patient variation over time (disease progression), whereas anything less than this could be due to short-term fluctuation, which may recover. Stanbrook et al 21 found a pooled within-subject %FEV1 SD of 4.5% when measured over a 9-day period in 21 stable adults with CF. This population is different to the population in our study, who were measured regardless of clinical status, and one would therefore expect greater variability. Other studies have shown that people with CF, asthma and COPD have more short-term variability in lung function tests22–24 and that more impaired lung function is associated with greater variability.25
Our model can be used to generate an underlying representation of an individual's ‘true’ lung function trajectory (figure 1B,D) that smoothes out the noise inherent in %FEV1 measures. These smoothed traces could be used to inform clinical decision-making—the model fit curves in figure 1 provide more realistic estimates of underlying lung function, and more valid criteria for clinical decisions. We propose that this model could be used to develop a real-time smoothing tool embedded in electronic patient records to aid clinical interpretation of spirometry data. We suggest that access to this information would provide some re-assurance to patents experiencing lower than expected lung function values, since lung function can recover quite dramatically, and these data suggest that a linear or stepwise decline in lung function over time is not the norm.
We have generated, for the first time to our knowledge, the variogram function for %FEV1 in people with CF over long follow-up periods. This precisely quantifies how %FEV1 measures are correlated over time. Furthermore we have done this for the whole CF population of Denmark. This quantifies the degree to which a baseline %FEV1 measure can be used to predict subsequent %FEV1 measures over long follow-up periods, and is likely to be of interest to clinicians and patients. We demonstrate a long-term correlation between levels of %FEV1 within an individual. This suggests that there is long-term predictive value in a high %FEV1 measure—people with CF with a high %FEV1 at baseline are more likely to have a high %FEV1 up to 15 years later than individuals with a lower baseline %FEV1 (figure 2B). However, the predictive value of a %FEV1 measure drops away rapidly over this period. We can say that on average a %FEV1 reading today explains about 63% of the variability in %FEV1 at 1 year, 40% at 3 years, and about 30% at 5 years.
This corroborates Rosenthal's study,26 which found that baseline %FEV1 explains 66% of the variability in %FEV1 at 1 year, and Mastella et al's study of European registry data in which differences in lung function at enrolment at age 5, categorised as mild, moderate or severe, tracked through the study to age 40.27 Konstan et al also describe how a lower %FEV1 for a given age can be used to characterise the aggressiveness of lung disease.28 Other studies have shown a high %FEV1 to be an independent risk factor for a greater rate of decline of %FEV1 over the next few years.4 ,29 This is not at odds with our findings here; a high %FEV1 can be a risk factor for greater decline in the short term, while still being associated with a relatively higher %FEV1 over the longer term.28
At the population level we show how our approach can be applied to quantify the effect of covariates on changes in lung function. Furthermore, the partitioning of the variability in %FEV1 and the precise description of the correlation structure captured in the model provide important information for sample size calculations in longitudinal clinical studies with %FEV1 as an outcome. Increasingly longitudinal outcomes are being used in randomised control trials, and to undertake an a priori sample size calculation it is essential to have information on the correlation structure. Furthermore, our modelled %FEV1 trace could be used as an outcome in its own right.
As with other studies of patients with CF,30 there is a striking cohort effect evident in this population. The treatment of CF lung disease has been transformed over the period captured in this analysis, from 1969 to the present day. Particularly impressive is the improvement in lung function in the post-1998 cohort by comparison with preceding birth cohorts. Although patients in this group are early in their disease progression, the overall picture suggests that new therapeutic strategies are continuing to provide improvements in respiratory function in CF.
Our approach to modelling changes in %FEV1 can be applied over long follow-up periods. This is in contrast to the widely used random intercept and slope approach that has been applied in studies of CF and COPD over short-term4 ,27 ,31 ,32 and longer-term follow-up periods.10 ,11 ,14 ,33 The development and testing of the new approach is facilitated by the nature of the Danish CF register—to our knowledge there are no other datasets that contain such frequent (monthly) measures of lung function on individuals measured over very long periods (up to 31.5 years). However, the fact that the data are from Denmark does not influence the validity of the methods we have described, since these are essentially context free. Furthermore, this method does not exploit any features of our data that are unique to CF, and is equally applicable to other clinical areas that generate long sequences of repeated measurements. As a next step we recommend that this method be applied to longitudinal data collected in other CF registries, such as the UK, to clarify how robust this approach is in terms of predicting changes in %FEV1 over time, and to better understand how this might inform clinical decision making. Future research could explore the utility of our proposed model in other diseases such as COPD.
A limitation of this study is the likely influence of survivor bias on lung function estimates in the earlier birth cohorts. In the 1948–1978 period, the intercept at age 5 appears significantly lower than in the other cohorts, but there is also a shallower rate of decline of lung function. This is likely to be due to the incomplete capture of patients in earlier cohorts, with censoring due to death leaving only the more stable survivors. This is a common problem in datasets of this type.34 Fitting the model by maximum likelihood automatically corrects for selection bias that depends on a patient's observed lung function measurements prior to death, although not for any additional dependence on unmeasured features of their lung function trajectory.15 ,19
Pancreatic sufficiency had an important effect on the overall rate of decline of lung function (+0.9% per year). In Konstan's study4 pancreatic sufficiency was the most important protective factor in the age group 6–8 years (+1.33% per year). The small number of pancreatic-sufficient individuals in the Danish dataset (n=20, 5%) have a notably different lung function phenotype, maintaining near-normal lung function over the period of follow-up (see plot in online appendix). The onset of Pseudomonas infection was associated with a significant increase in the rate of decline of lung function, by around −0.5% per year, similar to that reported in the study by Konstan, in which Pseudomonas colonisation was associated with an increased rate of decline of FEV1 of −0.31% per year in the 6–8-year-old age group, and −0.22 in the 9–12-year-old age group.4
In conclusion, our modelling approach provides a more realistic estimate of the %FEV1 trajectory in CF, which could be applied in real time to help clinicians interpret the significance of changes in %FEV1. Furthermore, our approach quantifies the predictive value of a baseline %FEV1 measure, over three decades. This method is equally applicable to the longitudinal assessment of %FEV1 in other lung diseases, and can enable more robust comparisons of populations, including groups studied in clinical trials. As people are now living for many decades with these diseases, the development of tools to better understand the natural history of this important outcome will be essential for improved clinical care, as well as being a key research priority.1
Acknowledgments
We thank Professor Peter Oluf Schiøtz for his support in accessing the data for this analysis.
References
Supplementary materials
Supplementary Data
This web only file has been produced by the BMJ Publishing Group from an electronic file supplied by the author(s) and has not been edited for content.
Files in this Data Supplement:
- Download Supplementary Data (PDF) - Manuscript file of format pdf
Footnotes
RLS and PJD are joint senior authors.
-
Funding This work was supported by an MRC Population Health Scientist Fellowship to DTR (G0802448). The funders had no role in study design, data collection and analysis, decision to publish, or preparation of the manuscript.
-
Competing interests None.
-
Ethics approval The study was approved by the Danish Data inspectorate (Datatilsynet). Danish CF registry data were used, analysed anonymously.
-
Provenance and peer review Not commissioned; externally peer reviewed.