Article Text

Statistics from Altmetric.com
‘Nowhere in the Bible does God say the Laws of Nature must be linear’ Enrico Fermi
Indeed, it seems almost necessary that some nonlinearities exist. Most biological processes are under feedback control, for example, which generally implies nonlinearity. The limitation of probabilities to range between zero and one essentially implies S shaped curves. So nonlinear relations seem a fact of life. Of course any continuous curve is well approximated by a straight line within a neighbourhood. Hence, if the effect is not too large, and the range of exposure is likewise limited, linear dose-response relations can be observed even when the underlying phenomenon is not linear.
When epidemiologists primarily dealt with exposure variables such as whether or not one got one's drinking water from the Southwark and Vauxhall water company, such issues hardly mattered. Today, one is more likely to be examining a continuous predictor, such as the role of blood pressure or low-density lipoprotein (LDL) cholesterol in predicting myocardial infarctions (MIs). How should these predictors be handled?
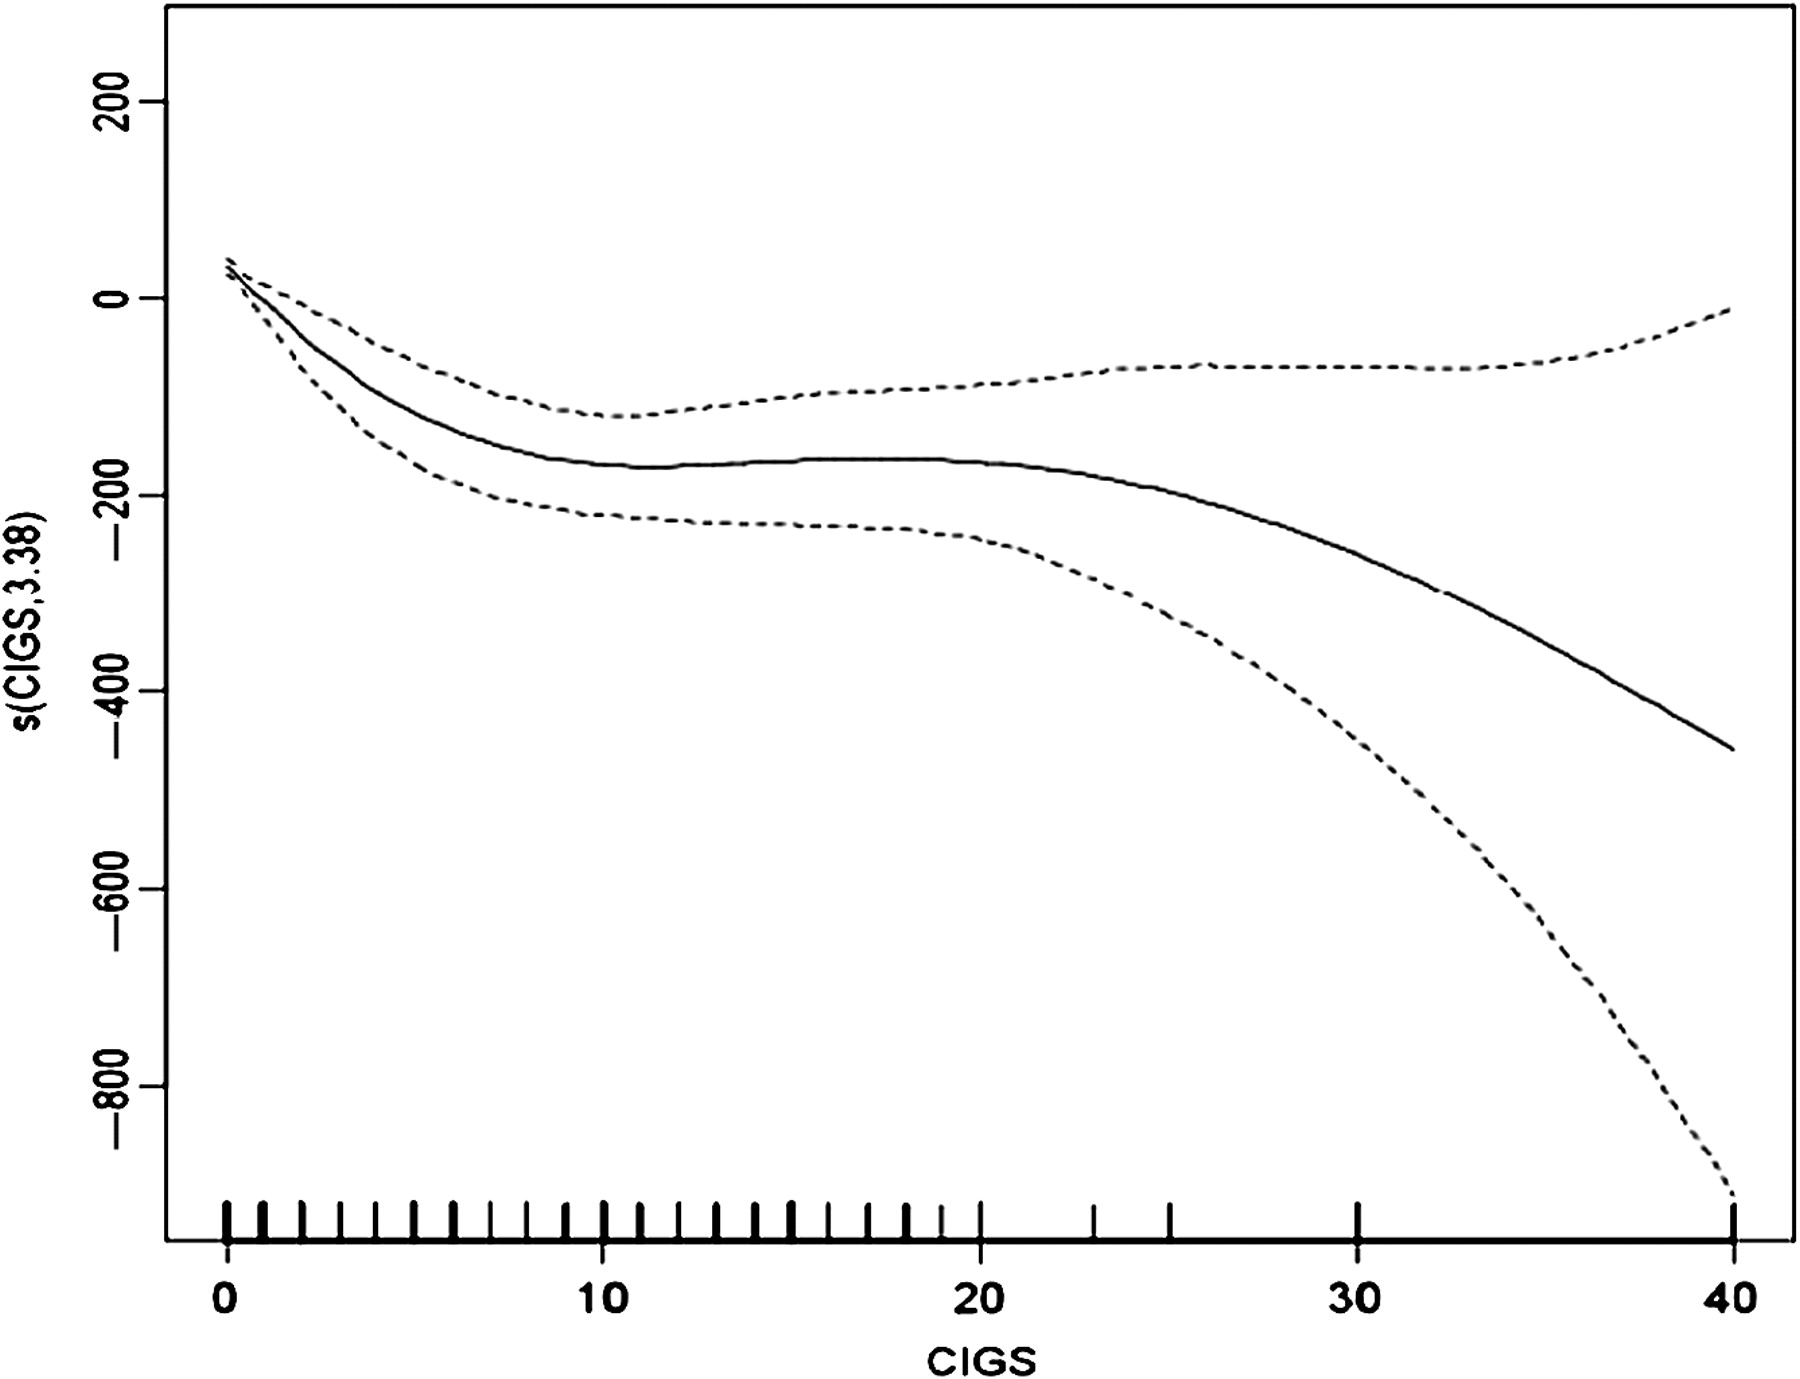
A reasonable first question is does it matter? The answer is clearly yes. Public health interventions must be lined to the shape of the dose-response curve to be effective. For example, figure 1 shows a penalised cubic spline curve I fit to model the difference from expected birth weight in 400 000 live births in Massachusetts versus the number of cigarettes smoked per day by the mother during pregnancy. If the nonlinear association observed here is confirmed, it would imply that telling smoking mothers to cut back to half a pack a day or less would accomplish little. Most of the benefit derives from reductions from 10 or fewer cigarettes per day to zero. Again, the Tobacco industry long argued that the association of secondhand tobacco smoke with MIs was implausible because the slope of the dose-response curve was much higher than for active smoking. Recently, Pope et al1 showed that there was a continuous, nonlinear association across a wide range of exposures to smoke particles starting, with ambient air pollution at the low end, and concluding with heavy smoking at the high end. The association became less steep with increasing dose across all three exposures (ambient particles, secondhand smoke, active smoke).

A penalised cubic spline curve modelling the difference from expected birth weight in 400 000 live births in Massachusetts versus the number of cigarettes smoked per day by the mother during pregnancy
Failure to deal with potential nonlinearities could completely obscure an association as well. The association between today's temperature and today's deaths in urban areas is U shaped, with higher deaths on both very cold and very hot days. The best linear association could well have a slope of zero in some locations.
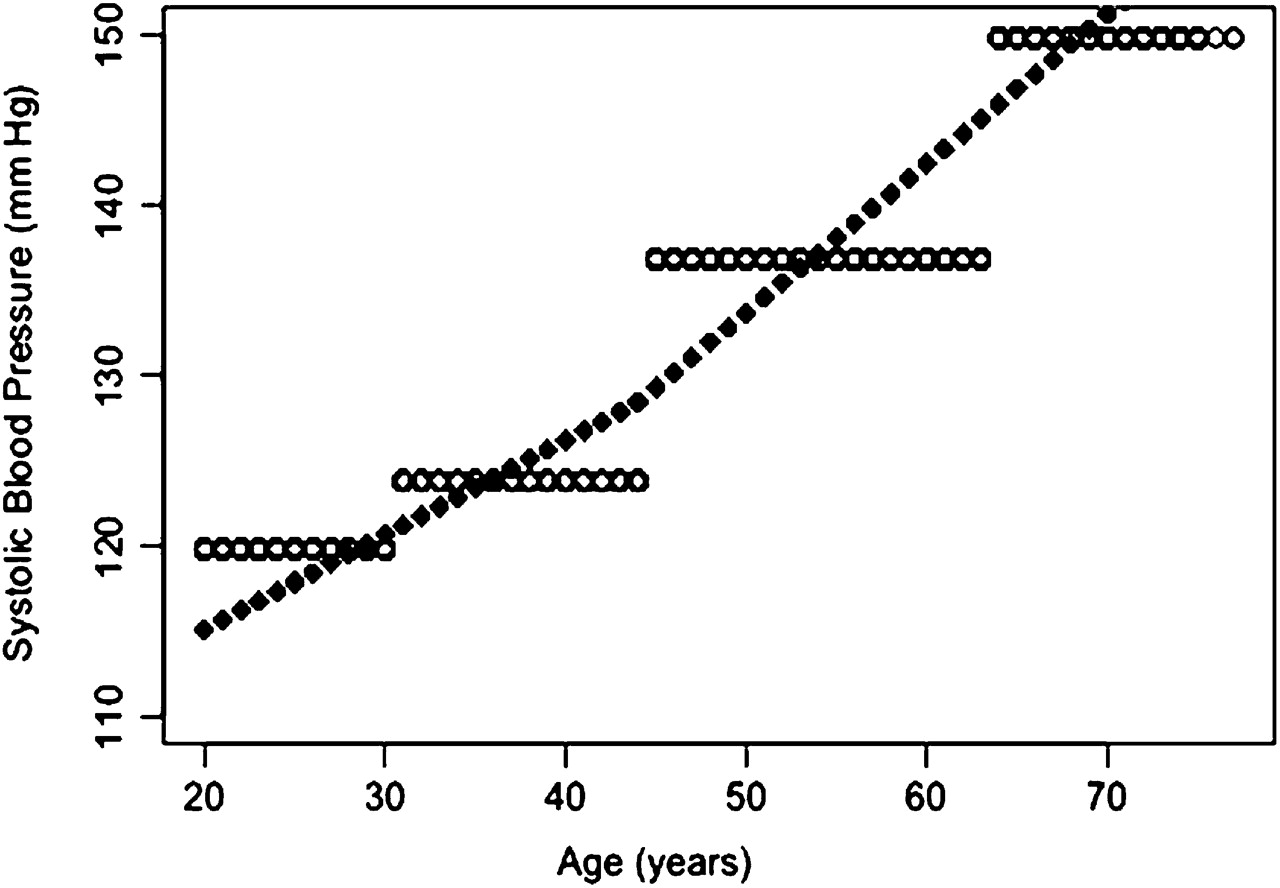
In light of this, one is left with the question of how. One common approach is to divide the range of exposure into quarters or fifths and use dummy variables for each level. Such an approach is capable of capturing nonlinearity, including U shaped curves. It is sometimes argued that it does so without making any assumptions about the shape of the dose-response curve. That is not quite true. It does not make any assumption of the size or even direction of the jump between categories, but it makes a strong assumption about the ‘shape’ of the dose-response curve. It assumes it is a step function, with no association between exposure and response within category, and sudden jumps between categories. And failure to allow for that within category association, between exposure and response, reduces power if there is a true effect. Is it possible to do better? One obvious alternative, endorsed in the paper of Castaldi et al,2 is to use a piecewise linear curve, instead of a piecewise constant curve. Piecewise fit such as these are called splines in statistics. Figure 2 shows an example of these alternatives. In this instance, data has been taken from the US First National Health and Nutrition Examination Survey, a probabilistic sample of the US population. The figure shows two alternative fits of systolic blood pressure to age. The first modelled age as quarters, and shows some signs of nonlinearity, in that the jump between the first and second quarters is smaller than the subsequent jumps. This is a piecewise constant model. The second fit also divides the age range, in this case at the median, and fits a piecewise linear model. This model captures increases in blood pressure within category of age, which is now believed to occur, and uses one fewer degree of freedom to boot. Hence, the approach taken by Castaldi et al2 in this issue is a reasonable approach to potentially nonlinear dose-response. Further, it is reasonable to speculate that a gene-environment interaction may be more important in one part of the nonlinear dose response curve, and again, by missing this, one may obscure important relations. This is indeed what they report.
Two alternative fits of systolic blood pressure to age. Data has been taken from the US First National Health and Nutrition Examination Survey.
Nonlinear dose response curves have an uncomfortable relation with interactions. To see this imagine two scenarios. In both cases, the decline of lung function with age is being examined, and the distribution of ages in this sample differs by sex. If in truth, there is a linear decline in first second forced expired volume (FEV1) with age, which differs between men and women, and the prevalence of women in the sample increases with age, then an analysis of the full sample will seem to reveal a changing slope with increasing age—that is, a nonlinear age association. Here an interaction masquerades as a nonlinearity. Alternatively, if the true association with age is nonlinear, but the same among men and women, an analysis with a linear age term and an interaction by sex will likely find a significant interaction. This has led many to believe nonlinear modelling is a bridge too far. However, the problem in the above example is that the exposure (age) is associated with the effect modifier (sex). In the paper of Castaldi et al2 they have been careful to examine whether smoking was associated with the genotype they studied as a modifier, and report no association. And for gene-environment interactions this is less likely than for other modifiers. Moreover, there are ways to deal with the association. In the above example, for instance, one could test whether the association with age was not linear within sex.
In modern statistical software, testing for nonlinearity, and fitting dose-response models that do not assume constant slopes is straightforward. It is time to stop making a default assumption that continuous predictors have linear associations with health outcomes.
Footnotes
Linked article 146118.
Competing interests None.
Provenance and peer review Commissioned; not externally peer reviewed.
Linked Articles
- Chronic obstructive pulmonary disease