
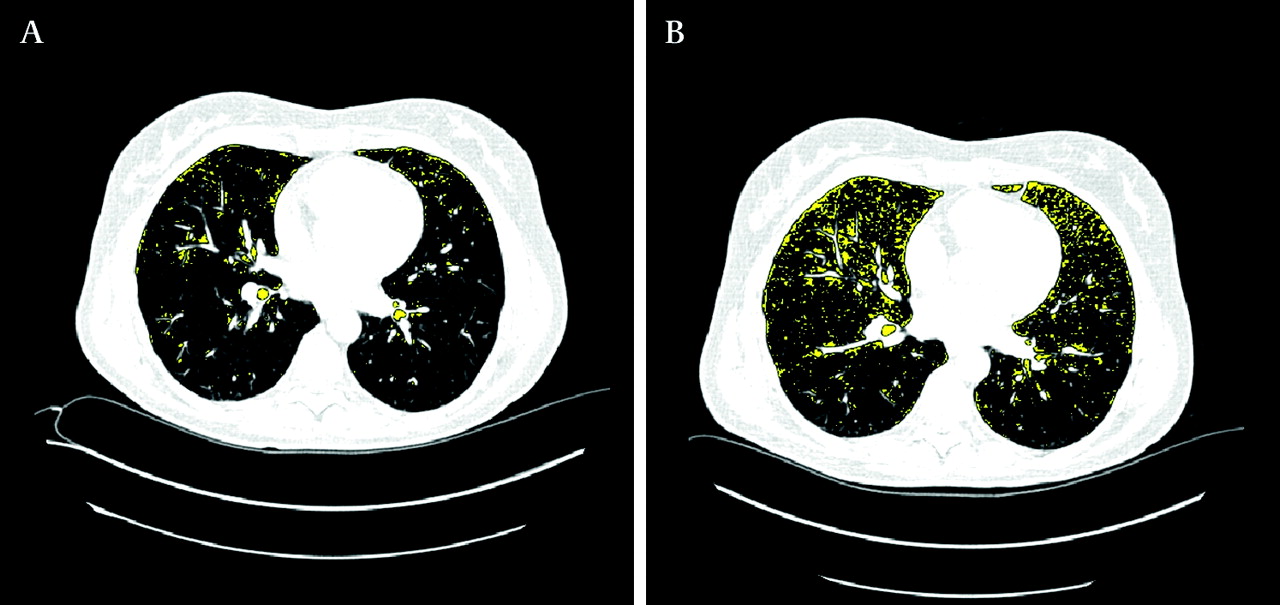
Figure 3
Transverse CT scans from a participant who stopped smoking between baseline (A) visit and 1-year follow-up (B). Slice position and inspiration level were similar in the images (∆CT volume 0.08 l). Yellow areas highlight areas with lung density below −950 HU. Smoking cessation revealed more low attenuation areas at follow-up.
Vol 79 Issue 5
Table of Contents


Share this article
Click the icon of the social media platform on which you would like to share this article.


Email this article to a friend
Respond to this article