Article Text

Abstract
Background One aspect of a multidimensional approach to understanding asthma as a complex dynamic disease is to study how lung function varies with time. Variability measures of lung function have been shown to predict response to β2-agonist treatment. An investigation was conducted to determine whether mean, coefficient of variation (CV) or autocorrelation, a measure of short-term memory, of peak expiratory flow (PEF) could predict loss of asthma control following withdrawal of regular inhaled corticosteroid (ICS) treatment, using data from a previous study.
Methods 87 adult patients with mild to moderate asthma who had been taking ICS at a constant dose for at least 6 months were monitored for 2–4 weeks. ICS was then withdrawn and monitoring continued until loss of control occurred as per predefined criteria. Twice-daily PEF was recorded during monitoring. Associations between loss of control and mean, CV and autocorrelation of morning PEF within 2 weeks pre- and post-ICS withdrawal were assessed using Cox regression analysis. Predictive utility was assessed using receiver operator characteristics.
Results 53 out of 87 patients had sufficient PEF data over the required analysis period. The mean (389 vs 370 l/min, p<0.0001) and CV (4.5% vs 5.6%, p=0.007) but not autocorrelation of PEF changed significantly from prewithdrawal to postwithdrawal in subjects who subsequently lost control, and were unaltered in those who did not. These changes were related to time to loss of control. CV was the most consistent predictor, with similar sensitivity and sensitivity to exhaled nitric oxide.
Conclusion A simple, easy to obtain variability measure of daily lung function such as the CV may predict loss of asthma control within the first 2 weeks of ICS withdrawal.
- Asthma
- coefficient of variation
- lung function tests
- peak expiratory flow rate
- respiratory measurement
Statistics from Altmetric.com
Introduction
Recent American Thoracic Society (ATS)/European Respiratory Society (ERS) statements have highlighted the need to consider the future risk of adverse outcomes when assessing a patient with asthma.1 2 One of the specific questions faced by clinicians is whether the reduction of inhaled corticosteroid (ICS) treatment would result in future loss of asthma control. This can be modelled in clinical studies and is also relevant in mimicking situations where patients lose or forget to take their anti-inflammatory medication. However, to date, lung function per se has not been shown to be predictive of clinical outcomes in patients with asthma when their ICS treatment is withdrawn. Significant changes in lung function as well as in markers of inflammation, inhaler use or airway hyper-responsiveness may or may not occur during withdrawal or down-titration of corticosteroid treatment, and hence the predictive value of measuring these end points is variable.3–6 This also appears to be the case in similar studies involving chronic obstructive pulmonary disease7 and cystic fibrosis.8
A multidimensional approach to evaluating asthma as a complex dynamic disease9 is increasingly shown to be necessary.10 11 An integral aspect of this approach is studying how conventional markers such as lung function vary with time,12 instead of just looking at mean values obtained over the period of observation. Experienced clinicians intuitively know that long-term observation of the patient including past history helps to assess how the patient will react to changes in treatment.10 13 Many past studies have examined lung function variability,14 particularly peak expiratory flow (PEF), and variously related it to clinical parameters such as symptoms and airway hyper-responsiveness.15–19 More recently, using more complex measures of variability studied over longer periods, we have shown that correlation or memory patterns in the daily fluctuations in PEF which take into account past history, can predict response to long-term β2-agonist treatment.20 21 To the best of our knowledge, PEF variability has not been applied to predicting response to ICS treatment withdrawal.
Against this background, we hypothesised that detailed variability analysis of lung function would be able to predict response to withdrawal of corticosteroid treatment. To test this hypothesis, we determined whether the mean PEF, coefficient of variation (CV) of PEF, and autocorrelation, a measure of short-term memory, predicted loss of asthma control (LOC) after withdrawal of regular ICS treatment, using data from a previous study.22
Methods
Original dataset
Details of a subset of the original study (n=78) have been previously published.22 Briefly, 87 adult patients with mild to moderate asthma, defined as per ATS guidelines at the time,23 who had been taking constant dose ICS for at least 6 months were enrolled. Since withdrawal of ICS treatment was involved in the trial, for ethical reasons exclusion criteria were a history of acute asthma requiring hospitalisation, asthma characterised by sudden attacks or use of oral prednisone in the previous 3 months. The study was approved by the Otago Ethics Committee.
Patients were monitored for 2–4 weeks of run-in, with their ICS dose unchanged. Diary data were used to construct individual LOC criteria (box 1). ICS was then withdrawn and monitoring continued until either LOC or 6 weeks, whichever came first.
Box 1 Criteria defining loss of control
Loss of control was defined as the occurrence of any of the following:
Average morning peak flow <90% of baseline over the last week
2 consecutive morning or evening peak flows <80% of baseline in last week
Mean daily bronchodilator use of 4 puffs more than during the run-in over the last week
Night wakening with asthma symptoms on 2 nights per week more than during the run-in
Presence of distressing or intolerable asthma symptoms
Monitoring consisted of twice-daily PEF, bronchodilator use and symptoms scores recorded at home by the patient. Spirometry and exhaled nitric oxide (FENO) were assessed at weekly clinic visits. Airway hyper-responsiveness and sputum induction were performed at baseline and again at LOC or at 6 weeks. Further details regarding the study methods are available in the original publication. Three patients subsequently withdrew from the study, while one had a large amount of missing PEF data and could not be analysed. Following ICS withdrawal, 64 patients lost control of their asthma (LOC group), while 19 patients did not lose control within the 6 weeks of observation (no LOC group). A summary of the characteristics of the study population is provided in table 1.
Demographic and baseline data for the study population, stratified by those who did and did not experience loss of control (LOC) following steroid withdrawal
Analysis of PEF variability
We examined the mean, the CV and the autocorrelation of PEF in the 14 days prewithdrawal and 14 days postwithdrawal of ICS treatment. For the postwithdrawal period, only patients having at least 14 days of PEF data after steroid withdrawal were included (n=53). This cut-off point was chosen to ensure that the number of data points was adequate for autocorrelation analysis. Due to the known diurnal variation of peak flow, only morning PEF (AM PEF) was included in the analysis, as a more accurate reflection of prebronchodilator lung function.
The autocorrelation is often used in signal processing to determine the average relationship between two arbitrary data points separated by a specified time lag within time series. Since the length of the available time series was limited in this study, we determined the autocorrelation only for time lag 1, which is calculated as the correlation coefficient between all PEF values and their corresponding previous PEF values over the observation period. The autocorrelation can be thought of as a measure of memory because it quantifies the extent to which present events are dependent on the past. However, any trends in the PEF data over time can introduce spurious autocorrelation results, and therefore the possible effect of trends were separately investigated by subtracting the best linear fit from the PEF data prior to analysis.
We examined the magnitude and sign of the autocorrelation separately. The magnitude or absolute value of the autocorrelation provides the extent per se to which each day's PEF value was dependent on the previous day's value, and is a measure of the proportion of the variability in PEF values which is explained by the previous day's values. The sign takes into account the direction of the dependence on past events—that is, whether a PEF value tends to increase or decrease compared with the corresponding previous value averaged over the observation period. The sign was assessed as a binary variable, with 1 corresponding to a positive or zero autocorrelation, and 0 corresponding to a negative autocorrelation.
Statistical analysis
Changes between the 14 day prewithdrawal and postwithdrawal periods in the parameters of interest—that is, mean, CV and autocorrelation of PEF, were first examined. Significant differences were determined using paired t tests (on ranks whenever data were not normally distributed; eg, with CV). This was done separately for the LOC and no LOC groups.
Associations between time to LOC and the parameters of interest were then determined using Cox regression analyses. Standard adjustments in the regression analysis were: age, height, sex and ICS dose. The effects of the parameters of interest were first examined in separate regression models, and then together in a combined model. The proportional hazards assumption necessary for Cox regression was confirmed by examining plots of scaled Schoenfeld residuals versus time and testing for a non-zero slope, though statistical power to detect a violation of the assumption was low.24 Associations for the prewithdrawal and postwithdrawal periods, as well as the difference between the two (postwithdrawal minus prewithdrawal), were identified.
The utility of the mean, CV and autocorrelation of PEF in predicting subsequent loss of control was assessed using receiver operator characteristic (ROC) analyses.
All statistical analyses were performed using Intercooled Stata version 9 (Stata Corporation, College Station, Texas, USA).
Results
Changes between prewithdrawal and postwithdrawal periods
Following ICS withdrawal, 53 out of 87 patients had postwithdrawal PEF data for at least 14 days. Figure 1 shows the changes in mean, CV and magnitude of autocorrelation of morning PEF between 2 weeks prewithdrawal and postwithdrawal, for the no LOC (n=19) and the LOC (n=34) groups. In the LOC group, the mean (389 vs 370 l/min, p<0.0001) and CV (4.5% vs 5.6%, p=0.007) of the PEF changed significantly from prewithdrawal to postwithdrawal. The magnitude of the autocorrelation showed no differences between prewithdrawal and postwithdrawal (0.25 vs 0.28, p=0.534), or when the underlying trends were taken into account (0.26 vs 0.20, p=0.133) or when the sign of the autocorrelation was examined (not shown). No significant changes in values between prewithdrawal and postwithdrawal were seen in any of the parameters in the no LOC group.

Changes in (a) mean, (b) coefficient of variation (CV), (c) magnitude of correlation and (d) magnitude of detrended autocorrelation of morning peak expiratory flow (AM PEF) before and after steroid withdrawal. Significant changes occurred only in mean and CV in those who later lost control of their asthma (p<0.0001 and p=0.007 respectively). LOC, loss of control.
Associations with time to LOC
The HRs for the Cox regression analyses for the parameters of interest are shown in table 2, along with the corresponding 95% CI and p values. The HR can be considered as an estimate of the relative risk of LOC at any given time per unit change in the relevant parameter. To ease interpretation of the results in table 2, consider the difference between the prewithdrawal and postwithdrawal periods: for every 1 l/min decrease in mean morning PEF occurring within the first 2 weeks of treatment withdrawal, the patient would have a 1/0.955=1.05 times greater risk of losing control of their asthma at any given time thereafter. Similarly, for every 10 l/min decrease in PEF, the patient would have a 1/exp(10×ln(0.955))=1.58 times greater risk of losing control of their asthma at any given time thereafter. In comparison, for every 1% increase in the CV, the patient would have a 1.32 times greater risk of losing control of their asthma.
Association of parameters derived from peak expiratory flow with outcome (time to loss of control in days after steroid withdrawal)
Table 2 shows that in general, a decrease in mean PEF and an increase in CV were associated with a greater risk for LOC, while neither the magnitude nor sign of the autocorrelation showed any significant associations. The latter remained the case when underlying trends were taken into account (not shown). The CV showed the most consistent relationship to LOC during the different periods, even though its associated p value increased for the prewithdrawal period when combined with mean PEF in the regression model. Figure 2 illustrates this relationship between LOC and the postwithdrawal minus prewithdrawal difference in CV: the larger the increase in CV within 2 weeks of ICS withdrawal, the sooner the patient will lose control of his/her asthma. When considering the difference between postwithdrawal and prewithdrawal, both mean PEF and CV remained significant when included in the same combined model, indicating independent relationships. As the sign of the autocorrelation was clearly not significant in general, it was not included in the combined model, or in subsequent analysis.

Relationship between time to loss of control (LOC) and the change (poststeroid minus presteroid withdrawal) in coefficient of variation in morning peak expiratory flow (CV AM PEF) within 2 weeks of inhaled corticosteroid (ICS) withdrawal. The larger the increase in CV within 2 weeks of ICS withdrawal, the sooner the patient will lose control of his/her asthma. In the simple regression line shown, the correlation coefficient was 0.523, p<0.001. For the Cox regression results, please refer to the text.
Predictive value for LOC
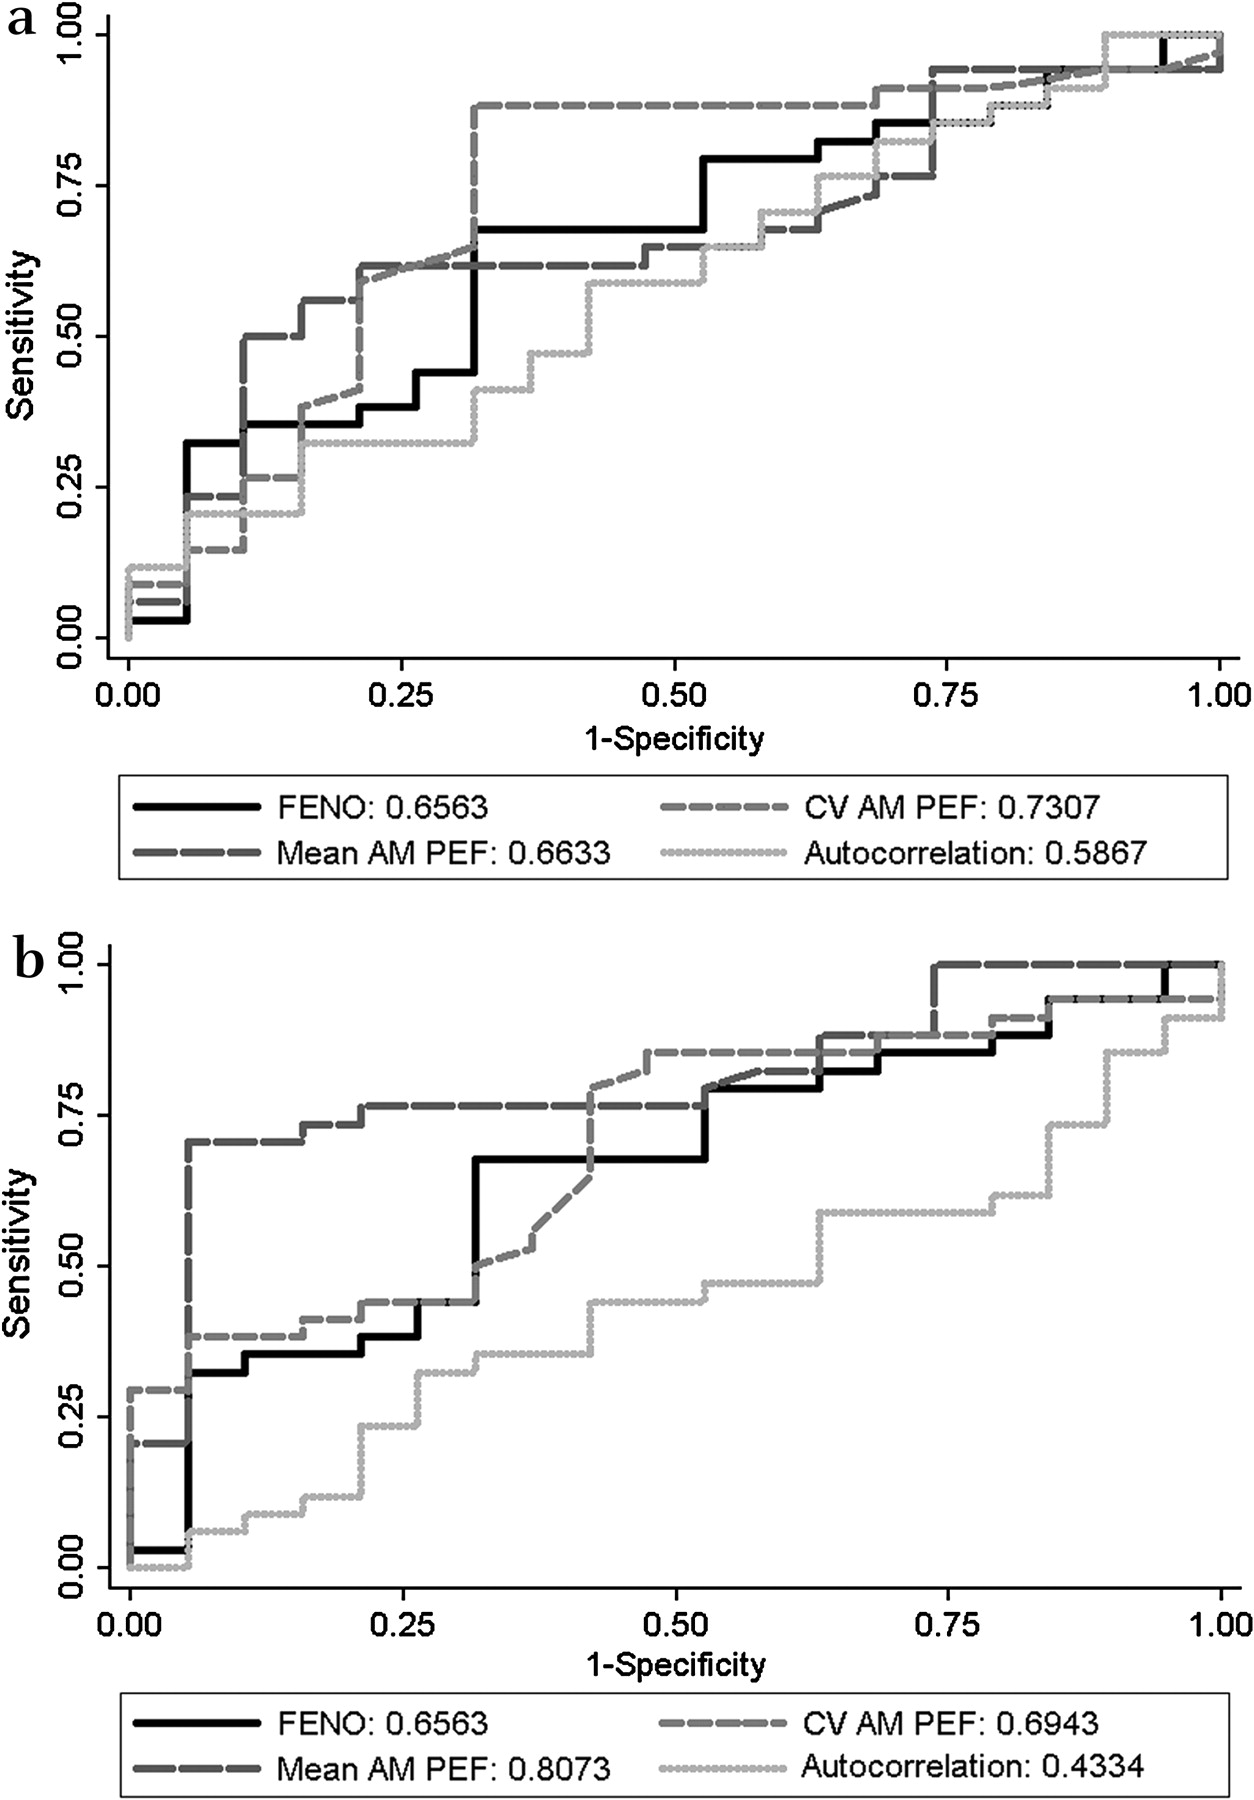
The areas under the ROC curves (AUCs) for mean morning PEF, CV and magnitude of the autocorrelation were calculated, and compared with the AUC for ΔFENO (the change between baseline and 1 week prior to LOC in expired NO), one of the predictors of interest in the original study. For the prewithdrawal period, none of the parameters of interest showed greater AUCs than FENO. From the postwithdrawal period, CV yielded the highest AUC (0.7307), while for the postwithdrawal minus prewithdrawal period, mean PEF yielded the highest AUC (0.8073) (figure 3). However, none of these AUCs was significantly different from those for FENO.
Receiver operating characteristics (ROC) for mean, coefficient of variation (CV) and magnitude of autocorrelation of morning peak expiratory flow (AM PEF) for (a) the postwithdrawal period and (b) the difference between the postwithdrawal and prewithdrawal period in predicting subsequent loss of control. The solid black line represents the difference in exhaled nitric oxide (FENO) between the first and penultimate visit prior to loss of control, for comparison. The numbers given in the key are the areas under the ROC curves. There were no significant differences in the areas under the curves between any of the parameters and FENO.
Effect of a reduced observation period
We also repeated the analysis by examining 7 days postwithdrawal and prewithdrawal instead of 14 days, and found that only the mean PEF values differed significantly between the postwithdrawal and prewithdrawal periods in the LOC group. The Cox regression analyses showed that there were no significant relationships with time to LOC in any of the parameters.
Discussion
In this retrospective analysis of a previous study, we found that following withdrawal of ICS treatment, mean and CV of morning PEF were significantly altered within 2 weeks in patients who subsequently lost control of their asthma, but were unchanged in those who did not. Neither magnitude nor sign of autocorrelation of peak flow was significantly altered, similarly when taking into account any downward trends in peak flow following withdrawal of treatment.
While mean PEF was the most statistically significant predictor of LOC (provided the difference between pretreatment and post-treatment withdrawal periods was considered), the CV was predictive regardless of whether we considered the prewithdrawal period, the postwithdrawal period or the difference between the two.
Significance and comparison with other studies
Peak flow variability has been used frequently in the assessment of asthma control, using a variety of indices,15 16 18 25 and has been shown to relate to airway hyper-responsiveness,17 symptoms19 and air pollution exposure.25–27 To the best of our knowledge, this is the first instance where it has been applied in predicting response to withdrawal of corticosteroid treatment. We can deduce from our results that it is possible to predict risk of LOC by monitoring variability of lung function for at least 2 weeks, using a simple measure of variability such as the CV. This is very clinically relevant given the relatively long mean time interval between discontinuing ICS and the advent of breakthrough symptoms: in this study it was 17 days. As mentioned, the predictive value of peak flow measurements has not been shown for other, more conventional markers such as airway hyper-responsiveness, inflammation or lung function.3–6 Our results may be applicable to down-titration of treatment as well, and thus have important implications for clinical monitoring and identification of patients who would be suitable for being weaned off long-term corticosteroid treatment.
More sophisticated techniques have been used to assess lung function variability in the past,20 21 which are also related to the autocorrelation.28 However, it seems that in the short term, a simple measure such as the CV is more sensitive, probably because insufficient data points were available to describe adequately the longer term dynamics of lung function fluctuations in time (autocorrelations). This may place limitations on the time frame over which interpretations can be made; however, from our study, the CV seems to provide a simple, practical and intuitive clinical marker at least for the 6 week interval over which the patients were monitored. One could update the CV day by day in order to obtain an improved estimation of risk, which can be thought of as a Bayesian approach to risk modelling.
It is important to note that the information obtained from the CV is additional to and independent of the mean PEF. This conclusion is based on the persistence of significant associations with subsequent LOC when both were included in a combined regression model. This is consistent with our previous observations that longer term variability of PEF and mean PEF provide independent information, and coupled together they have meaningful predictive value for treatment outcomes.21
Peak flow has often been criticised as an imprecise measurement of lung function, but peak flow monitoring is one of the simplest, cost-effective and well-tolerated methods of home monitoring,25 with the added benefit that it may enhance patient compliance with treatment.29 It has been proposed that new statistical methods may play an important role in extending the information obtained from peak flow.30 We have shown that the CV is a simple measure of variability of multiple measures of lung function over a short time which may fulfil this role. The current guidelines published by the Global Initiative for Asthma recommend that lung function variability over time should be obtained.31 The methods described in this study will help us improve this approach, in a way which embraces the multidimensional thinking which is emerging for asthma monitoring and management.10 11
The sensitivity and specificity of peak flow CV for predicting LOC was not significantly better than FENO. However, it has a number of advantages over FENO in this context. First, CV was predictive of LOC even from the period prior to ICS withdrawal, not just within the first 2 weeks following withdrawal. In contrast, the predictive value of FENO was only available at the penultimate visit prior to LOC (which had also been shown not to be different to the predictive value of baseline FENO22). From a practical point of view, home monitoring of PEF and the calculation of CV offers a comparatively simpler, patient-initiated, more cost-effective measure to assess risk of future LOC, and does not require frequent clinic visits.
Potential limitations
The definition for LOC used our study includes PEF as a criterion, and thus the association between mean PEF and LOC may at first seem circular. However, we have examined PEF only within the 2 weeks prior to and following ICS withdrawal, and we excluded patients who lost control in <2 weeks during the postwithdrawal period (since they did not have postwithdrawal PEF data for at least 2 weeks). Thus, it is not necessarily the case that a drop in PEF resulting in LOC would be associated with PEF variability within the first 2 weeks. However, this means that we are unable to make any statements regarding LOC occurring within the first 2 weeks of treatment withdrawal.
We also found that the predictive ability of mean and CV for PEF disappeared when only measured over 7 days. Thus, a minimum number of points is necessary to characterise variability of PEF. This is perhaps intuitive but it limits the practicability of the method over very short time periods. Nevertheless, 2 weeks represent only a short fraction of the usual duration for asthma monitoring during clinical evaluations.
Due to limited numbers, we did not take into account an effect of smoking in our analyses. However, the proportion of ex-smokers to non-smokers was small (12:66 in the original study), and all the ex-smokers had not smoked for at least a year, with a smoking history of <5 pack-years.
Conclusions
The CV of PEF measured over a period of ≥2 weeks can be used to predict the response to withdrawal of ICS treatment, and potentially to determine whether patients would tolerate weaning from ICS treatment. Simple hitherto unused measures of PEF variability based on daily home monitoring can provide prognostic information regarding a patient's future risk of symptomatic asthma.
Acknowledgments
The authors would like to acknowledge the help of Ben Spycher for providing statistical advice for this study. They would also like to thank anonymous reviewers for suggestions towards improving the manuscript.
References
Footnotes
Funding Thoracic Society of Australia and New Zealand/Allen Hanburys Respiratory Research Fellowship to CT.
Competing interests None.
Ethics approval This study was conducted with the approval of the University of Otago Ethics Committee.
Provenance and peer review Not commissioned; externally peer reviewed.