Article Text

Abstract
Background: Although clinical N1 (cN1) non-small cell lung cancer (NSCLC) is considered to be locoregional, the postoperative outcome is disappointing, with a 5 year survival of less than 50%. One possible reason may be that cN1disease diagnosed by current standard imaging modalities often contains unexpected N2 disease. This study was conducted to evaluate the surgical and pathological results of patients with cN1 NSCLC.
Methods: Among 1782 patients with NSCLC who underwent intended curative resection from 1993 to 2003, 143 patients were identified as having cN1 disease and were enrolled in this study. The clinicopathological records and CT films of each patient were retrospectively reviewed to identify predictors for pN2–3 disease.
Results: The pathological nodal status was pN0 in 23% (n = 33), pN1 in 47% (n = 67) and pN2–3 in 30% (n = 43) of patients. Patients with pN2–3 showed a significantly worse 5 year survival rate of 38% compared with patients with pN0 (68%) and pN1 (60%) (p = 0.017 and 0.007, respectively). Multivariate analysis showed that adenocarcinoma histology was a significant predictor for pN2–3 disease (OR 3.312, 95% CI 1.439 to 7.784; p = 0.005). The presence of N1 node separate from the main tumour on CT scans tended to predict pN2–3 disease although this did not reach statistical significance (OR 2.103, 95% CI 0.955 to 4.693; p = 0.066). Pathological N2–3 disease was found in 53% of patients with adenocarcinoma with a separate N1 pattern and in only 12% of patients with non-adenocarcinoma with a continuous N1 pattern.
Conclusions: The diagnosis of N1 status by contrast enhanced CT scans is unsatisfactory with a high rate of unexpected pN2 disease. To avoid infertile lung resection, patients with CT diagnosed N1 adenocarcinoma, especially with a separate N1 pattern on CT, should be considered for additional invasive node biopsy modalities, including mediastinoscopy.
Statistics from Altmetric.com
Clinical N1 (cN1) disease of non-small cell lung cancer (NSCLC) represents the subset suggestive of ipsilateral hilar and/or intrapulmonary lymph node metastasis.1 Although cN1 disease is considered to be locoregional, surgical resection often fails to cure patients with cN1. Mountain reported that the postoperative 5 year survival rates of patients with clinical T1N1, T2N1 and T3N1 were 34%, 24% and 9%, respectively.2 One possible explanation for the disappointing outcome is that patients with cN1 often have clinically occult mediastinal lymph node metastases (N2), which is a sign of systemic disease.
Contrast enhanced CT scan is the most widely available and most commonly used non-invasive method to evaluate lymph node status for patients with NSCLC, in spite of the introduction of positron emission tomography (PET) scans.3 Many studies have reported the diagnostic accuracy of CT scans for N2 disease. A meta-analysis of 20 studies involving 3438 patients demonstrated that CT had 57% sensitivity and 82% specificity for mediastinal node staging.4 We previously reported that 17% of patients with clinical N0 NSCLC had pN2 disease.5 Although it is very likely that the cN1 patient cohort includes more clinically undetectable N2 patients, few reports have evaluated pathological stage distribution of patients with CT diagnosed clinical N1 NSCLC.6
To reveal the problems in the current diagnostic standards of cN1 NSCLC, we retrospectively evaluated the surgical and pathological results of this cohort. Furthermore, we attempted to identify clinical and radiological characteristics of patients with cN1 to predict mediastinal lymph node metastases in order to help select patients who would benefit from additional lymph node staging modalities.
METHODS
Patient population
We reviewed the medical records of 1782 consecutive patients with NSCLC who underwent intended curative surgical resection at the National Cancer Centre Hospital East, Chiba, Japan, from January 1993 to June 2003. Among them, a total of 159 patients with cN1 disease were identified. Data collection and analyses were approved and the need for obtaining informed consent from each patient was waived by the institutional review board in March 2005. We excluded 16 patients from this study for the following reasons: eight patients underwent preoperative induction therapy, three patients underwent limited resection without systemic hilar and mediastinal lymph node dissection, three patients underwent mediastinoscopy to rule out cN2 disease and two patients had synchronous metastatic disease (M1). Subsequently, 143 (8%) patients were enrolled in this retrospective study. The clinical characteristics of these patients are shown in table 1. There were 114 men and 29 women with a median age of 64 years (range 25–83). Eighty-five (59%) patients complained of at least one symptom on their first visit to our outpatient clinic. The most prevalent symptom was cough in 42 patients, followed by haemoptysis in 31 patients. Before surgery, all patients underwent a thorough staging with chest roentogenography, chest and upper abdominal contrast enhanced CT, bone scintigraphy and MRI or CT scan of the whole brain. The most common T factor was T2 (61%), reflecting the mean tumour size on CT scans (4.6 (SD 1.9) cm). Squamous cell carcinoma was the most frequent histology (48%, 69/143). Bronchoscopy was done in selected patients to evaluate cancer extension in the bronchial tree. We did not routinely use PET scan for preoperative staging. We did not perform mediastinoscopy or thoracoscopy for patients with cN1. All patients underwent anatomical lung resection (at least lobectomy) with systemic hilar and mediastinal lymph node dissection, as described previously.7 The number of dissected lymph nodes ranged from 4 to 70, with a mean of 30. Resected specimens were examined histologically, and their histological type was determined according to the World Health Organization International Histological Classification of Tumours.8 The pathological stages were determined based on the TNM classification of the International Union Against Cancer.1 After surgery, patients were scheduled to visit our outpatient clinic at 3–6 month intervals for 5 years. The median follow-up period was 5.1 years (range 7 months to 11 years).
Preoperative evaluation and analysis of N1 status
Dynamic incremental scanning was performed on X-Vigour or Aquilion CT equipment (Toshiba; Tokyo, Japan) after a bolus injection of 100 ml of contrast material using an automatic injector, and 10 mm thick contiguous CT sections were reconstructed. All CT films were interpreted by at least two experienced thoracic radiologists who were blinded to the other clinical information. Clinical N1 disease status was diagnosed when one or more lymph nodes in the N1 region were larger than 1.0 cm in the shortest axis, in accordance with the general consensus of the upper size limit for normal mediastinal lymph nodes. The N1 node stations were designated according to the lymph node map by Naruke and colleagues7: No 10 hilar along the main bronchus, No 11 interlobar, No 12 lobar, No 13 segmental bronchial and No 14 intrapulmonary lymph nodes. As our series was obtained over a 10 year period and not evaluated with identical CT equipments and radiologists, we retrospectively reviewed preoperative chest CT scans and confirmed that all 143 enrolled patients truly satisfied cN1 diagnosis criteria. During the review process, additional radiological findings were collected for the purposes of the current study. They included the presence or absence of atelectasis and obstruction pneumonia and cN1 patterns. We defined two cN1 patterns according to the relationship between the main tumour and N1 node depicted on CT. We defined “continuous N1” as an N1 node directly involving the main tumour and “separate N1” as an N1 node separate from the main tumour (fig 1). N1 node connected to the main tumour only by pre-existing normal bronchovascular structure was classified as separate N1.

Statistical analysis
We analysed categorical variables using Pearson’s χ2 test. Survival rates were estimated using the Kaplan–Meier method, and survival curves were compared by log rank tests. The length of survival was defined as the interval between the day of surgical resection and the date of either death or the last follow-up. An observation was censored at the last follow-up when the patient was alive or lost to follow-up. Univariate logistic regression analysis was performed to identify factors predicting pN2–3 disease among the cN1 population. Multivariate logistic regression analysis was carried out by using significant predictors in univariate analysis to clarify which factor was associated with a higher risk of pN2–3 disease. Cox proportional hazards regression analysis was used to determine the relationship between survival and pathological nodal status. Differences were considered to be statistically significant when p<0.05. All statistical analyses were performed using software packages (JMP, release 5.0; SAS Institute Inc, Cary, North Carolina, USA and GraphPad Prism, release 4.03; GraphPad Software Inc, San Diego, California, USA).
RESULTS
Diagnostic reliability of cN1 status by CT scans
The pathological lymph node status of the 143 patients with cN1 was N0 in 33 (23%), N1 in 67 (47%), N2 in 40 (28%) and N3 in three (2%) patients. In 30% of patients with cN1 (n = 43), lymph node status was upstaged to pN2–3. Among 40 patients with cN1/pN2, six (15%) had metastases in multiple N2 stations. The locations of N1 lymph nodes depicted on CT scans are shown in table 2. The interlobar (No 11) node was detected most frequently (81%), followed by the hilar (No 10) node in 24%. The lobar (No 12), segmental bronchial (No 13) and intrapulmonary (No 14) nodes were depicted in only 15 (10%) patients.
Predictors for pN2–3 disease among patients with cN1
Table 3 shows the relationship between preoperative clinicoradiological characteristics and proportion of pN2–3 disease among patients with cN1 NSCLC. In univariate logistic regression analysis, we found statistically significant associations between the probability of pN2–3 disease and female gender (odds ratio (OR) 2.74; 95% confidence interval (CI) 1.18 to 6.35; p = 0.019), adenocarcinoma histology (OR 5.27; 95% CI 2.28 to 12.17; p<0.0001) and separate N1 pattern on CT scans (OR 2.75; 95% CI 1.32 to 5.76; p = 0.0072). Multivariate logistic regression analysis indicated that adenocarcinoma histology (OR 3.312; 95% CI 1.439 to 7.784; p = 0.005) was the highest risk factors (triple risk compared with non-adenocarcinoma) for pN2–3 disease. Although this did not reach statistical significance, separate N1 pattern on CT scans was also associated with pN2–3 disease (OR 2.103; 95% CI 0.955 to 4.693; p = 0.066) (table 4). Pathological N2–3 disease was found in 50% of patients with adenocarcinoma and 42% of patients with a separate N1 pattern on CT. In 34 patients with adenocarcinoma with a separate N1 pattern, 18 (53%) had pN2–3 status. In contrast, in 58 patients with non-adenocarcinoma with a continuous N1 pattern, only seven (12%) had pN2–3 disease (table 5).
Treatment for patients with cN1
As shown in table 1, it is remarkable that about half of the enrolled patients with cN1 underwent extensive lung resection greater than lobectomy; pneumonectomy was performed in 42 (29%) patients and bilobectomy in 35 (24%). Bronchoplastic procedures were performed in 16 (11%) patients. Pneumonectomy was done mainly for patients with squamous cell carcinoma (squamous cell carcinoma in 26 (62%), adenocarcinoma in 12 (29%) and adenosquamous carcinoma in four (9%)). Radiotherapy was performed postoperatively in seven patients: six for their positive surgical margins and one with pT1N1M0 moderately differentiated squamous cell carcinoma for adjuvant purposes. Platinum based adjuvant chemotherapy was given to only two patients with cN1/pN2 because it was not the standard of care in our practice until January 2004 when the International Adjuvant Lung Cancer Trial results were published.9
Prognosis of patients with cN1
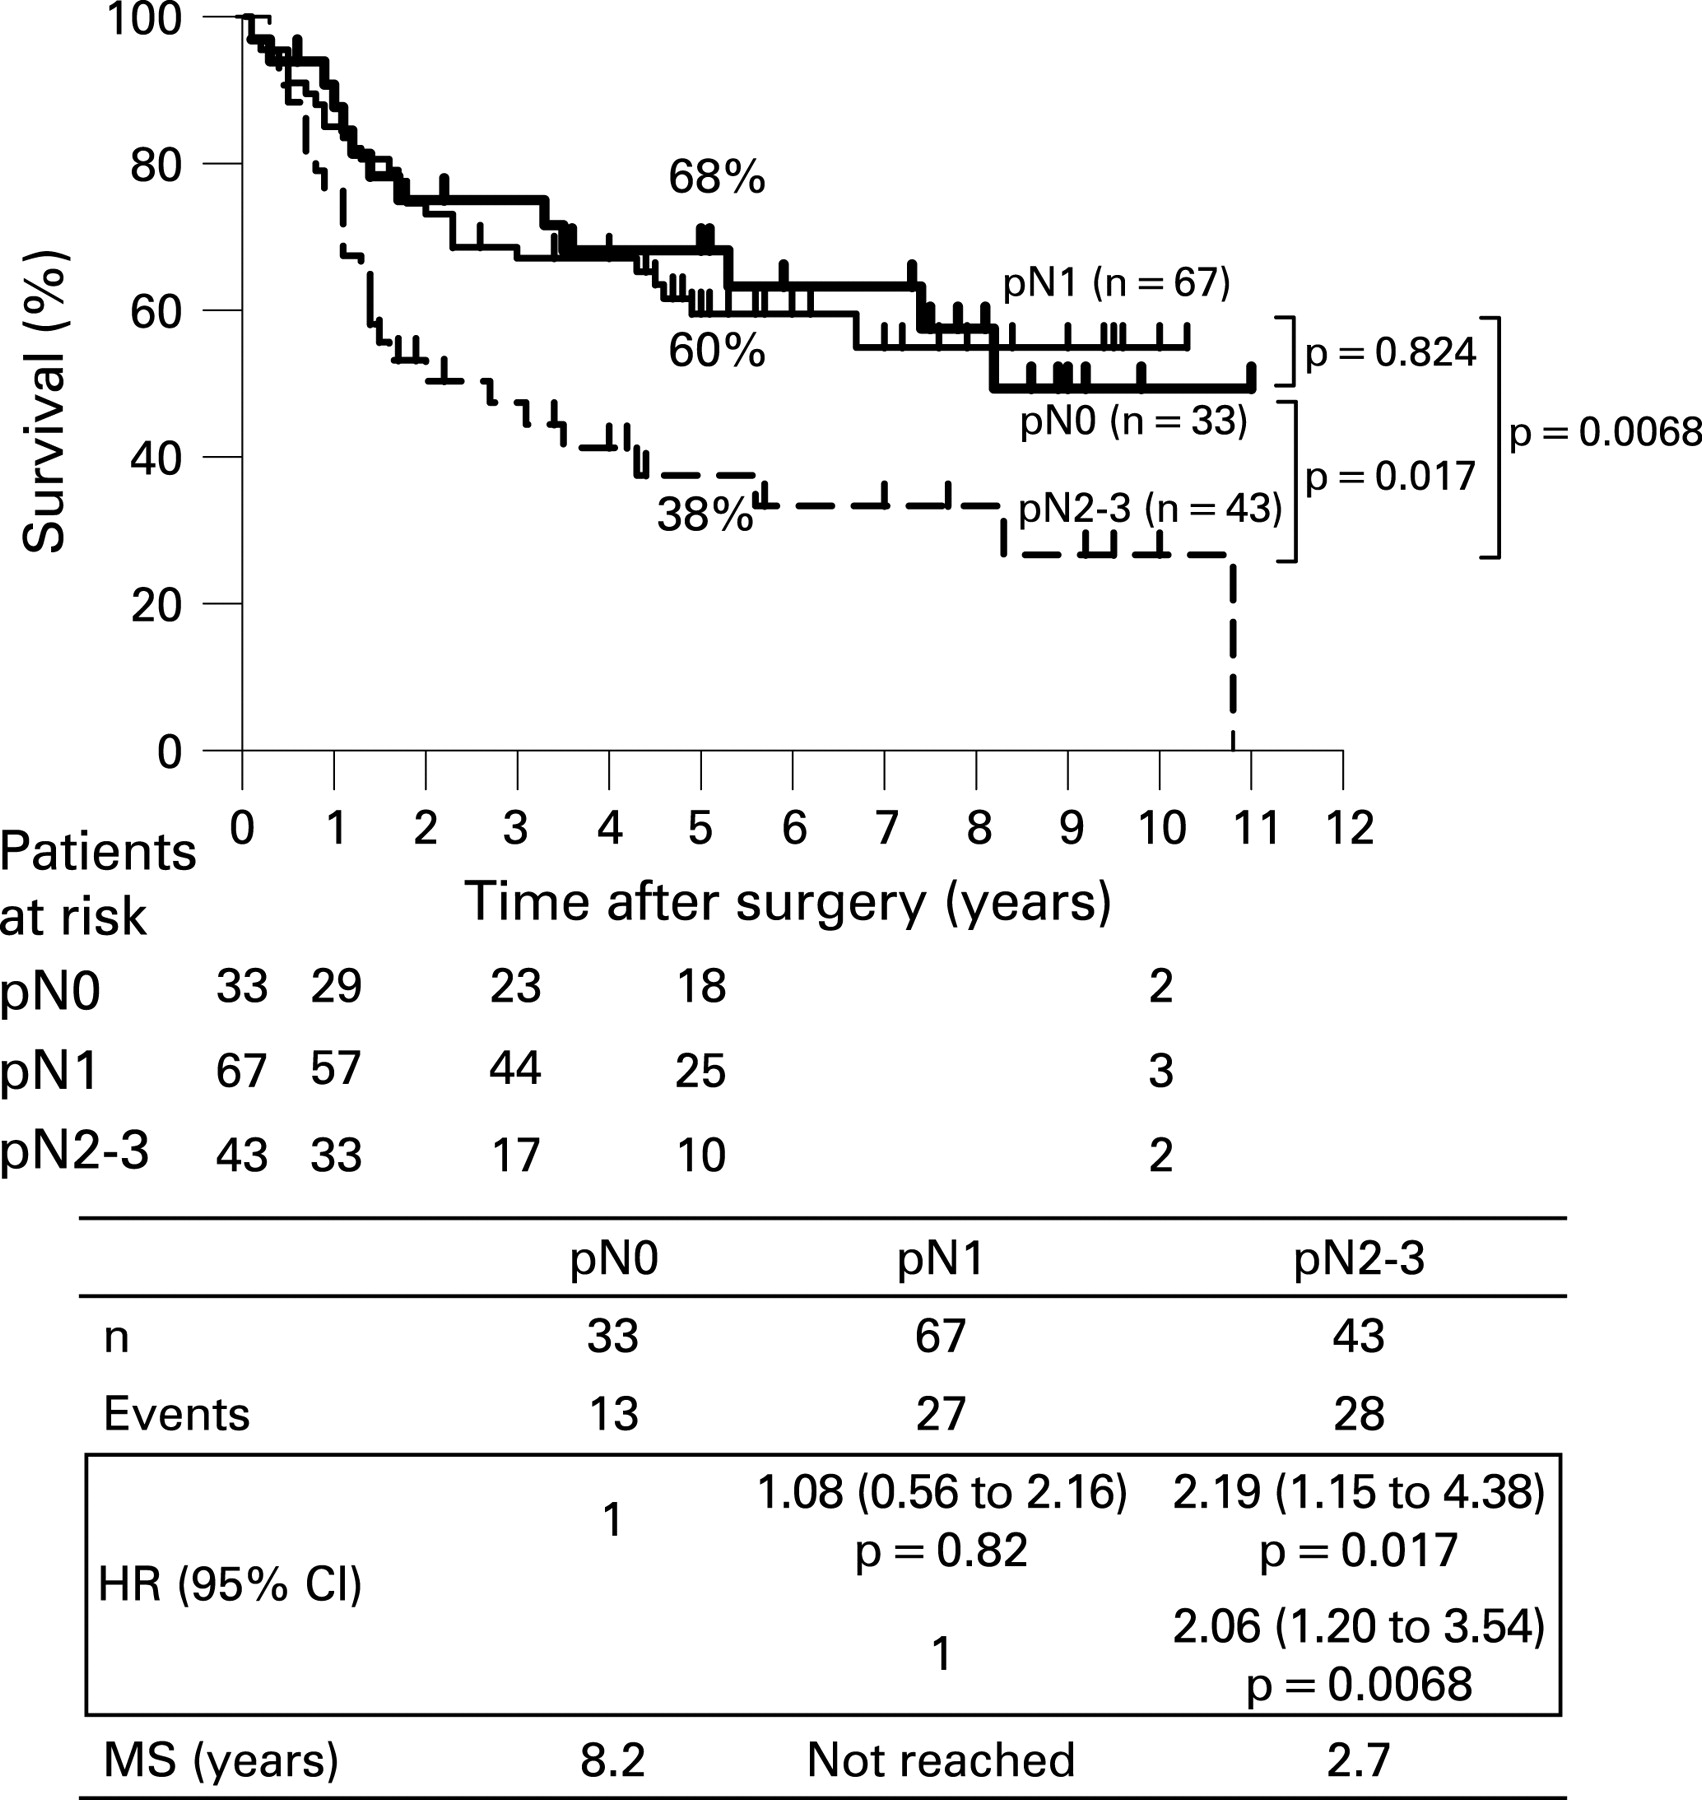
During the follow-up period, 65 (45%) patients developed recurrence. Median time from resection to recurrence was 316 days (range 11–2732). Table 6 shows number of patients with recurrence and their initial recurrence sites according to pathologic N status. The cN1/pN2–3 population developed approximately twice as many recurrent diseases as the cN1/pN0–1 populations. Recurrent disease arising in the cN1/pN2–3 population was almost distant recurrences (29/32, 91%). Two patients with cN1/pN2 who received adjuvant chemotherapy developed multiple distant recurrences and died at 2.7 and 8.3 years, respectively. The cumulative overall 1, 3 and 5 year survival rates of patients with cN1 were 83%, 63% and 55%, respectively, with a median survival time of 7.4 years (fig 2). When we stratified survival according to pathological lymph node status, cumulative overall 1, 3 and 5 year survival rates for patients with cN1/pN0 (n = 33) were 88%, 75% and 68%, respectively, and those for patients with cN1/pN1 (n = 67) were 85%, 67% and 60%, respectively. Patients with upstaged (pN2–3) nodal status (n = 43) showed significantly worse survival than patients with pN0 and pN1 (p = 0.017 and 0.0068, respectively). Hazard ratios for pN2–3 disease relative to pN0 and pN1 were 2.19 (95% CI 1.15 to 4.38; p = 0.017) and 2.06 (95% CI 1.20 to 3.54; p = 0.0093), respectively. The cumulative overall 1, 3 and 5 year survival rates of patients with cN1/pN2–3 were 67%, 44% and 38%, respectively, with a median survival time of 2.7 years (fig 3).

DISCUSSION
Lymph node status is one of the most important determinants in diagnosing surgical respectability for patients with NSCLC.2 For patients with N0 and N1 disease, the standard of care is local treatment, mostly surgical resection, whereas patients with N2 and N3 are usually considered to be candidates for systemic therapy.10 As cN1 disease is a borderline subset for which different treatment strategies are considered, accurate preoperative diagnosis of N1 status is essential.6 Although overestimating a patient with pN0 as cN1 does not alter the treatment strategy, underestimating a patient with pN2–3 as cN1 can result in an incorrect treatment strategy and thus should be avoided.
In our series, N1 status was correctly diagnosed in only 47% of the CT diagnosed cN1 population. Thirty per cent of patients with cN1 had pN2–3 disease, and 23% had pN0. Our results were fairly consistent with those reported previously by Watanabe and colleagues.6 They evaluated clinicopathological correlates of nodal status for 135 patients with cN1 diagnosed in a similar manner to us, and reported that the pathological nodal status was pN0 in 19%, pN1 in 44% and pN2–3 in 37%.6 N1 diagnosis by contrast enhanced CT was concluded to be inaccurate.
The high frequency of upstaging to pN2–3 among the cN1 population might be explained by the following. Firstly, the majority of the CT detected N1 nodes were located around the hilum. As shown in table 2, enlargement of interlobar (No 11) and hilar (No 10) nodes was detected in 81% and 24% of our study population, respectively. However, lobar (No 12), segmental (No 13) and intrapulmonary (No 14) node involvement was evident in only 15 (10%) patients. Peripheral lymph nodes are usually small, and are rarely enlarged more than 1 cm, even when metastatic. Tumour cells in the N1 nodes located downstream in the pulmonary lymphatic system (ie, the nodes around the hilum compared with the peripheral nodes) are more likely to pass into the mediastinum. Secondly, some mediastinal nodes adjacent to the hilum might be misdiagnosed as N1. The anatomical border between the hilar (No 10) and tracheobronchial (No 4) or subcarinal (No 7) nodes is controversial,7 ,11 ,12 and the diagnostic criteria for hilar nodes on CT scans have not yet been clearly established. In our series, among 34 patients with No 10 node enlargement on CT scans, 14 (41%) revealed metastatic nodes in the No 4 or 7 station. Consequently, CT diagnosed N1 disease may represent “advanced” N1 disease that behaves similar to limited N2 disease.
The cN1/pN2–3 population in our series had a significantly poor prognosis, as shown in fig 3. The optimal treatment for N2 disease has not been established: surgery followed by adjuvant chemotherapy, induction therapy followed by resection or chemoradiotherapy. In clinical practice, treatment may depend on physical characteristics and the condition of the individual patient. N2 disease detection before thoracotomy may change the treatment strategy from primary surgery to other treatments. The high frequency and poor prognosis of the cN1/pN2–3 disease population prompted us to identify clinical and radiological factors predicting occult N2 disease. Adenocarcinoma histology, the statistically significant predictor (p = 0.005), predicted pN2 disease in 50% of cases. Separate N1 pattern on CT predicted pN2 in 42%, although it did not reach statistical significance (p = 0.066). When both factors were combined, pN2 status was predictive in 53% of patients. Several authors have indicated, from a prognostic point of view, that metastatic involvement of N1 node apart from the primary tumour should be distinguished from direct invasion.13 ,14 Separate N1 appearance on CT may represent distinct tumour metastases and may also predict more frequent occult mediastinal node metastases.
Patients with adenocarcinoma, especially with a separate N1 pattern on CT, may need additional imaging modalities to rule out N2 disease for appropriate treatment strategy.6 Fluorodeoxyglucose-PET scan, which is based on tumour physiology, has a higher diagnostic accuracy than CT scan for mediastinal staging. A recent meta-analysis reported median sensitivity and specificity of 85% and 90%, respectively, by PET scan (vs 61% and 79%, respectively, for CT scan).15 Integrated PET/CT, which combines the functional information of PET with the anatomical precision of CT, has been found to have an even higher diagnostic accuracy than either CT or dedicated PET, with a reported sensitivity of 89% and specificity of 94% and an overall diagnostic accuracy of 93%.16 Adding PET or PET/CT study to CT might enable the detection of occult N2 disease among the cN1 population. However, negative PET findings dose not necessarily exclude N2 disease, and pathological confirmation of positive PET findings is commonly required to exclude false positive findings.17 In the current series, 13 (9%) of 143 patients with cN1 underwent dedicated PET, and N2 disease was proven after surgery in two (15%) patients. Cerfolio et al recently reported that seven (41%) of 17 patients with cN1 in whom N2 disease was ruled out by PET/CT were subsequently diagnosed with N2 by mediastinoscopy or endoscopic ultrasound with fine needle aspiration (EUS-FNA).18 For patients with CT diagnosed N1, PET and PET/CT imaging on N2 disease detection may be limited, and invasive biopsy modalities may need to be considered. Mediastinoscopy is considered to be the “gold standard” for examining whether there is N2 disease, and several authors concluded that all patients with NSCLC considered for surgery should undergo mediastinoscopy, irrespective of mediastinal lymph node sizes.19 ,20 However, we believe the recommendation is excessive to be indicated for all patients with cN1. Mediastinoscopy is highly reliable with a sensitivity of 81% and a false negative rate of less than 10%.21 But it is also costly, requires general anaesthesia and has a complication rate of 0.5–2.5%.22 ,23 The two predictive factors (adenocarcinoma histology and separate N1 status on CT scans) that we have demonstrated in the present study might be helpful in selecting candidates for mediastinoscopy.
EUS-FNA and endobronchial ultrasound transbronchial needle aspiration (EBUS-TBNA) have recently been reported as useful minimally invasive node biopsy modalities. Well experienced endoscopists can access lymph nodes greater than 5 mm in size.24 ,25 Both procedures can be performed using moderate sedation with high sensitivity and specificity over 90%.24–26 EUS-FNA also has the advantage of accessibility to subaortic (No 5), paraoesophageal (No 8) and pulmonary ligament (No 9) stations, which are not accessible by mediastinoscopy. By combining EUS-FNA and EBUS-TBNA, the majority of mediastinal lymph nodes could be accessible with minimal invasiveness.27 EUS/EBUS biopsy might be a good alternative in detecting unsuspected N2 disease among the cN1 population.
It is remarkable that more than half of our patients with cN1 underwent extensive resection of lung parenchyma: pneumonectomy in 29% and bilobectomy in 25% of patients. Several investigators have conducted randomised trials comparing induction chemotherapy followed by surgery with surgery alone in patients with stage IB or stage II NSCLC. Induction therapy is meaningful if it induces pathological downstaging, avoids extensive resection and increases the chance of organ sparing surgery. However, a recent multicentre phase III study by the French Thoracic Group targeting early stage NSCLC, including cN1 diseases, could not significantly decrease the overall pneumonectomy rate: 55.7% in surgery alone versus 48.6% in induction chemotherapy followed by surgery groups (p = 0.30).28 Further studies are necessary to clarify the role of neoadjuvant chemotherapy for patients with cN1. In the current standard, we have to evaluate patients with cN1 whether or not they have enough cardiopulmonary reserve tolerable to extensive lung resection.6
In conclusion, cN1 diagnosis by CT, the current standard staging modality for NSCLC, is not satisfactorily accurate. Approximately 30% of patients with cN1 had pN2–3 disease, and they may have benefited better from a treatment strategy other than primary surgical resection if N2 status was proven before thoracotomy. Patients with clinical N1, especially with adenocarcinoma and possibly with a separate N1 appearance on CT, should be considered for additional invasive node biopsy modalities, including mediastinoscopy. Because extensive lung resection is often required for patients with cN1, careful cardiopulmonary function examination is needed to reduce perioperative complications.
Acknowledgments
The authors thank Professor J Patrick Barron of the International Medical Communications Centre of Tokyo Medical University for reviewing this manuscript. The authors also thank Dr T Mizuno for his assistance with data collection; Ms R Kashiwabara and W Sasaki for secretarial support; Dr S Shiono for critical reading of this manuscript; and Drs M Hagiwara, J Nitadori, T Mochizuki, H Konno, T Saijo and K Aokage for their helpful suggestions.
REFERENCES
Footnotes
Funding: The work was supported in part by a Grant-in-Aid for Cancer Research from the Ministry of Health, Labour and Welfare, Japan
Competing interests: None.
Ethics approval: Data collection and analyses were approved and the need for obtaining informed consent from each patient was waived by the institutional review board in March 2005.