Article Text

Abstract
Background: Measurements of pulmonary biomarkers can be used to monitor airway inflammation in chronic obstructive pulmonary disease (COPD), but the variability of sampled biomarkers and their inter-relationships are poorly understood. A study was undertaken to examine the intra- and inter-patient variability in spontaneous sputum samples from patients in the stable state and to describe the relationship between biomarkers, cell counts and markers of disease.
Methods: Sputum interleukin-1β, tumour necrosis factor α, interleukin 8, myeloperoxidase, leucotriene B4, growth-related oncogene α and differential cell counts were measured in patients with moderate to severe stable COPD (n = 14) on 11 occasions over a 1-month period.
Results: There was significant variability in all inflammatory indices (median intra-patient coefficient of variation (CV) 35% (IQR 22–69), median inter-patient CV 102% (IQR 61–145)). Variability could be reduced by using a rolling mean of individual patient data points. Sample size calculations were undertaken to determine the number of patients required to detect a 50% reduction in neutrophil count. Using a crossover design of a putative effective treatment, the number needed using one data point per patient was 72, reducing to 23 when a mean of three data points was used. Significant correlations were demonstrated both between the inflammatory biomarkers themselves and between inflammatory biomarkers and markers of disease. Some relationships were not apparent when results from a single sample were used. The reliability of inter-relationships improved as more data points were used for each patient.
Conclusions: Clear relationships exist between inflammatory biomarkers in patients with stable COPD. Sequential sampling reduced the variability of individual mediators and the potential number of patients needed to power proof of concept interventional studies.
Statistics from Altmetric.com
It is widely accepted that chronic obstructive pulmonary disease (COPD) is an inflammatory condition. and many inflammatory mediators and their corresponding receptors have been highlighted as potential targets for specific anti-inflammatory therapeutic intervention.1 Some of these agents have been used in limited studies, such as antibodies directed against tumour necrosis factor α (TNFα)2 and interleukin 8 (CXCL8)3 and small molecule antagonists of leucotriene B4 (LTB4),4 while other anti-inflammatory agents are under development with the anticipation of clinical trials in the future.1
In drug development for COPD there is a need to conduct small short-term phase 2 trials to identify biological and efficacy read-outs for novel therapeutic agents. Conventional physiological tests are often inappropriate for the early investigation of drugs with potential disease-modifying anti-inflammatory activity since these trials would be relatively long, involving large patient numbers and hence prohibitively expensive. For this reason, disease-related biomarkers are considered to be the appropriate candidates for initially investigating drug efficacy in disease. Recent studies have listed biomarkers which correlate with disease severity and BODE index,5 but there is little information about the reproducibility of measurements and the relationship of these indices to other inflammatory mediators, disease development, severity and progression.6 Only sputum neutrophils, CXCL8, TNFα and C-reactive protein have successfully differentiated between the differing stages of COPD,6 although other studies have shown associations between different biomarkers both when stable and during exacerbations.7
The majority of interventional studies have relied upon a single pre- and post-interventional measurement of a biomarker to ascertain any change.1 ,8 However, without knowledge of the inherent variability of the factor being used, it is difficult to perform the calculations required to ensure that a study has sufficient power to detect a relevant difference, and this will be critical in determining the role of an individual mediator in the inflammatory cascade and the decision to proceed to larger studies to determine clinical benefit.
The purpose of the present study, therefore, was twofold: (1) to describe the variability in inflammatory indices in spontaneous sputum in stable COPD and to assess the effect of multiple sampling to reduce this variability; and (2) to assess the relationship between some mediators that have been implicated in the pathogenesis of COPD.
METHODS
Study subjects
Patients aged 50–78 years with a diagnosis of GOLD stage III COPD9 were recruited. They were daily sputum producers with a history of chronic bronchitis as defined by the MRC criteria10 and were current or ex-smokers. All patients were confirmed to have obstructive airways disease at screening by spirometric measurements and had stable symptoms of COPD for at least 8 weeks prior to recruitment with no changes in medication during this time. Alternative and concomitant lung disease was excluded clinically and by high-resolution CT scanning.
Study design
Patients were seen on 11 occasions over 4 weeks (daily for 5 days, then twice weekly for 3 weeks). On each visit the patients were reviewed, symptoms were noted and samples of spontaneous sputum and blood were collected. Spirometry was assessed weekly to assess disease stability.
Patients were asked to complete daily diary cards, described previously,11 throughout the study. Symptoms (including dyspnoea, sputum volume and colour) were recorded using an ordinal scale which allowed differentiation between normal for the patient and better or worse than usual to ensure that there were no changes suggestive of an exacerbation.
Sample collection and processing
Spontaneous sputum samples were collected over 4 h (from rising in the morning) following mouth-washing procedures to minimise salivary contamination. Sputum collection and analysis occurred at the same time on each visit. The samples were divided into two aliquots: the first was ultracentrifuged (50 000 g for 90 min at 4°C) to prepare a sol phase sample to determine mediator concentrations. The second was treated with dithiothreitol to assess total cell numbers and cytospins prepared for total and differential cell counts of squamous cells, neutrophils, eosinophils, macrophages and lymphocytes.12 Where relevant, patients were asked to abstain from smoking from waking until sputum collection was complete.
Measurement of mediators
Mediators were measured using Enzyme Amplified Sensitivity Immunoassay (R&D Systems, Abingdon, UK) and expressed in molar concentrations. All assays were validated to determine their working range and the variability of mediator measurements both within and between assay plates using methods described previously.12
In order to reduce intra-patient variability in biomarkers, the effects of employing a rolling mean were assessed. A 3-day rolling mean was determined for each mediator and cell count in each patient by averaging the results from visits 1, 2 and 3 (“rolling mean 3a”), then from visits 2, 3 and 4 (“rolling mean 3b”), etc, until the final visit was incorporated into a rolling mean (“rolling mean 3i”). A 5-day rolling mean was also determined for each biomarker in each patient by averaging the results from visits 1–5 (“rolling mean 5a”), then from visits 2–6 (“rolling mean 5b”), etc, until the final visit (“rolling mean 5g”).
Statistical analysis
Data analysis was performed using SPSS 12.0 for Windows (SPSS, Chicago, Illinois, USA). Normally distributed data are expressed as mean and standard deviations, categorical data as percentages and non-normally distributed data as median and interquartile range (IQR). Non-normally distributed continuous variables (such as mediator concentrations and cell counts) were log transformed to achieve normality and allow calculation of the coefficient of variation (CV). The correlations between logged mediator concentrations and cell counts were evaluated by Pearson’s correlation coefficient (PCC).
Sample size calculations were based on both a two-group parallel comparison and a paired (crossover) comparison in clinical trials. A parallel design used the formula:

and a crossover design used the formula:

where D was the smallest difference to be detected (a 50% decrease in mediator concentration or cell count was used as an arbitrary effect size for illustrative purposes) and S represented the standard deviation of the observations. C = 7.85 to provide an 80% power of detecting a reduction in mean mediator concentration or cell counts at the 5% level of significance.13
RESULTS
Baseline characteristics
Fourteen patients were enrolled and their baseline characteristics are summarised in table 1. The medications being taken by each patient during the study are listed in table E1 in the online supplement. Exacerbations, defined clinically,14 were excluded on each visit by review of daily dairy cards, clinical examination, confirmation of unchanged therapy15 and weekly spirometry. None of the patients experienced an exacerbation during the study period and there were no significant changes in diary scores or lung function between visits.
Assay variability and sputum characterisation
In all cases the mediator intra- and inter-assay variability was less than 10%. The median percentage of squamous cells in the samples was 0.6% (IQR 0–7.9%) and the median percentage of viable cells (assessed by trypan blue exclusion) was 83% (IQR 63–92%) which is comparable to that seen with induced sputum.16
Intra-patient variability in mediator concentrations and neutrophils
There was considerable variability in the concentrations of mediators and cells within individual patients over the study period. Figure 1 demonstrates the variability seen for one patient and table E2 (in the online supplement) describes the intra-patient variability for all mediators and sputum neutrophil and macrophage counts for each patient.
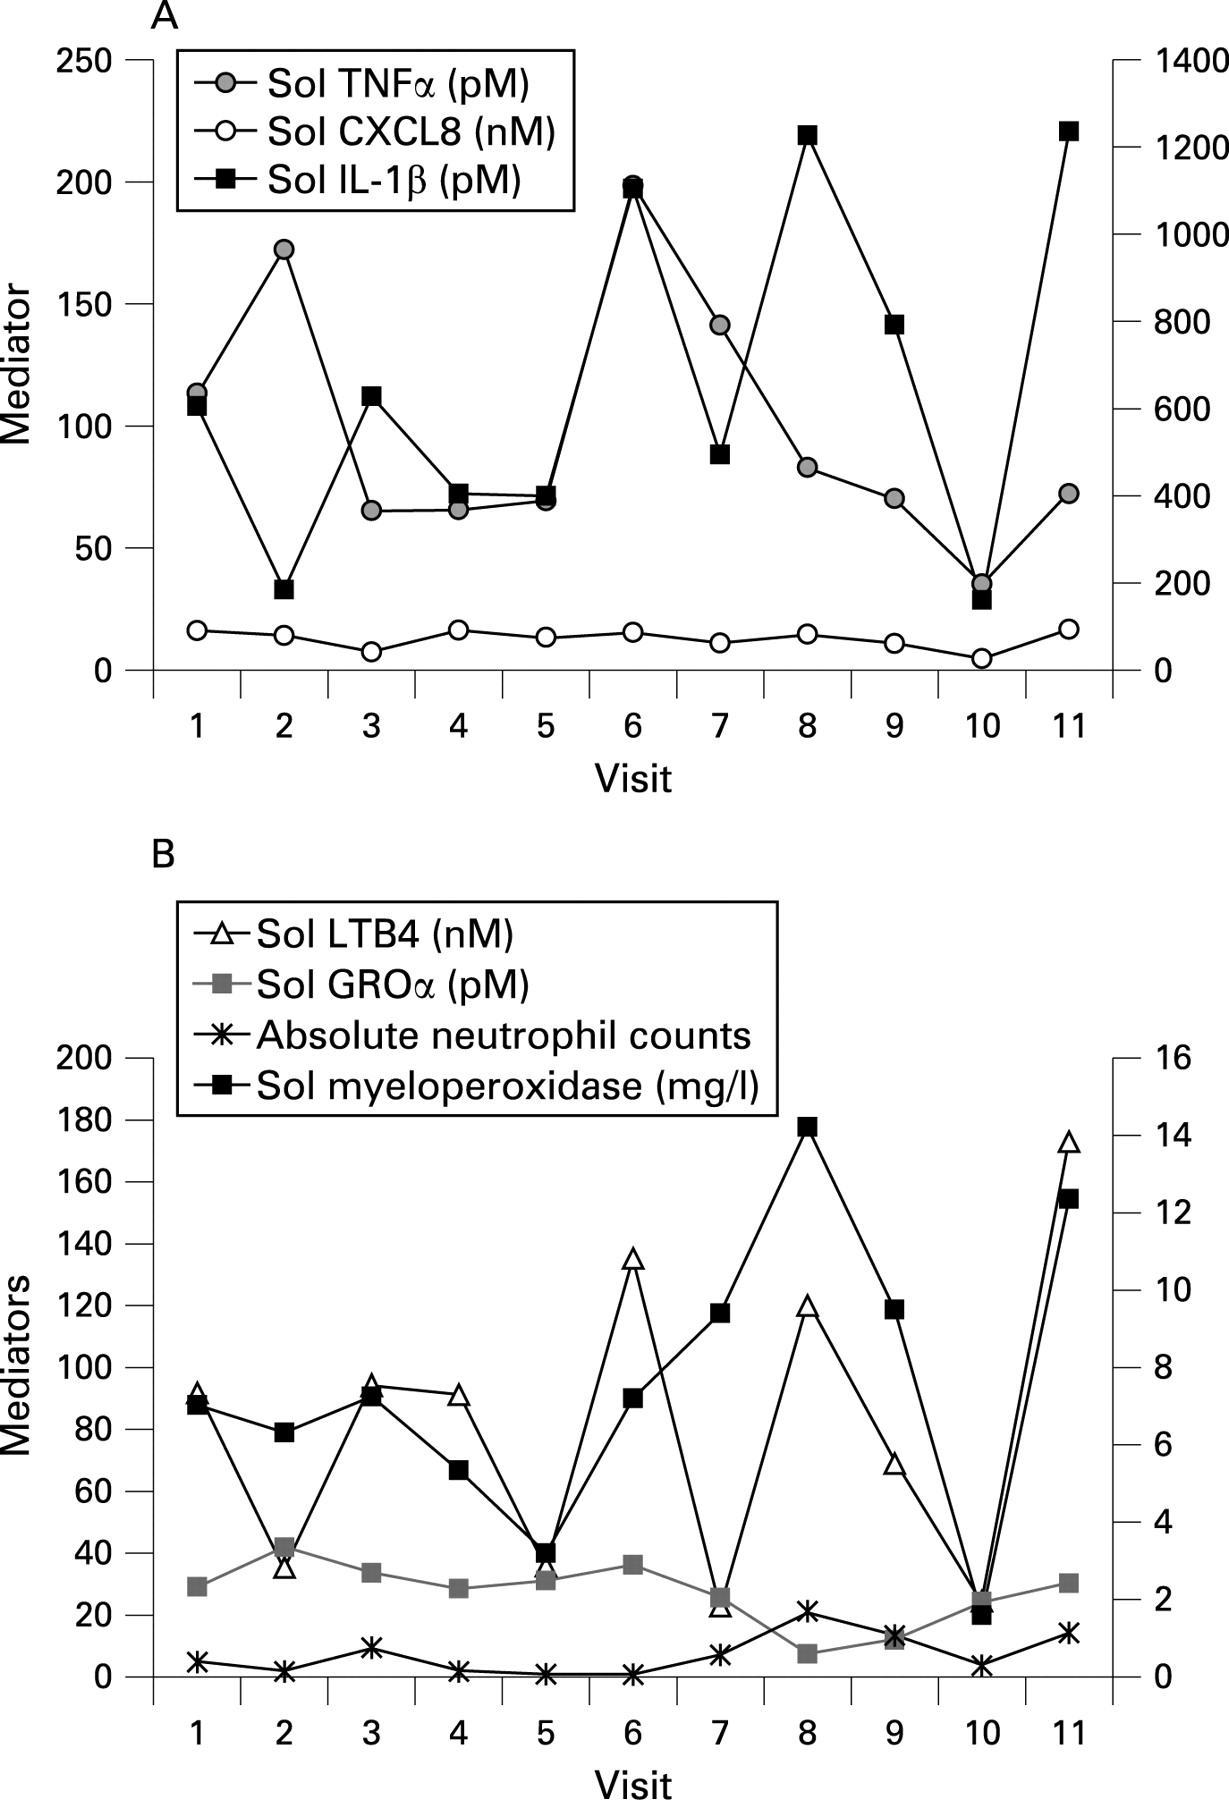
The variability in sputum inflammatory markers seen within patients was wide, irrespective of the inflammatory mediator or cell type measured. The median intra-patient CV for each mediator (calculated from each patient’s CV) is shown in table 2. This variability was not related to any changes in individual symptoms as recorded in the patients’ diary card scores, clinical features, sputum microbiology or lung function (all of which remained stable).
Reducing intra-patient variability
Table 3 compares the effects of a rolling mean on intra-patient variability for all patients and all mediators (expressed as CVs). When comparing a single mediator within patients, a significant reduction in variability of the raw data (as determined by the CV) was obtained using a 3-day rolling mean in all biomarkers except for sputum neutrophil counts. A further reduction in variability was seen using a 5-day rolling mean in all biomarkers including sputum neutrophil counts. Figure 2A–C (available online) compares graphically the variability in mediator concentrations and the effect of rolling means for one representative patient.

Inter-patient variability and the effects of a rolling mean
There was marked variability in inflammatory biomarkers between patients with COPD using data from a single day. Using a 3-day or 5-day rolling means for each patient did not alter the inter-patient variability, which suggests that it relates to individual differences in the degree of airway inflammation.
When all mediators were considered together, the median variability between patients using daily data (expressed as the CV) was 101% (IQR 90–123%) and the median variability between patients using the first 5-day rolling mean was only slightly reduced to 91% (IQR 73–115%) (table 4).
Determining the sample size required to power interventional studies
Using a crossover design, the number of patients needed to confirm a 50% reduction in sputum neutrophil counts with 80% power and at the 5% significance level using a single data point per patient would be 72. However, if a 3-day mean is used, the number needed to confirm the same reduction would be 23, and 20 with a 5-day mean. For a parallel design, the number needed to confirm a 50% reduction in sputum neutrophil counts using a single data point would be 140 (70 per group), which would be reduced to 106 and 103 using a 3-day or 5-day mean, respectively.
Table E3 (available online) summarises the mean (SE) number of patients required to detect similar changes in other mediators when a single sample is collected or when the mean of three or five consecutive samples is used for power calculations.
Relationship between sol phase inflammatory mediators and sputum cell counts
The strength of the correlations between mediators and cells (and the significance of these correlations) increased as more data points were used for each patient. Figure 3A–C (available online) demonstrates the correlations seen between sol phase LTB4 and sputum neutrophil counts when the first day’s data were used for each patient (fig 3A) compared with the mean of the first 3 days (fig 3B) or all 11 days (fig 3C). Figure 4A–C (available online) demonstrates the correlations seen between IL-1β and the absolute sputum neutrophil count, TNFα and CXCL8, respectively, using the mean value for all 11 samples for each patient.


Tables E4 and E5 (available online) describe the correlations seen between all mediators and neutrophils using a similar approach. In general there was an increase in the correlation coefficient using the mean of 3 days’ data compared with 1 day’s data (mean difference in Pearson’s correlation coefficient between 1 day’s data and the mean of 3 days’ data = 0.11 (95% confidence interval 0.04 to 0.18), p = 0.003), but there was no further increase in the strength of the correlation using the mean of more data points.
All biomarkers measured showed inter-relationships with each other of varying significance (see table E4 in the online supplement) with the exception of GROα which showed no correlation with neutrophils or any other mediator measured in sputum, apart from CXCL8.
Relationship between sol phase inflammatory mediators, cell counts and disease
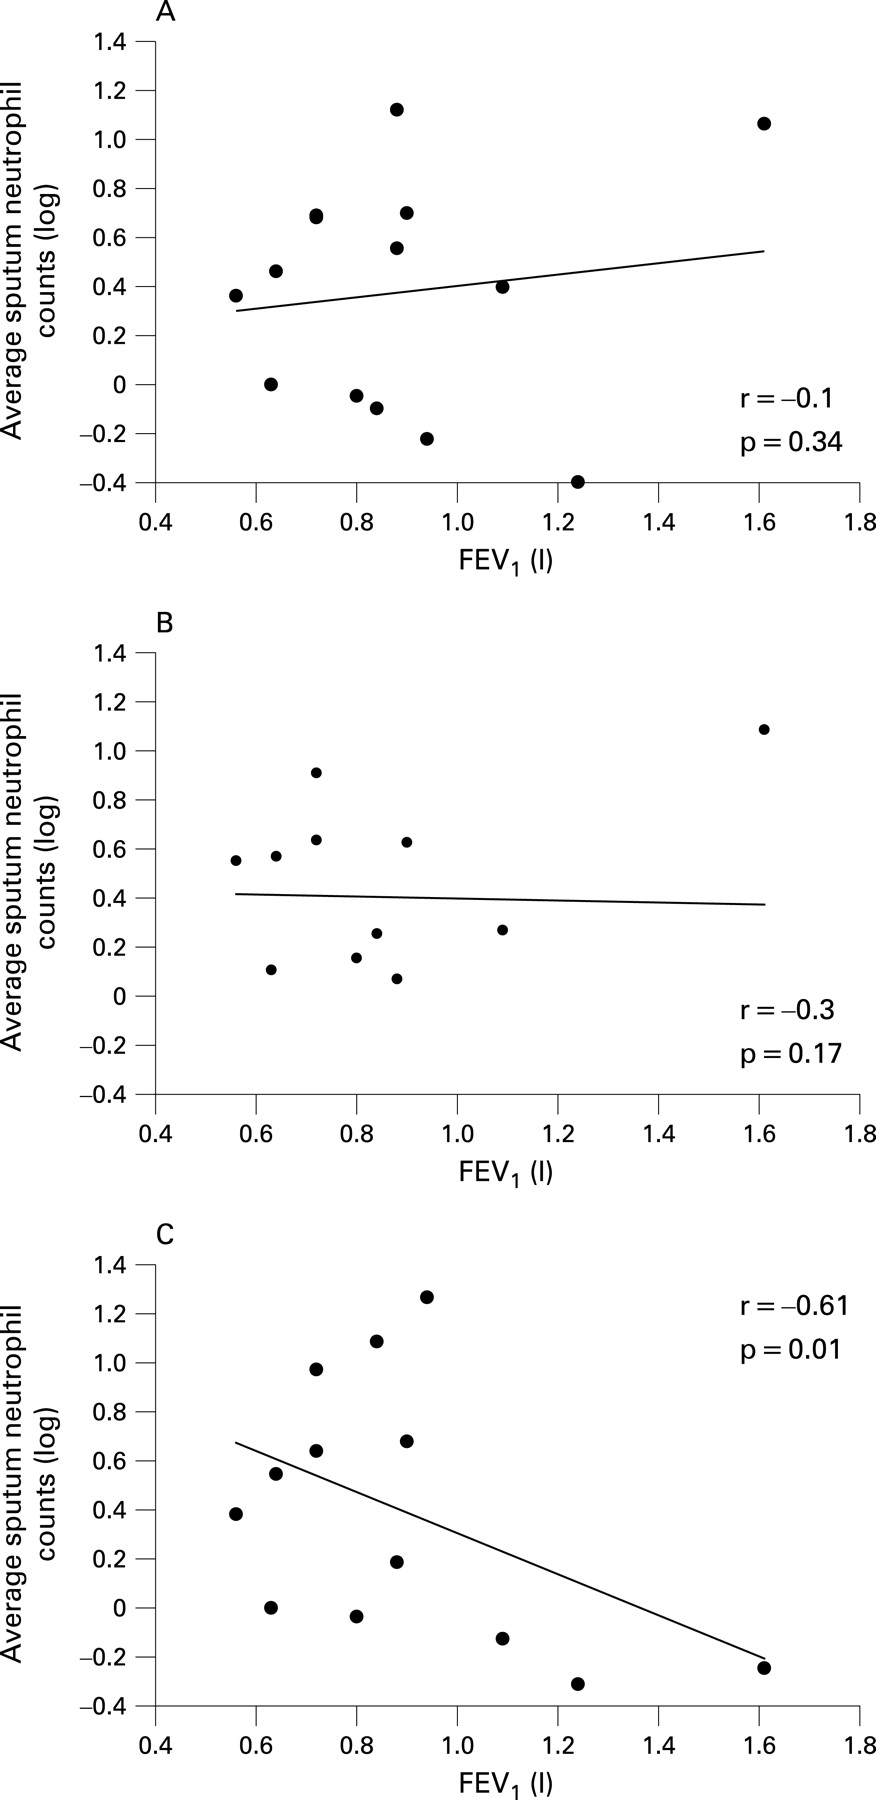
Correlations were seen between inflammatory mediators and markers of disease but, as with the inter-relationships between mediators, the strength of the correlation (and the significance value) increased as more data points were used for each patient. Using the first day’s data for each patient, only IL-1β correlated with body mass index (BMI; r = −0.5, p = 0.03). Using the mean of the first 3 days for each patient, significant correlations were seen between BMI and IL-1β (r = −0.5, p = 0.02) and TNFα (r = −0.48, p = 0.03). However, using the mean of 11 data points per person, significant correlations were present between BMI and IL-1β (r = −0.41, p = 0.05), TNFα (r = 0.4, p = 0.05) and LTB4 (r = −0.51, p = 0.03); smoking history and sputum neutrophils (r = −0.61, p = 0.008) and sputum macrophages (r = 0.46, p = 0.05); and forced expiratory volume in 1 s (FEV1) and TNFα (r = −0.45, p = 0.04) and sputum neutrophils (r = −0.6, p = 0.01). Figure 5A–C (available online) summarises the correlation between FEV1 and sputum neutrophil counts for a single sample (day 1) for each patient (fig 5A) compared with the mean for the first 3 days (fig 5B) or 11 days (fig 5C).

DISCUSSION
In this well characterised group of patients with GOLD stage III COPD and chronic bronchitis, marked variability in inflammatory mediators and cells was found, both between patients and within each patient over the course of a 4-week period. Given the heterogeneous nature of COPD, it is perhaps unsurprising that inflammatory biomarkers vary between individuals and, indeed, this finding is in agreement with a wealth of previously published data.17 ,18
The variability of the raw data within individuals was also marked, even in samples taken on consecutive days, and the fluctuations did not relate to changes in symptom scores, clinical findings or changes in FEV1 (all of which remained stable). It is likely that the variability reflects changes in sampling methodology or sputum humidification over the study period rather than individual patients showing wide fluctuations in the daily inflammatory load of the lungs without this impacting on daily symptoms. It may be that only when changes in lung inflammatory load are sustained at a higher magnitude over consecutive days does it relates to changes in clinical status. This relationship has been demonstrated in patients with prednisone-dependent asthma where clinical indices deteriorate much later than the inflammatory changes in sputum.19
Sampling techniques vary between studies of inflammation in COPD, but the intra- and inter-patient variability of measured mediators is unknown for most methodologies. The variability of sequential bronchial biopsies appears significant despite this technique having the advantage of directly sampling airway tissue.20 To date, one study has provided data regarding the reproducibility of induced sputum: three samples taken at 4-weekly intervals showed no significant differences in neutrophil counts or CXCL8 concentrations in 12 patients with mild to moderate COPD.21 The concentration of mediators in exhaled breath condensate (EBC) is often at levels close to the lower limit of detection (and often below the lower limit of quantification) for most assays, making accurate measurements difficult.22 There is high variability in repeated measurements of EBC inflammatory indices,23 which is likely to be dependent upon difficulty both in quantification as well as the dilution caused by water vapour. Bronchoalveolar lavage (BAL) fluid samples are also complicated by dilution from the lavage which is operator-dependent, variable and for which no correction factor has been determined.8 Furthermore, the variability of biomarkers using BAL fluid is currently unknown because of practicalities of repeated sampling.
Spontaneous sputum collection is non-invasive and has no inflammatory sequelae to limit sequential sampling. Furthermore, spontaneous sputum samples are the only medium where an artificial dilution factor is absent.8 ,24 However, there is still an inherent physiological dilution present in all lung secretions which will have an impact on the ability to perform accurate serial measurements.
Sputum is a mixture of lower airway and oropharyngeal secretions. Lower airway secretions are affected by exudation of plasma-derived proteins into the airway lumen25 which occurs both when the epithelial mucosa is damaged26 and intact, both structurally and functionally,27 and presents a dilutional factor inherent in all sampling methodologies.
Oropharyngeal contamination can be reduced by patient education and confirmed by the percentage of squamous cells in the sample, which should typically be less than 10%. In our study, squamous cells accounted for less than 1% of cells seen in the samples, suggesting that oropharyngeal contamination was low. Although we took the precaution of asking patients to rinse their mouths prior to expectoration, the rinse itself or any remaining oropharyngeal secretions could still dilute the sputum samples. Indeed, this could explain some of the intra-patient variability seen day to day, and similar effects could influence the between-patient variability.
If mediator and cell values were overwhelmingly influenced by dilution, it would be predicted that mediator concentrations between patients would correlate well, as dilute samples would have low measured concentrations of mediators and concentrated samples would have high measured concentrations of mediators, even if all patients were in the same inflammatory state and mediator secretion was identical. The data for GROα, however, suggest that this is not the case. In our study GROα failed to correlate with any other mediator except CXCL8. This suggests, firstly, that the remaining correlations reflect different inflammatory states per patient and, secondly, that GROα does not reflect inflammatory differences between patients or the neutrophil content of airway secretions. GROα may be less important in the development or progression of COPD than other mediators. It is possible that GROα has a different spectrum of activity than previously suspected,28 or that GROα is maximally expressed in COPD patients with chronic bronchitis irrespective of the degree of inflammation.29 However, the fact that GROα does not correlate with other biomarkers provides sound evidence that the relationships seen between other mediators are not purely dilutional in nature. Furthermore, the correlations with systemic markers of disease (BMI and FEV1) and the use of repeated sampling (when any variable dilutional factors would be minimised) also makes this explanation unlikely.
We reassessed marker variability within patients by the use of a rolling mean. This technique requires multiple data points in order to overcome fluctuations due to variable sample dilution. A 5-day rolling mean had the optimal effect on intra-patient variability. However, a 3-day rolling mean also reduced intra-patient variability and was able to demonstrate most of the key relationships between mediators. This supports its use as a technique for studying real changes in inflammation in interventional studies. Two 3-day collections of spontaneous sputum (pre- and post-intervention) in each patient would provide a sound basis for interpreting inflammatory changes following treatment.
Simple power calculations were undertaken to assess the effect of single or multiple data points on sample size in a crossover or parallel interventional study design. In a putative trial where a single uncorrected data point is taken for each patient both before and after intervention, our calculations suggest that fewer patients would be needed to see a 50% reduction in mediators and cells using spontaneous sputum than would be needed to detect the same reduction in mediator-positive cells in bronchial biopsies.30 The numbers needed can be reduced dramatically by using three data points, with a small further reduction with five data points. These results were not altered if data from three separate days were used (eg, days 123, 456, 789, etc) compared with overlapping days (eg, days 123, 234, 345) which could be influenced by repeated inclusion of a single day.
The wide inter-patient variability is determined from a relatively small cohort of patients. It is possible that others may have inflammation vastly outside the range documented here which would affect the power calculations for a parallel study. However, the single-day data are consistent with stable state results in our previous larger studies of over 100 patients with a wide range of FEV1,4 ,7 ,31 ,35 suggesting that the current data are representative.
By choosing spontaneous sputum, we limited our recruitment to patients with chronic bronchitis. Although there remains some controversy as to the importance of sputum production in COPD, a body of evidence is emerging that suggests that chronic bronchitis may be a predictor of mortality and morbidity independent of FEV1. Previous work has concluded that the inflammatory burden is higher in patients with chronic bronchitis than in matched patients without chronic bronchitis.31 Furthermore, chronic mucus hypersecretion is consistently associated with both an excess decline in FEV1 and an increased risk of subsequent hospitalisation because of COPD;32 mucus hypersecretion is associated with death from respiratory infections.33 Given the importance of this symptom in COPD and its relationship with inflammation, it is important to understand the relationships between inflammatory mediators in this group of patients. Studying spontaneous sputum samples prevents comparison with healthy controls, which is a limitation of the current study. However, it has been established that the mediators and cells measured in the current study are raised in patients with COPD compared with healthy controls in studies using induced sputum.5–7 Furthermore, the aims of the current study were to document the variability of measured mediators and their inter-relationships in spontaneous sputum samples from patients with COPD and chronic bronchitis. A further limitation is that effective anti-inflammatory interventions may reduce the ability of the subject to produce spontaneous samples, but this in itself would be proof of efficacy and would be likely to reflect a major reduction in inflammation.31
The current study demonstrated clear inter-relationships between most of the measured inflammatory mediators which were enhanced by using the mean mediator concentration for each patient. Previous studies have reported indirect evidence that some biomarkers may be involved in the pathogenesis of COPD, including the presence of higher concentrations of mediators in disease compared with matched controls and the increases seen during exacerbations.5 ,17 ,28 ,30 ,34 ,35 This study is the first to describe the relationships seen between several biomarkers and the strength of these correlations in lung secretions. IL-1β and TNFα, in particular, correlated strongly with all the other measured biomarkers (with the exception of GROα) and neutrophils, indicating an intimate relationship with inflammation.
Using mean results for each patient, this study also demonstrated clear relationships between inflammatory biomarkers and other markers of disease including the FEV1 (in litres), smoking history and BMI. Many mediators have been found to be raised in COPD, but it is unlikely that all will be central to the pathogenesis of the disease. FEV1 is the most consistent single predictor of survival and quality of life in COPD,36 and the relationships described between TNFα, absolute sputum neutrophil and macrophage counts and both FEV1 and smoking history is highly suggestive that these cells and TNFα are of paramount importance in the pathogenesis of airflow obstruction. Indeed, recent studies suggest that TNFα is associated with the development of emphysema,37 and there is a wealth of data supporting the central role of macrophage and neutrophil proteinases in COPD.38 It is recognised that weight loss and low body weight are common in COPD, and that low body weight is associated with increased mortality independent of lung function.39 ,40 Further studies have suggested that loss of muscle mass is the most important component of weight loss in COPD, and it is this which affects patients functionally.41 In the current study, IL-1β, TNFα and LTB4 correlated negatively with BMI, supporting the hypothesis that an increase in lung inflammation is associated with a lower body weight. Previous studies have linked a low BMI to systemic inflammation,42 but this is the first study to describe the relationship between multiple biomarkers measured in sputum and BMI. This again provides evidence that these biomarkers may be of importance in COPD and its associated systemic morbidity and supports the concept that wide inter-patient variability is a true finding of inflammatory differences between patients.
Serial measurement of biomarkers enabled us to study their relationships using either 1 day’s data or the mean of data from 3, 5, 7 or 11 days for each patient. Given the variability of the raw data, it is perhaps unsurprising that correlations were not always present when 1 day’s data were examined, although there was still a significant correlation between some mediators (see tables E4 and E5 in the online supplement). However, in general, using the mean of 3 days’ data demonstrated the same relationships and provided the same strength of correlations as using the mean of 11 days’ data. This is of importance as it has implications for studies designed to assess the relationships between biomarkers and, perhaps more importantly, biomarkers and clinical measures or outcomes. We have shown that potentially important relationships can be missed if only one data point is used, and that the use of at least three data points increases the likelihood of identifying these relationships while the addition of further data points continues to reduce within-patient variability.
In conclusion, this study documents the variability in mediator concentration both between and within patients with stable severe COPD. Most of this variability is likely to be due to dilution effects, and intra-patient variability is reduced significantly by sequential biomarker measurement which minimises this variation irrespective of alterations in the inflammation signal. This technique would therefore be ideal for studying inflammatory change in COPD and can be used to power short-term proof of concept studies.
The study demonstrates the positive correlations that exist between sputum inflammatory mediators, neutrophil and macrophage counts, and these biomarkers and other markers of disease severity. By the use of sequential measurements, we have shown that one measurement alone may be insufficient to identify all relationships between mediators. Further sequential sampling reduces the within-patient variability, and using three samples is both reasonable and dramatically reduces the numbers required for both parallel and crossover interventional studies.
Acknowledgments
The authors thank Diane Griffiths, Queen Elizabeth Hospital and Debbie Parker, Glenfield Hospital.
REFERENCES
Supplementary materials
web only appendices 63/3/493
Files in this Data Supplement:
Footnotes
Funding: The study was approved by the local research ethics committee and all patients gave informed consent.
Competing interests: None.
Ethics approval: AstraZeneca sponsored this work with an unrestricted grant.