Article Text

Abstract
Aim: The prevalence of airway obstruction varies widely with the definition used.
Objectives: To study differences in the prevalence of airway obstruction when applying four international guidelines to three population samples using four regression equations.
Methods: We collected predicted values for forced expiratory volume in 1 s/forced vital capacity (FEV1/FVC) and its lower limit of normal (LLN) from the literature. FEV1/FVC from 40 646 adults (including 13 136 asymptomatic never smokers) aged 17–90+years were available from American, English and Dutch population based surveys. The prevalence of airway obstruction was determined by the LLN for FEV1/FVC, and by using the Global Initiative for Chronic Obstructive Lung Disease (GOLD), American Thoracic Society/European Respiratory Society (ATS/ERS) or British Thoracic Society (BTS) guidelines, initially in the healthy subgroup and then in the entire population.
Results: The LLN for FEV1/FVC varied between prediction equations (57 available for men and 55 for women), and demonstrated marked negative age dependency. Median age at which the LLN fell below 0.70 in healthy subjects was 42 and 48 years in men and women, respectively. When applying the reference equations (Health Survey for England 1995–1996, National Health and Nutrition Examination Survey (NHANES) III, European Community for Coal and Steel (ECCS)/ERS and a Dutch population study) to the selected population samples, the prevalence of airway obstruction in healthy never smokers aged over 60 years varied for each guideline: 17–45% of men and 7–26% of women for GOLD; 0–18% of men and 0–16% of women for ATS/ERS; and 0–9% of men and 0–11% of women for BTS. GOLD guidelines caused false positive rates of up to 60% when applied to entire populations.
Conclusions: Airway obstruction should be defined by FEV1/FVC and FEV1 being below the LLN using appropriate reference equations.
Statistics from Altmetric.com
Chronic obstructive pulmonary disease (COPD) is a major public health concern as a cause of chronic morbidity and mortality.1 COPD starts insidiously in adulthood causing a rapid decline in forced expiratory volume in 1 s (FEV1).2 Initially, airway obstruction was defined as a forced expiratory volume in 1 s/forced vital capacity (FEV1/FVC) ratio below the lower fifth percentile of a large healthy reference group (the statistically defined lower limit of normal (LLN)),3–5 a widely accepted standard for interpreting physiological and biochemical measurements6 (table 1).
The European Respiratory Society (ERS) modified this definition by expressing FEV1/FVC as a percentage of predicted.7 In an attempt to promote the early detection of chronic airway obstruction by applying a simple rule of thumb that did not require prediction equations and computer use, expert panels introduced a fixed cut-off for FEV1/FVC. In a 1987 American Thoracic Society (ATS) document, airway obstruction was considered to be present if FEV1/FVC was less than 0.75.8 In 1997, the British Thoracic Society (BTS) defined airway obstruction as an FEV1/FVC ratio less than 0.70, followed by the Global Initiative for Chronic Obstructive Lung Disease (GOLD), National Institute for Health and Clinical Excellence (NICE) and ATS/ERS COPD guidelines.1 9–11 The BTS and NICE guidelines define airway obstruction using the fixed ratio of 0.70 and an FEV1 below 80% predicted, while GOLD and ATS/ERS COPD guidelines only use the 0.70 fixed ratio (FEV1 can be in the normal range). The National Lung Health Education Program in the USA (NLHEP) interprets an FEV1/FVC (or FEV1/FEV6) and FEV1 below their respective LLN values as evidence of airway obstruction.12 In 2005, an ATS/ERS pulmonary function interpretation guideline strongly recommended the use of LLN for FEV1/VC to define airway obstruction.13
The fixed 0.70 cut-off has the potential to misdiagnose cases of airway obstruction because FEV1/FVC has been shown to vary with age, height and gender. In addition, no evidence has been published validating the concept that the 0.70 cut-off with a normal FEV1 (GOLD stage 1) identifies subjects with airway disease or COPD; in fact, doubt has been expressed as to whether GOLD stage I represents clinically relevant disease.14 Several reports have shown that using the fixed cut-off leads to underdiagnosis in young adults and overdiagnosis of airway obstruction in adults aged over 40 years15–24; however, these reports were limited because they applied single spirometry reference equations to single population samples. In contrast, the current study has investigated the prevalence of airway obstruction using three different geographical populations and a more thorough analysis than in previously published papers.15–24
The objectives of this study were
To review published equations for different ethnic groups for LLN for FEV1/FVC for healthy lifelong non-smokers, and compare LLNs to the 0.70 fixed cut-off.
To investigate whether the various criteria of airway obstruction lead to acceptable results when applied to the healthy subset of never-smoking, asymptomatic adults from three large population studies.
To determine differences in the prevalence of airway obstruction when applying three popular prediction equations for LLN for FEV1/FVC to all adults from the three population samples (including smokers and patients with asthma).
METHODS
Objective 1: LLN for FEV1/FVC according to worldwide literature
We retrieved from the literature 57 spirometry reference equations for FEV1/FVC for men and 55 for women, including previously unpublished equations derived from a large Dutch population based study (see the data supplement online). In some of these studies no equations were presented, but they could be derived from tables or graphs in the original publications. Details from all of the studies are available at www.spirxpert.com/GOLD.html.25 If the LLN was not stated for the studies, it was calculated by subtracting 1.645×residual standard deviation from the predicted mean (assuming a Gaussian distribution of the residuals). For each study we computed the age at which the LLN for FEV1/FVC fell below 0.70, at a standing height of 175 cm in men and 165 cm in women. In some this required extrapolation beyond the studied age range. If the LLN did not fall below 0.70 at a younger age than 80 years, we arbitrarily allocated it to age 80 years. We then computed the median ages at which the LLN for FEV1/FVC fell below 0.70.
Objective 2: prevalence of obstruction in healthy adults
We used the databases of all spirometry results from three large studies, the National Health and Nutrition Examination Survey (NHANES) III from the United States,26 the Health Survey for England 1995–1996 (HSE9596)20 and a longitudinal study of two Dutch populations,27 to investigate the proportions of healthy, asymptomatic, never smokers with airway obstruction according to several definitions (see table 1). The public NHANES III dataset used the ATS 1987 standards; JLH recalculated the values for the 1994 standards. Details of subject selection and methodology of the three studies have been extensively published. The healthy subset from NHANES III included 1706 men and 2924 women. The healthy subset from the HSE9596 study included 3107 men and 4195 women. For the purpose of this analysis, a cross section of the Dutch cohorts was created by selecting one record per person to obtain a relatively even age distribution of adults. Reference values for FEV1/FVC for the Dutch population (see the online data supplement for the equations) were derived from the healthy subset of 321 men and 883 women who were never smokers and who had been free of respiratory symptoms, as judged by answers to the Medical Research Council/European Community for Coal and Steel (ECCS) questionnaire administered by trained interviewers.28 No post-bronchodilator results were available in any of these three studies.
Objective 3: prevalence of obstruction in all adults
Using all subjects that were tested from these three databases (including smokers and those with respiratory symptoms), we calculated the prevalence of airway obstruction.
For each reference set, a true positive result, for the presence of airway obstruction, was defined when the FEV1/FVC was below the LLN, and a true negative when the FEV1/FVC was above or equal to the LLN. A false positive was defined when the FEV1/FVC was less than 0.70 but above or equal to the LLN, and a false negative when the FEV1/FVC was below the LLN and above or equal to 0.70.
This analysis was performed by computing the LLN using the regression equations appropriate for the three populations: Falaschetti and colleagues20 for HSE9596, Hankinson and colleagues for NHANESIII26 and the equations (see details in the online data supplement) for the Dutch data. As the ECCS/ERS prediction equations5 are widely used, particularly in Europe, they were additionally applied to the English, American and Dutch databases to gauge the effect of applying different prediction equations to the same data.
Statistical analyses
All analyses were performed using SPSS 14.0 for Windows (SPSS, Chicago, Illinois, USA). Percentiles in the Dutch study were estimated with quantile regression models (see online data supplement).
RESULTS
Objective 1: LLN for FEV1/FVC according to worldwide literature
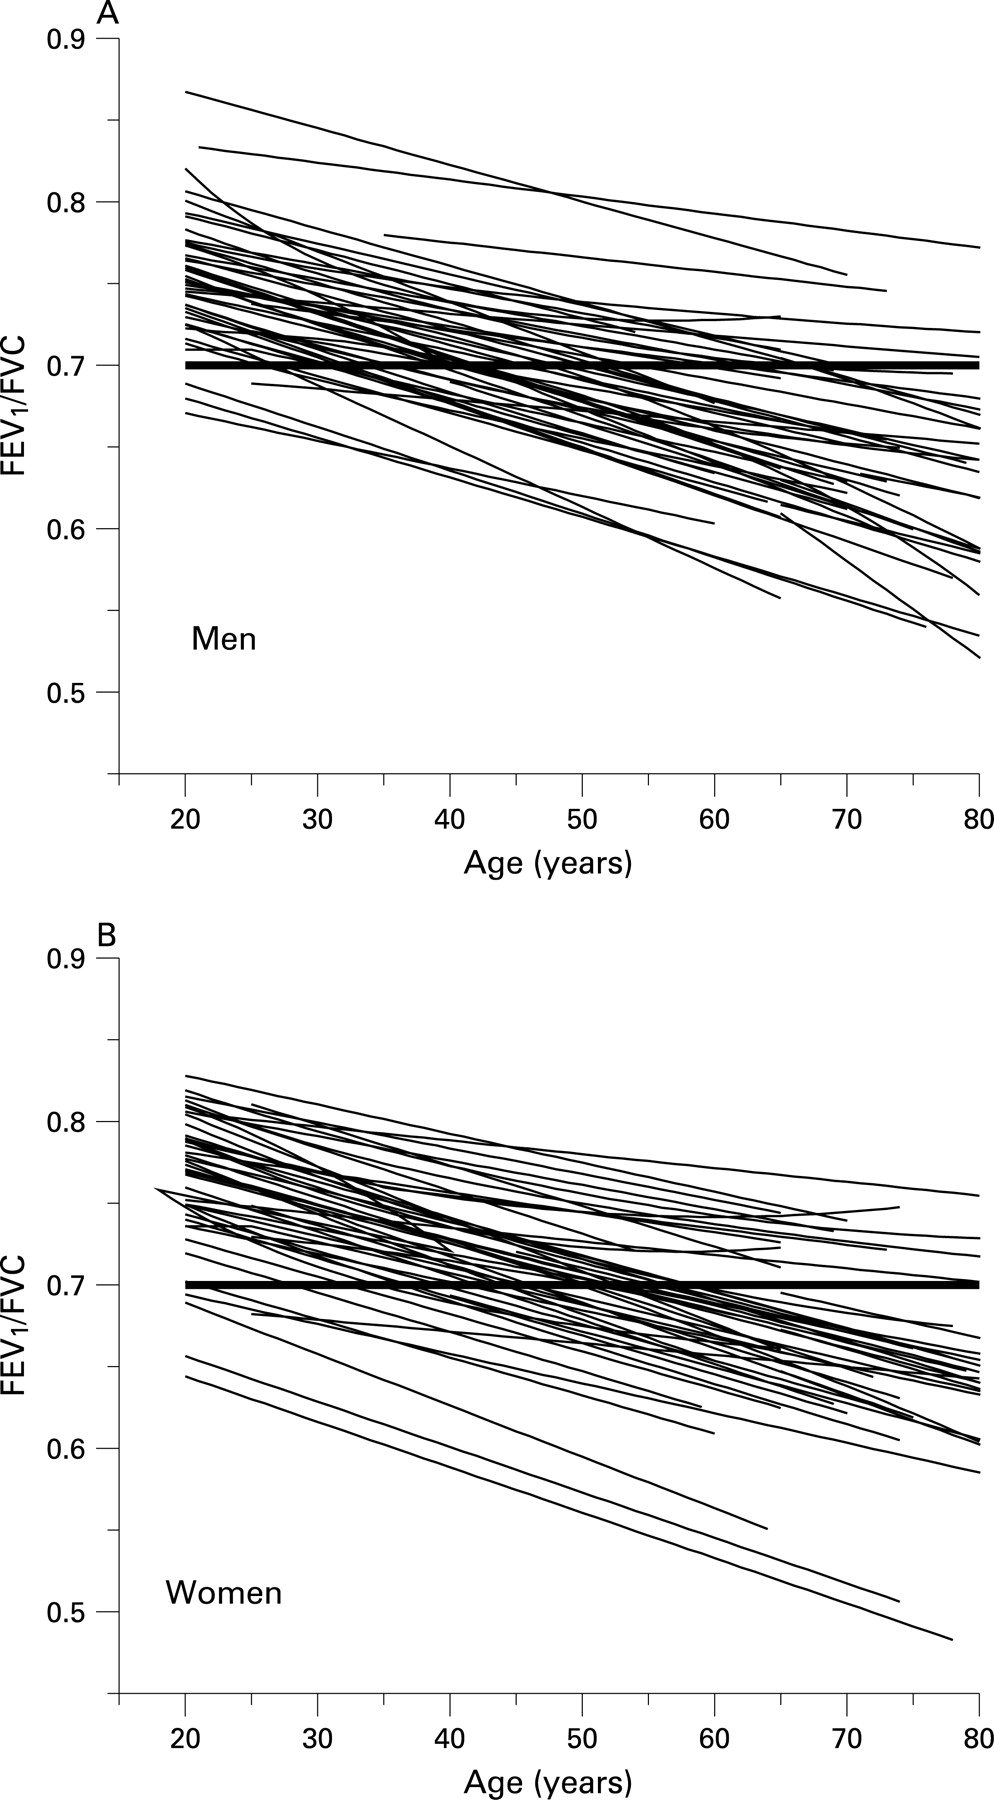
The LLN for FEV1/FVC varied widely between studies but invariably fell with age; it fell below 0.70 at various ages from all but five of the reference studies for adult men and for nine for women (fig 1). Standing height was also an independent predictor of FEV1/FVC in most studies (see the detailed results online25 or the online data supplement). In 57 prediction equations for FEV1/FVC for men and 55 for women, the LLN for FEV1/FVC was less than 0.70 at a median age of 42 and 48 years, respectively.
Objective 2: prevalence of obstruction in healthy adults
The proportion of subjects who had airway obstruction according to the 0.70 fixed cut-off was small in younger age groups, but increased up to values as high as 45% (male Dutch population) in those aged 60 years or more (fig 2). The percentages of healthy subjects deemed to have airway obstruction according to ERS, BTS and GOLD guidelines are shown in table 2.

Differences are, at least in part, a result of systematic differences in FEV1/FVC between populations. After accounting for age and height, FEV1/FVC in healthy Dutch women was, on average, 0.01 (confidence interval (CI) 0.004 to 0.016) below that of American women and 0.029 (CI 0.024 to 0.034) below that of English women; corresponding values for men were 0.011 (CI 0.002 to 0.020) and 0.024 (0.018 to 0.030), respectively.
In all three data sets, the 0.70 fixed cut-off resulted in an increase in the percentage of healthy subjects being labelled as having airway obstruction. Furthermore, the percentage of healthy subjects classified with obstruction increased with age (fig 2, table 2): 17–45% of healthy men and 7–26% of healthy women over 60 years of age. The prevalence of airway obstruction using the 0.70 fixed cut-point in the healthy Dutch population was systematically higher than in the other two populations.
The overall airway obstruction rate using the LLN was slightly higher than the expected 5% in the NHANES III data (5.5%) and in the HSE study of women (6.2%) (table 2). In Dutch males aged 50–69 years, the predicted value for LLN did not appear to fit very well, which may be because of the limited number of men (39) in this age range. The prevalence of airway obstruction also increased with age using the ERS criteria. The ERS LLN for FEV1/FVC (<88% of predicted for males and 89% of predicted for females) results in an increased prevalence of obstruction in all age groups, particularly in women. The BTS criteria differ from the GOLD guidelines in that not only must the FEV1/FVC be below 0.70, but FEV1 must also be less than 80% predicted. While an age related trend in the prevalence of airway obstruction was seen with the BTS criteria, it remained below 5%, except in older subjects.
Objective 3: prevalence of obstruction in all adults
We expressed the false positive results as a percentage of all positive test results (true positive plus false positive). This represented the percentage of subjects who were being diagnosed as having airway obstruction because their FEV1/FVC was below the fixed 0.70 cut-point, but above the LLN.
There was a steep increase with advancing age in the percentage of subjects who were erroneously identified as having airway obstruction (fig 3), reflecting the widening gap between the LLN and the 0.70 fixed cut-point (fig 1). The ascending lines run largely in parallel, demonstrating that the age dependency of the LLN differs little between the prediction equations. The USA data were shifted to the left by about 7 years compared with the English data; the Dutch data were shifted three decades to the left.

Applying ECCS/ERS reference values5 for the LLN for FEV1/FVC brought the English, American and Dutch data together (fig 3) because for the same age and gender there was no longer a difference in the predicted LLN, any remaining differences being related to differences in the distribution of age and male/female ratio in the different populations, and of course the true prevalence of airway obstruction. There was a 10–15 year shift of the curves to the left because the ECCS/ERS prediction equation led to a lower LLN for FEV1/FVC than equations from Falaschetti and colleagues20 in the English data and Hankinson and colleagues26 in the American data, but higher than the Dutch equations applied to the Dutch population.
Applying internal reference values to the Caucasian American, English and Dutch adults led to small differences in the overall prevalence of airway obstruction (table 3): 12% in The Netherlands, 14% in England and 16% in the USA. Except for the English population, these percentages were systematically smaller than those obtained by using the 0.70 fixed cut-off.
This was fortuitous because the false positive test results were balanced by the false negative ones in these wide age ranges. The level of FEV1/FVC was lower in the Dutch population than in the other populations, so applying the fixed cut-off nearly doubled the prevalence of airway obstruction in those above the age of 50 years, as did applying regression equations from Hankinson and colleagues26 and Falaschetti and colleagues.20 The English and Dutch populations did not have a sample of Black or Hispanic participants, so the comparisons in table 3 and fig 3 were only done for Caucasians. The predicted values for the English and American populations did not differ by much; hence their effect on the prevalence of airway obstruction in these populations was rather small. Adding the requirement for a low FEV1 (<80% predicted) (BTS and NICE) reduced the prevalence of airway obstruction by approximately half.
DISCUSSION
This study demonstrates the large differences in the prevalence of airway obstruction defined by spirometry that arise from using different definitions and/or prediction equations. These differences overlay variation in the true prevalence of airway obstruction between populations, and differences in the level of FEV1/FVC. However, when prediction equations are used that fit healthy lifelong non-smokers in the relevant population, there is fair agreement in the prevalence of airway obstruction, as demonstrated in this study using three large population samples (prevalence 12.3–15.5%, see table 3).
Large differences in the prevalence of airway obstruction caused by seemingly minor variants in defining airway obstruction were recognised many years ago29 and recently confirmed.15 16 23 30 31 The choice of these definitions should be dictated by an examination of evidence that demonstrates minimal disease misclassification in population based samples rather than a non-validated “rule of thumb”.16 While a fixed cut-off seems easy to apply, it comes at the expense of erroneous classification of disease.
Guidelines based only on the 0.70 fixed cut-off broaden the definition of COPD and cause a situation comparable with that documented recently for several other diseases, where changes in abnormality threshold values led to stunning increases in prevalence within the population.32 33 As shown in table 2 and fig 2, using a fixed cut-off for FEV1/FVC, a considerable proportion of healthy non-smokers become patients. The proportion of subjects over 50 years of age in a general population that is incorrectly identified as having airway obstruction is alarming, being as high as 68% (fig 3). Thus a declining FEV1/FVC, a normal phenomenon with advancing age, is equated to disease, without clinical evidence.
A limitation of our study is that post-bronchodilator values for FEV1/FVC were not obtained, as required by the GOLD guidelines. When applying GOLD guidelines in population based samples of adults, one-third of those with airway obstruction pre-bronchodilator did not have evidence of obstruction after a bronchodilator was administered.33 34 Hence the shortcomings of the use of a fixed ratio can only partly be remedied by bronchodilator effects. Indeed, the GOLD committee recently acknowledged that “Using the lower limit of normal (LLN) values for FEV1/FVC, that are based on the normal distribution and classify the bottom 5% of the healthy population as abnormal, is one way to minimise the potential misclassification”.1
The ATS/ERS, BTS, NICE and GOLD guidelines define airway obstruction for the purpose of diagnosing COPD (in patients with respiratory symptoms seeking help from physicians), but spirometry is also frequently used for detecting COPD by public screening outside of medical care settings, to include/exclude subjects for research, or for case finding in primary care offices. The high false positive rates reported in this study and others when following the current GOLD guidelines can be reduced by (1) only testing people with a high pre-test probability of COPD (as determined by using a short questionnaire)35; (2) using the statistical LLN for FEV1/FVC instead of the 0.70 fixed cut-off; (3) requiring that the FEV1 also be low (below the LLN) as recommended by NLHEP12 and akin to recommendations by BTS9 and NICE10; and (4) by confirming that airway obstruction persists after inhaling a bronchodilator.
Reference equations that provide predictive normal values for spirometric indices are necessary for meaningful clinical interpretation. The normal range for most physiological and biochemical variables is traditionally defined so that 5% of healthy subjects fall below the LLN, and this is entirely appropriate for the FEV1/FVC. Until there is evidence to the contrary, the LLNs should be derived from prediction equations that have been shown to fit the population being tested.13
Our current list of international spirometry reference studies for adults includes 57 publications; details of these studies as well as the reference equations can be found at www.spirxpert.com/GOLD.html in the help file associated with the Pulmonaria software,25 which may be freely downloaded. As can be seen by using the software, the LLN for FEV1/FVC varies not only by age, height and gender, but also by racial or ethnic group. Therefore, each country should carefully select the set of spirometry reference equations which best matches the methodology, ethnicity and age range of their population.
We need to be careful when identifying someone below an arbitrary cut-off as having COPD because the medical profession can offer limited help.36 While spirometry is an established test for diagnosing airway obstruction, it is not necessarily the only or the best tool available. An obvious limitation of spirometry is that it cannot identify disease at an early stage. Other (bio-)markers of disease are urgently needed.37
In conclusion, we recommend that spirometry for COPD case finding should only be done for patients with symptoms or prior exposure to noxious substances who therefore have a high pre-test probability of COPD. Airway obstruction should be defined by a post-bronchodilator FEV1/FVC and FEV1 below the LLN derived from appropriate reference equations (having taken into account age, height, gender and ethnicity). Defenders of a fixed ratio for FEV1/FVC claim that the simplicity of this measure overshadows its disadvantage. However, modern technology can easily provide the lower limit of normal, so why continue to accept false positive and negative lung function tests in the diagnosis of COPD?
REFERENCES
Supplementary materials
web only appendix 63/12/1046
Files in this Data Supplement:
Footnotes
▸ Supplementary reference values data are published online only at http://thorax.bmj.com/content/vol63/issue12
Competing interests: For 2 years, PLE has been paid by Pfizer, and PHQ has been paid by Novartis, for checking the quality of spirometry tests in drug intervention studies.