Article Text

Abstract
Background: Pulmonary rehabilitation can improve the functional capacity, but has a variable effect on the low fat-free mass (FFM) in patients with chronic obstructive pulmonary disease.
Hypothesis: Pulmonary rehabilitation would not affect catabolic drives such as systemic inflammation and also protein breakdown.
Methods: Patients (n = 40) were studied at the start of an 8-week in-patient pulmonary rehabilitation programme, at the end of the programme and 4 weeks later. FFM and functional capacity (quadriceps strength, handgrip strength and peak workload) were assessed. Pseudouridine (PSU) urinary excretion (cellular protein breakdown) and inflammatory status were determined. Healthy participants had a single baseline assessment (n = 18).
Results: PSU, (IL)-6 and soluble tumour necrosis factor (sTNF)α R75 were increased in patients compared with healthy participants, whereas FFM and functional capacity were reduced (all p<0.01). PSU was inversely related to both FFM and skeletal muscle function. FFM and functional parameters increased with rehabilitation, but PSU and inflammatory status were unaffected. The gain in FFM was lost 4 weeks after the completion of rehabilitation (p<0.01).
Conclusion: The anabolic effect of pulmonary rehabilitation improved FFM, but it did not reverse the increased protein breakdown or systemic inflammation. Thus, on cessation of pulmonary rehabilitation the FFM gains were lost owing to a loss of anabolic drive.
- BMI, body mass index
- COPD, chronic obstructive pulmonary disease
- FEV1, forced expiratory volume in 1 s, FFM, fat free mass
- FFMI, Fat-Free Mass Index
- GOLD, Global Initiative for Chronic Obstructive Lung Disease
- HPLC, high-performance liquid chromatography
- PSU, pseudouridine
- sTNF, soluble tumour necrosis factor
Statistics from Altmetric.com
- BMI, body mass index
- COPD, chronic obstructive pulmonary disease
- FEV1, forced expiratory volume in 1 s, FFM, fat free mass
- FFMI, Fat-Free Mass Index
- GOLD, Global Initiative for Chronic Obstructive Lung Disease
- HPLC, high-performance liquid chromatography
- PSU, pseudouridine
- sTNF, soluble tumour necrosis factor
Altered body composition, in particular the loss of fat-free mass (FFM) in chronic obstructive pulmonary disease (COPD), is associated with a worse prognosis, with increased mortality, morbidity and a poorer quality of life.1–3 The reduction in FFM is due to a change in the balance between anabolic and catabolic processes in favour of the latter. The enhanced catabolic state is likely to be secondary to systemic inflammation, which is accompanied by a switch to catabolic intermediary metabolism.4–6 This adds to the energy imbalance of energy costs being greater than energy intake. The effect on the FFM is likely to be enhanced proteolysis, leading to loss of mass and function in tissues such as skeletal muscle.
This metabolic imbalance leads to increased whole-body protein turnover, in which breakdown predominates over synthesis.7,8 Altered protein balance can be shown and quantified using isotopically labelled amino acids, but this is relatively invasive, expensive and difficult to apply to large study groups.7–9 Measurement of 5-ribosyl uracil (pseudouridine, PSU), a stable urinary metabolite of RNA, has been used as an index of cell-related protein breakdown.9–15 Increased PSU excretion occurs in patients with chronic inflammatory states associated with loss of normal body composition, such as in clinically stable COPD, cystic fibrosis and HIV infection.3,13–15
The effect of the reduction in FFM is the loss of protein-rich tissues, in particular the skeletal muscle. Loss of skeletal muscle mass, in association with changes in the intrinsic properties of skeletal muscle, is considered to be a factor in the impaired peripheral muscle function reported in COPD.16–19 Additionally, low FFM seems to be a factor in the genesis of bone thinning that is prevalent in the COPD population.3 Pulmonary rehabilitation, if it includes high-intensity muscle reconditioning improves skeletal muscle function, while also improving the morbidity and quality of life in COPD.20–25 In this format, pulmonary rehabilitation is an anabolic stimulus, but has variable effects on body composition, even when a nutritional intervention is included in the protocol. But, if weight gain is achieved during pulmonary rehabilitation, then there might be an improvement in survival.26–30
We hypothesised that increased protein breakdown, as indicated by PSU excretion, would be related to a low FFM and a reduction in skeletal muscle function. Additionally, that an 8-week pulmonary rehabilitation programme would improve body composition owing to its pro-anabolic effect, but would be unlikely to reverse the increased breakdown of protein or ameliorate systemic inflammation, and any metabolic benefits would be short lived once the rehabilitation programme ceased owing to the unopposed background catabolic state and reduction in physical activity.
METHOD
Participants
Forty patients with COPD (Global Initiative for Chronic Obstructive Lung Disease (GOLD) stage II–IV) were consecutively recruited at the start of an 8-week inpatient pulmonary rehabilitation programme while clinically stable at the Asthma Centre, Hornerheide, The Netherlands.31,32 Exclusion criteria included any malignancy, malabsorptive, metabolic or endocrine diseases, or other systemic inflammatory disease. Eighteen healthy Dutch volunteers, matched for sex and age, were recruited by an advertisement in a local newspaper for comparison of baseline parameters. The ethical review board of the University Hospital Maastricht, Maastricht, The Netherlands, approved the study and all participants gave written informed consent.
Pulmonary rehabilitation
The 8-week inpatient pulmonary rehabilitation programme consisted of both physical and educational components relating to COPD and its management.28 Five days a week, a combined endurance and strength exercise training was followed, consisting of 20 min (twice a day) of submaximal cycle ergometry, 20 min of treadmill exercise, 30 min of gymnastics and one session of unsupported arm exercise training (10×1 min of exercise, interspersed with 1 min of rest). The submaximal cycle ergometry was started at 50% of peak workload, but exercise intensity was increased as they progressed, under the supervision of an exercise physiotherapist. During the rehabilitation programme, patients received maintenance respiratory drugs. Liquid nutritional supplementation (Respifor, Nutricia, Zeetermeer, The Netherlands) was given three times daily (total 564 kcal/day) to patients (n = 20) who had either a low FFM index (FFMI), with recent weight loss (>5% body weight in preceding 3 months or >10% in 6 months) or with a low body mass index (BMI; weight (kg)/height2 (m2); <21 kg/m2). Nutritional supplementation was continued on completion of the rehabilitation programme in these patients.
The following parameters were determined at baseline and after 8 weeks of rehabilitation.
Lung function
The forced expiratory volume in 1 s (FEV1), forced vital capacity (FVC) and their ratio (FEV1/FVC) were assessed using a spirometer (Masterlab, Jaeger, Würzburg, Germany) at baseline and in patients postbronchodilator (15 min after inhalation of β-agonists via a metered-dose inhaler). Patients were classified according to the GOLD criteria.32
Urinary sampling and PSU analysis
A fasting spot urinary sample was collected early morning, before exercise. PSU and creatinine were measured simultaneously by high-performance liquid chromatography (HPLC) using a Hypersil ODS column, pH 6.1, flow rate 1 ml/min, at room temperature.33 Peaks were detected by a spectrophotometric detector set to λ260 nm, with a retention time of approximately 4.5 min for PSU and 6 min for creatinine. Standard PSU (PYA11080, Berry & Associates, Dexter, MI, USA) and creatinine (C480, Sigma, St Louis, MO, USA) in HPLC grade water were used for standard curves from 0.6 to 80 μmol and 0.033 to 4.4 mmol, respectively. The sample urine (1 ml) was filtered through an Acrodisc (13 mm diameter, 0.45 μm pore size) and diluted 1:20 with HPLC grade water before analysis and concentrations for each sample derived from the standard curves. All samples were analysed in duplicate.
PSU was standardised for creatinine concentration to allow for dilutional effect (µmol/mmol creatinine). In addition, when assessing the relationship of muscle function to PSU, to allow for the differences in the actively metabolising FFM, PSU was also expressed as a ratio to FFM: PSU/FFM (µmol/mmol creatinine/kg FFM).3,15
Body composition
Height and weight were measured to determine BMI. FFM was measured using single-frequency (50 kHz) bioelectrical impedance analysis (BIA, Xitron Technologies, San Diego, California, USA), with participants in a supine position. Using the COPD-specific equation, the FFM was determined and from this, a height-squared FFMI was calculated.34 A low FFMI was classified as an FFMI <15 kg/m2 (women) and <16 kg/m2 (men).16
Blood sampling
Interleukin (IL)6 and tumour necrosis factor (TNF)α (Quantikine, R&D Systems, Minnesota, USA) were determined using ELISA from a fasting venous blood sample before exercise with a lower detection of 0.039 pg/ml for IL6 and 0.5 pg/ml for total TNFα. Soluble TNF (sTNF) receptor 55 and sTNF receptor 75 were measured using ELISA, as described previously.35
Functional capacity
Bicycle ergometry test
Using an electromagnetic braked ergometer (Corival 400, Lode, Groningen, The Netherlands), incremental ergometry to investigate the maximal exercise capacity was performed. After 2 min of resting followed by 1 min of unloaded cycling, the power was increased every minute by 10 W,36 and peak workload was determined.
Skeletal muscle strength
Isokinetic quadriceps strength of the dominant leg of the patients was measured using a Biodex dynamometer (Biodex Corporation, Shirley, New York, USA).29 The highest peak torque from 15 successive volitional maximal contractions at an angular velocity of 90°/s was recorded. Skeletal muscle function of the upper limb was assessed using the mean of three measurements on the Harpenden handgrip dynamometer (Yamar, Preston, Jackson, Michigan, USA.).28 All measures were made after familiarisation to prevent any learning effect.
Measurements of plasma cytokines, body composition and urinary PSU, but not muscle function, were also repeated at 12 weeks (4 weeks after the completion of rehabilitation).
Statistics
Data analysis was performed by SPSS V.11.0 for Windows. Results are the geometric (for non-normally distributed data such as PSU and the inflammatory mediators) or arithmetric mean and standard deviation (SD). Analyses included the χ2 test, independent t test, paired t test, one-way analysis of variance with a retrospctive Tukey’s test and Pearson’s correlation. Parameters such as PSU are log10 transformed in order to convert to normally distributed data and subsequently perform the parametric Pearson’s correlation; p<0.05 was considered significant.
RESULTS
Comparisons between the whole patient group and healthy participants
Functional and nutritional assessment
Of the 40 patients, 29 were male, and 14 of 18 healthy participants were male; χ2 test, p>0.05. The mean (SD) age was 62.1 (8.7) years and their FEV1 1 (0.43) l, with 36.7 (15.6)% predicted. The distribution of patients according to the GOLD classification was: stage II, 10; stage III, 11; and stage IV, 19. A total of 20 patients had a low FFMI and 20 a normal FFMI. In the healthy subjects, FEV1 was 3.26 (0.58) l, 106.3 (16.4)% predicted and the mean (SD) age was 60.9 (3.5) years. Eight patients were receiving long-term low-dose oral corticosteroids. Other drugs included inhaled corticosteroids (n = 30), oral theophyllines (n = 15) and mucolytics (n = 24), and most were taking either β2 agonists or ipratropium bromide.
Excretion of PSU was greater in patients, 44.48 (1.35) μmol/mmol creatinine, than in healthy participants, 35.89 (1.19) μmol/mmol, p<0.001 (table 1). BMI and FFM were greater in healthy participants than in patients, both p<0.001 (table 1). Log10 PSU and FFM were inversely related in the patients group (r = −0.462, p = 0.003), but not in healthy participants (r = −0.429, p = 0.08; fig 1). There were no differences in the PSU, p = 0.8, or PSU/FFM, p = 0.7, between the subgroups of patients on the basis of their GOLD stage, and neither log10 PSU or log10 PSU/FFM were related to FEV1 (l or % predicted; data not shown).
Baseline body composition, pseudouridine, functional status and inflammatory status of the participants

Relationship of fat-free mass (FFM) to log10 pseudouridine (PSU) in participants at baseline. COPD, chronic obstructive pulmonary disease.
Handgrip, quadriceps muscle force and maximum peak workload were reduced in the patients (table 1). The log10 PSU/FFM was related to quadriceps strength (r = −0.771, p<0.001; fig 2), handgrip force (r = −0.654, p<0.001) and peak workload (r = −0.358, p = 0.02), in the patient group. In addition, log10 PSU was related to quadriceps strength (r = −0.706, p<0.001), handgrip force (r = −0.515, p = 0.001) and peak workload (r = −0.313, p = 0.042). Similar patterns of log10 PSU/FFM and functional status were seen in healthy participants (r = −0.656, −0.82, −0.624 respectively, all p<0.01).

Relationship of quadriceps strength to log10 pseudouridine (PSU)/fat free mass (FFM) in all participants at baseline. COPD, chronic obstructive pulmonary disease.
IL6 and sTNFα R75 were greater in patients than in healthy participants, and TNFα and sTNFα R55 were not different (table 1).
Effect of pulmonary rehabilitation
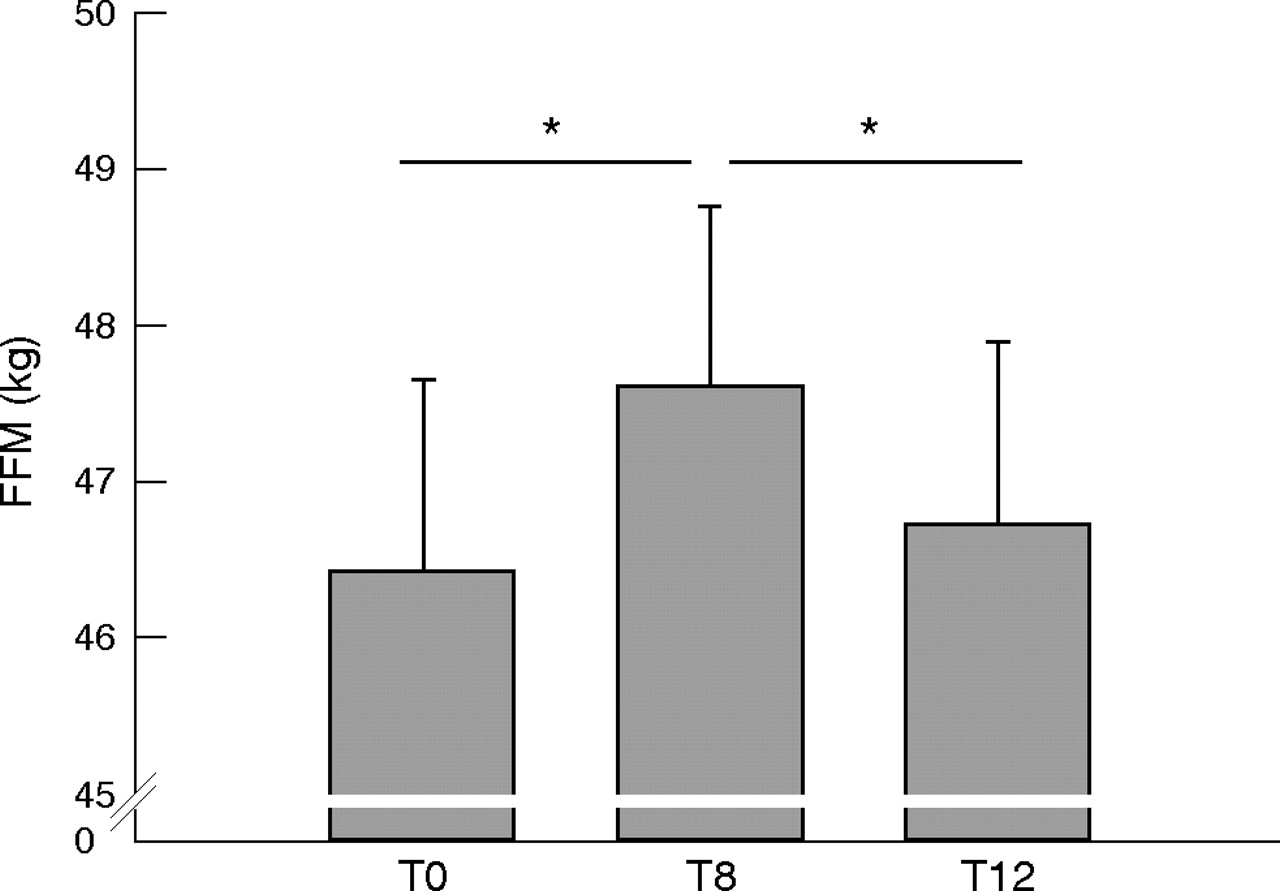
After 8 weeks of rehabilitation, FFM increased by 1.1 kg, from 46 (7.7) to 47.1 (7.4) kg; p = 0.003. This change occurred predominantly in the low FFMI group, from 41 (5) to 42.6 (5.4) kg; p = 0.002, compared with the normal FFMI group increase from 51 (6.6) to 51.5 (6.6) kg; p = 0.3. The excretion of PSU was unaffected by rehabilitation start: 44.48 (1.35) µmol/mmol creatinine (end: 43.35 (1.28; as was the PSU/FFM—0.98) (1.5) µmol/mmol creatinine/kg FFM to 0.93(1.39) in the whole patient group. No difference in PSU or PSU/FFM occurred in the two FFMI subgroups when analysed separately.
The gain in FFM at the end of pulmonary rehabilitation was lost 4 weeks later: end of rehabilitation (47.6 (7.2) kg) to 4 weeks later: (46.7 (7.1) kg) p = 0.003, n = 38 (fig 3). The loss was seen in both the low FFMI and normal FFMI groups of patients. Neither PSU nor PSU/FFM changed between the end of rehabilitation and 4 weeks later: PSU 41.98 (1.27) µmol/mmol creatinine at end of rehabilitation to 45.19 (1.36) µmol/mmol creatinine 4 weeks later (p = 0.249); PSU/FFM: 0.9 (1.37) µmol/mmol creatinine/kg FFM end of rehabilitation to 0.98 (1.49) µmol/mmol creatinine/kg FFM 4 weeks later (p = 0.133). There was also no difference in FFM, PSU or PSU/FFM 4 weeks after rehabilitation compared with pre-rehabilitation values. There were two patients who did not complete the 4 week post-rehabilitation assessment as they declined further assessments.
Fat-free mass (FFM) in the 38 patients who completed the three visits. *p<0.05.
Fat mass increased significantly with rehabilitation, from 18.8 (7.1) to 19.4 (6.1) kg; p = 0.041. There was a further significant increase in fat mass during the 4 weeks after rehabilitation to 20.3 (6.1) kg; p = 0.008. BMI improved during rehabilitation to 23.1 (3.2) kg/m2; (p<0.001) and was similar at 4 weeks after rehabilitation (23.1 (3.2) kg/m2).
Both quadriceps strength (77.19 (36.27) to 88.91 (32.51) Nm; p = 0.018) and peak work load (61.3 (25.21), 71.25 (32.79) W; p<0.001) increased in the patients after the rehabilitation programme. Handgrip force tended to improve (33.72 (9.58) to 34.63 (9.61) kg; p = 0.057). Quadriceps and peak workload improved in the patients with a low FFMI, while only peak workload improved in the patients with a normal FFMI. The changes in markers of muscle function were not reflected by any change in PSU (Pearson’s correlation, p>0.05).
Fifteen patients had an exacerbation of respiratory symptoms requiring either oral corticosteroids, antibiotics or both, during the 8-week period. There was no difference in the baseline or the change over the 8 weeks in PSU, circulating inflammatory mediators, FFM or muscle function in those who exacerbated and those who did not.
There was no change in the levels of any of the circulating inflammatory mediators with the rehabilitation programme—IL6, TNFα, sTNFα R55 and sTNFα R75 (all p>0.05), and hence were not related to change in FFM. At all time points, both IL6 and sTNFα R75 in the patients were significantly greater than the health participants results.
DISCUSSION
Increased cellular protein breakdown, measured as PSU excretion, was inversely related to FFM and impaired skeletal muscle function in the upper and lower limb and reduced exercise capacity in patients with COPD regardless of the severity of lung disease. Pulmonary rehabilitation resulted in improvements in skeletal muscle function and exercise capacity, and a short-term increase in FFM, but no reduction occurred in the increased cellular protein breakdown or in the mediators of systemic inflammation.
Loss of peripheral muscle function in COPD is probably multifactorial in origin, but two key features are the loss of muscle mass and changes in muscle biochemistry.16–19 Controversy remains regarding the importance of each factor, but loss of muscle mass has been related to a reduction in quality of life, exercise capacity and survival.1,2,16 In our patients, there was a direct relationship between FFM and skeletal muscle function at the start of rehabilitation, whereas the inverse relationship between PSU, and both FFM and skeletal muscle function suggests a potential mechanistic link between enhanced cellular protein breakdown, loss of FFM and impaired skeletal muscle function. Supporting the relevance of such a link is the similar relationship between PSU and skeletal muscle function in the healthy participants, but at a far lower level of protein breakdown, which may represent the physiological relationship between protein turnover and skeletal muscle function in health.
Although PSU excretion is widely accepted to indicate cellular protein breakdown, it only provides information on one component of the normally balanced dynamic process of protein turnover, which comprises synthesis and breakdown.7,8 The interpretation of the lack of change from preintervention values in PSU excretion after 8 weeks of pulmonary rehabilitation and 4 weeks later, needs to be considered with caution. It suggests that the level of cellular protein breakdown was unchanged, although there was an increase in total FFM between the beginning and end of pulmonary rehabilitation, with a subsequent reduction in FFM to preintervention levels 4 weeks after the end of pulmonary rehabilitation.
The pulmonary rehabilitation programme used was of moderate to high intensity and incorporated both endurance and strength training for skeletal muscle, which act as an anabolic stimulus and might be expected to reduce cellular protein breakdown if enhanced proteolysis was purely due to physical deconditioning. As shown by the persistently increased mediators of systemic inflammation and PSU, there was no modification of the protein catabolic state in our patients during the rehabilitation programme, although protein synthesis may have been augmented by the pro-anabolic effect of muscle reconditioning and nutritional supplementation during pulmonary rehabilitation, leading to improvements in skeletal muscle mass and function. This pro-anabolic stimulus would have been lost after the cessation of pulmonary rehabilitation when patients may have returned to their usual levels of physical activity, which in the presence of a continued high level of protein breakdown led to the fall in the FFM we recorded. However, this interpretation remains speculative as we did not measure the rate of protein synthesis and hence turnover.
In COPD, the protein catabolic state is probably driven by factors other than just the normal homoeostatic balance between synthesis and breakdown, including sustained systemic inflammation, which was not attenuated by the pulmonary rehabilitation programme described here, and changes in the balance of pro-anabolic to pro-catabolic hormones, as well as the effects of progressive pulmonary disease.3,6,37,38 Thus, persistent systemic inflammation and increased excretion of PSU may partly explain the loss of the FFM gain 4 weeks after the cessation of the rehabilitation programme, when any pro-anabolic stimulus was removed. These data indicate continuous increased protein breakdown in COPD, which is similar to the reports in cystic fibrosis, which could confound the long-term effects of pulmonary rehabilitation on FFM.15
The determination of body composition showed both a gain in FFM during rehabilitation and a progressive gain in fat mass throughout the study period. The loss of FFM after the rehabilitation programme ended was blinded by the unchanged BMI, which was maintained because of the further fat mass gain in the post-rehabilitation period. The loss of FFM represents preferential loss of this tissue compared with maintenance of fat mass as reported in COPD previously.1–3 The sustained increase in fat mass may represent the continued nutritional aspects of the rehabilitation programme, and emphasises the need to determine the nature of body composition change, not only BMI, during interventions such as pulmonary rehabilitation.
Systemic inflammation has been repeatedly shown in patients with stable COPD and was reconfirmed in this study.3,6,37,38 Despite the view that inflammation is a factor in the catabolic drive in COPD, we did not find a relationship between the systemic inflammatory mediators and PSU. This could be due to a low power for this study to detect this relationship, although the study was adequately powered to detect a 10% change in PSU (power 0.8, significance 0.05). Alternatively, the cascade nature of the cytokines and their synergistic interplay, or the fact that cytokines produced in skeletal muscle may be more closely related to muscle protein breakdown than circulating levels, may be independent factors.39 Our finding emphasises the unclear relationship between systemic inflammation and the catabolic state in COPD, which seems less clear-cut than in cystic fibrosis or chronic heart failure.15,40
Limitations of the study
The use of PSU to assess protein breakdown could be criticised because it has not been specifically validated against protein turnover in COPD, although changes in PSU were closely related to amino acid turnover in children receiving growth hormone treatment.9 In rheumatoid arthritis and lung cancer, changes in PSU have followed intervention and have paralleled clinical responses.13,41 However, determination of PSU excretion has the advantages that it is neither metabolised further nor reused by the body, can be applied to a large population, and unlike other non-invasive measures such as 3-methylhistidine, does not require dietary limitations, which make it impractical for clinical studies where dietary restriction would be counterproductive or unethical.10–12 Similarly, there was no control group to this study as we thought it was unethical to withhold pulmonary rehabilitation to patients who had been deemed to benefit from this proved treatment option. A small number were receiving oral corticosteroids, which is likely to diminish peripheral muscle function benefit from rehabilitation, as well as alter body composition. However, this mix of patients is typical of a pulmonary rehabilitation programme for this severity of COPD.
In summary, in patients with COPD undergoing pulmonary rehabilitation, we determined direct relationships between FFM and skeletal muscle function, and indirect relationships between both measures and PSU, an indicator of cellular protein breakdown. The pro-anabolic stimulus of this pulmonary rehabilitation programme improved skeletal muscle function and increased the FFM, although the effect on FFM was short lived. This is possibly because of the unopposed persisting catabolic elements of cellular protein breakdown or systemic inflammation that are not attenuated by pulmonary rehabilitation. The need to consider long-term changes in health lifestyle is highlighted in this study and encourages future research to identify the optimal components of a rehabilitation programme to achieve and maintain muscle mass and function.
REFERENCES
Footnotes
-
↵* These authors contributed equally to this work.
-
Published Online First 23 August 2006
-
Funding: This study was supported by the British Lung Foundation (P01/7), GlaxoSmithKline (UK/NL), AstraZeneca (UK), Numico Research (The Netherlands), Capricorn (funded by Welsh Assembly Government) and European Union Grant QLK6-CT-2002-02285.
-
Competing interests: DJS has received research grants from AstraZeneca and GlaxoSmithKline. AMWJS has received research grants from GlaxoSmithkline and Numico Research. EFMW serves as a consultant to GlaxoSmithKline (GSK) and is a member of the scientific advisory board for GSK. He received lecture fees and research grants between 2001 and 2004 from GSK.
-
Written informed consent was obtained from all subjects, and the ethical review board of the University Hospital Maastricht approved the study.