Article Text

Abstract
Background: Computed tomographic (CT) scanning may enable earlier diagnosis of chronic lung allograft dysfunction than forced expiratory volume in 1 second (FEV1). A study was undertaken to determine intra-observer and inter-observer agreement of composite and air trapping CT scores, to examine the association of FEV1 with the composite and air trapping CT score, and to relate the baseline composite CT score to changes in FEV1 and changes in the composite CT score over 1 year.
Methods: Lung function and baseline CT scans following transplantation and at subsequent annual follow ups were analysed in 38 lung transplant recipients. Scans were randomly scored by two observers for bronchiectasis, mucus plugging, airway wall thickening, consolidation, mosaic pattern, and air trapping, and re-scored after 1 month. CT scores were expressed on a scale of 0–100 and correlated with FEV1 as a percentage of the post-transplant baseline value.
Results: The mean (SD) interval between baseline and follow up CT scans was 11.2 (4.7) months. Inter-observer and intra-observer agreement was good for both the composite and air trapping CT scores. There was a significant association between FEV1 and the composite CT score, with each unit of worsening in the baseline composite CT score predicting a 1.55% and 1.37% worsening in FEV1 over the following year (p<0.0001) and a 1.25 and 1.12 unit worsening in the composite CT score (p<0.0001) for observers 1 and 2, respectively.
Conclusion: These findings indicate a potential role for a composite CT scoring system in the early detection of bronchiolitis obliterans.
- BO, bronchiolitis obliterans
- BOS, bronchiolitis obliterans syndrome
- CT, computed tomography
- FEV1, forced expiratory volume in 1 second
- computed tomography
- lung function
- bronchiolitis obliterans
- lung transplantation
Statistics from Altmetric.com
- BO, bronchiolitis obliterans
- BOS, bronchiolitis obliterans syndrome
- CT, computed tomography
- FEV1, forced expiratory volume in 1 second
Long term survival after lung transplantation is limited by the development of chronic allograft dysfunction which manifests as bronchiolitis obliterans (BO). BO consists of heterogeneously distributed areas of obliterated respiratory and terminal bronchioles that lead ultimately to a decline in forced expiratory volume in 1 second (FEV1), graft failure and recipient death.1–4 It is thought that earlier diagnosis and more timely treatment of BO could improve long term survival;1–3,5,6 however, the heterogeneous distribution of BO within the transplanted lungs renders invasive diagnosis by transbronchial biopsy unreliable, with reported sensitivities as low as 17–28%.3,7,8 In an attempt to identify BO earlier, a functional surrogate for this structural abnormality—bronchiolitis obliterans syndrome (BOS)—has been defined as a progressive decline in FEV1.9 Unfortunately, identifying patients using BOS criteria still may not identify subjects early enough in the development of airflow limitation due to the distribution of the BO process. Investigators have recently turned their attention to computed tomographic (CT) scoring systems because it is thought that direct evaluation of anatomical markers may allow earlier detection of BO than indirect measurements such as FEV1.
There are, however, limitations to CT scoring systems, predominately due to sensitivity and specificity for disease progression as well as the high inter-observer and intra-observer variability of the score itself. For example, it has been suggested that air trapping is the most sensitive and specific CT abnormality for the early detection of BOS10–14 while exhibiting the highest inter-observer agreement.14–16 However, more recent work has not always confirmed these findings17 and there is no consensus on how to score air trapping. For example, Bankier et al evaluate gas trapping as 0–20%, 20–40%, 40–60%, 60–80% or 80–100% of the lobe involved,14,16 while Siegel et al score the lobes as 0%, 1–25%, 26–50%, 51–75%, and 76–100%.13 Furthermore, scores for mosaic pattern of attenuation, airway wall thickening, and bronchiectasis are individually less sensitive and specific than scores for air trapping,10–14,17 and the intra- and inter-observer agreement individual scores for bronchiectasis, airway wall thickening, and mosaic pattern have not been evaluated in lung transplant recipients. Therefore, given the variety of CT abnormalities seen in BO/BOS, it may be that a composite CT score (CTBO score) will be more sensitive and specific than a CT air trapping score (CTAT score) alone for the early detection of BO.
The aims of the present study were (1) to determine the intra- and inter-observer agreement of a CTBO score and a CTAT score, (2) to determine the cross sectional relationship between the CTBO score and CTAT score with FEV1, and (3) to relate the CTBO score at baseline to changes in FEV1 and changes in the CTBO score over the course of 1 year. Our hypotheses were that (1) the CTBO and CTAT scores would show significant associations with FEV1 in lung transplant recipients and (2) the CTBO score at baseline would predict changes in FEV1 and changes in the CTBO score over the course of 1 year.
METHODS
Subjects
The baseline CT scan (first scan following transplantation) and the first annual surveillance CT (follow up) scan of 38 consecutive subjects who received a single or double lung transplant at our centre since 2000 were studied. CT scans were excluded when performed for the diagnosis of acute clinical events, when there were incidental CT findings of acute disease (such as pneumonia), or when the recipient had coincident clinical or bronchoscopic evidence of an acute event (acute rejection, infection). We did not routinely perform bronchial provocation testing on our lung transplant recipients. None of the subjects included in the study had clinical manifestations of asthma after transplantation and none had significant bronchodilator responses according to ATS criteria on spirometry. The study was approved by the clinical ethics review board of the University of British Columbia.
CT scans
All CT scans were performed on a GE Lightspeed Ultra scanner (General Electric Medical System, Milwaukee, WI, USA). Inspiratory images were acquired at suspended inspiration from lung apex to base using 1.25 mm slice thickness at 10 mm intervals. Expiratory 1.25 mm thick images were acquired at end of exhalation at the level of the aortic arch, the carina and 2 cm above the hemidiaphram. Images were acquired using 150 mA, 120 kVp, 1 second scan time, reconstructed using a high spatial frequency algorithm (“Bone”) and an appropriate field of view. For the first part of the study each baseline CT scan was assigned a random identification number, blinded for patient characteristics and reviewed using a medical imaging workstation (Leonardo Workstation, Siemens AG Medical Solutions, Erlangen, Germany). For the second part of the study each pair of baseline plus follow up scans was assigned another random identification number, blinded for patient characteristics and reviewed as per baseline.
Spirometric tests
Spirometric tests were performed according to ATS guidelines.18 For the purposes of this study, FEV1 was expressed as a percentage of the average of the two best FEV1 values obtained after lung transplantation.9 BOS was defined according to the International Society of Heart and Lung Transplantion guidelines with BOS stage 0 as FEV1 >80% post-transplant baseline value and stages 1, 2 and 3 equivalent to FEV1 66–80%, 51–65%, and <50% post-transplant baseline, respectively.9
CT scoring
To establish the CT scoring system, two observers (PAJ, JDD) independently scored the baseline CT scans in a random and blinded fashion. To test for intra-observer variation, one observer re-scored all baseline CT scans after 1 month.
Our CT scoring system is presented in table 1 and illustrative examples are shown in fig 1. The CT scans were viewed using display settings of window, −500 Hounsfield Units (HU) and level, 1500 HU. Inspiratory scans were evaluated for severity and extent of central and peripheral bronchiectasis; extent of central and peripheral mucus plugging; severity and extent of central and peripheral airway wall thickening; extent of consolidation; and extent of mosaic pattern. Expiratory scans were evaluated for the extent of air trapping. Each of the five lobes (including the lingula as a sixth “lobe”) was evaluated separately using the inspiratory CT image while six lung zones (upper, middle, lower left and right) were scored using the expiratory images. In single lung transplant recipients, only the lobes of the transplanted lung were scored.
CTBO scoring system for one lobe*

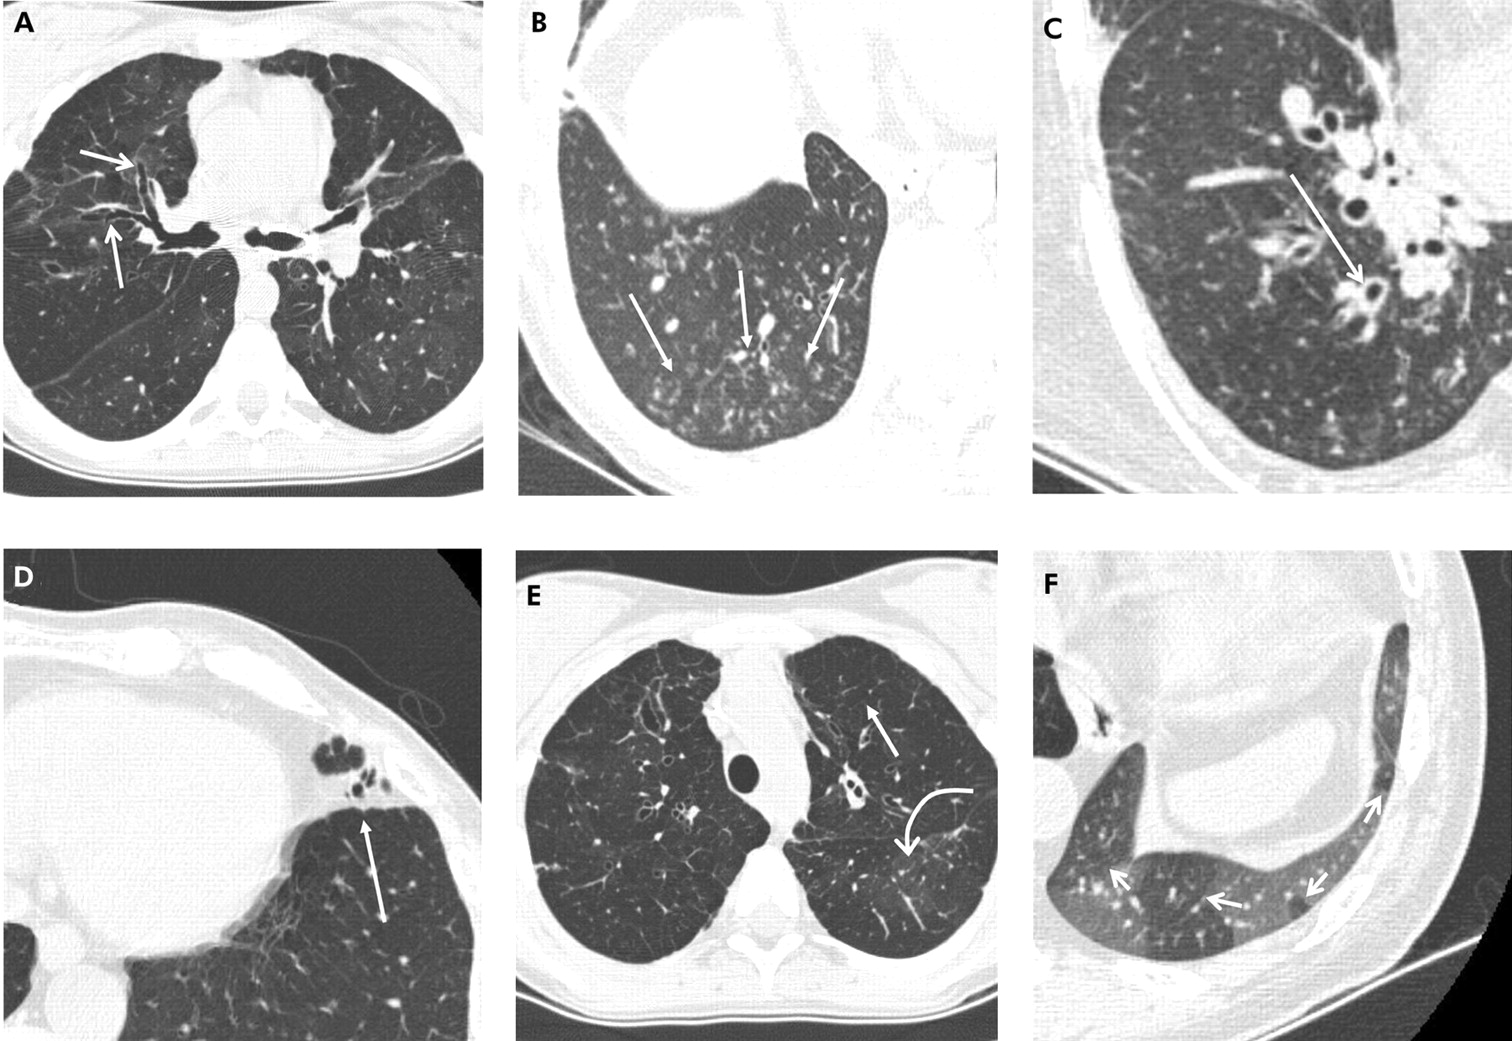
Representative CT images showing the CTBO scoring system abnormalities. A collection of transaxial 1.25 mm CT sections in different patients viewed at lung window and level setting (width 1500 HU, level −500 HU) showing (A) bronchiectasis (arrows) identified by the absence of normal bronchial diameter tapering; (B) peripheral mucus plugging shown as multiple centrilobular nodules (arrows); (C) dilated bronchus with associated wall thickening (arrow); (D) lingular consolidation (arrow) shown as an area of increased density obscuring the underlying pulmonary vasculature; (E) generalised mosaic pattern in both upper lobes shown by areas of decreased attenuation and vessel size (straight arrow) compared with regions of normal attenuation and normal vessel size (curved arrow); and (F) expiratory image showing areas of air trapping (arrows).
Abnormalities were defined according to recommendations of the nomenclature committee of the Fleischner Society. To score peripheral bronchiectasis and airway wall thickening, “peripheral” was defined as less than 2 cm from the costal and diaphragmatic pleura. Visible airways abutting the mediastinal pleura were scored as bronchiectasis. Peripheral mucus plugging was evaluated using the radiological appearance of “centrilobular nodules” or “tree-in-bud” pattern rather than using a peripheral location. Central mucus plugging was scored if mucus was seen in identifiable bronchi. Mild airway wall thickening was defined as an airway wall thickness greater than 2 mm in the hilum, 1 mm in the central, and 0.5 mm in the peripheral lung. Mild bronchiectasis was defined as a bronchial lumen diameter greater than the diameter of the adjacent pulmonary artery or as a lack of tapering between bronchial generations.
Scores for bronchiectasis, mucus plugging, airway wall thickening, air trapping, and a composite CTBO score were calculated in a similar manner to Brody et al.19 In brief, for each lobe a bronchiectasis score, mucus plugging score, and airway wall thickening score were calculated by combining the abnormalities and severity of the abnormalities in the central and peripheral lung. Next, the lobe scores for bronchiectasis, mucus plugging, airway wall thickening, consolidation, mosaic pattern, and air trapping were summed to produce a total maximum of 108, 54, 36, 18, 18 and 18, respectively. The composite score was calculated by adding the component scores together for a total maximum of 252. The maximum total scores and maximum component scores were expressed on a scale of 0–100 for statistical analysis.
For the second part of the study, after 3 months the baseline CT scans were combined with the follow up CT scans, randomised, and scored using the above scoring system to assess the predictive value of the scoring system for disease progression. The readers did not have information as to which were baseline scans and which were follow up scans. The scores from this reading were also used to evaluate the intra-observer agreement.
Statistical analysis
Intra-observer and inter-observer agreement of scores for CT components, CTAT score, and CTBO score were calculated using intraclass correlation coefficients. An intraclass correlation coefficient of more than 0.8 represents good agreement.
Linear regression was used to model the association between CT score and FEV1 measured at baseline. The regression analysis was conducted for the CTBO score and the CTAT score and for each observer separately. The regression coefficient was a measure of association, showing the mean decrease in CT score for every additional percentage change in FEV1. The analysis was repeated for follow up measurements and was conducted for observers 1 and 2 separately. The linear regression was also used to model the association between the baseline CTBO score and FEV1 at follow up and the baseline CTBO score and CTBO score at follow up. Finally, the linear regression was used to model the association between the baseline CTAT score and FEV1 at follow up and the baseline CTAT score and CTAT score at follow up. The analysis was conducted for observers 1 and 2 separately.
A p value of <0.05 was considered significant and all data are presented as mean (SD, range) unless indicated otherwise.
RESULTS
Study population
The mean age at transplantation of the 38 lung transplant recipients included in the study was 43.7 (SD 13.1, range 12.7–64.6) years. The interval between transplantation and baseline CT scans was 44 (SD 33, range 2–120) months and the interval between baseline and follow up CT scans was 11.2 (SD 4.7, range 2.3–17.4) months. At the time of the baseline CT scan, 22, 10, 4 and 2 patients were in BOS stages 0, 1, 2 and 3, respectively, by spirometric criteria. One patient did not have a follow up CT scan and another was excluded from follow up analysis because of biopsy proven acute rejection. Other subject characteristics are given in table 2.
Characteristics of study population
Inter- and intra-observer agreement
The inter-observer and intra-observer agreement for the CTAT score, CTBO score, and other component scores are shown in table 3. An intraclass correlation coefficient above 0.80 was considered to represent good agreement. The inter-observer agreement was above 0.80 for the CTAT score and the bronchiectasis CT score. However the CTBO score and consolidation, mucus plugging, airway wall thickening, and mosaic pattern component scores were below 0.80. The intra-observer agreement after 1 month was good for the CTAT score and the CTBO score but was below 0.80 for mucus plugging, airway wall thickening, and mosaic pattern component scores (table 3).
Intra-observer and inter-observer agreement of CT abnormalities including air trapping and composite CTBO score
Relationship between baseline FEV1 and CTBO score or CTAT score
There was a significant association between FEV1 and both the CTBO score and the CTAT score measured at baseline (fig 2), with a higher (more damage) CT score corresponding to a lower (worse) FEV1 value. The baseline CTBO score increased by 0.20 (p = 0.0001, observer 1) and 0.26 (p<0.0001, observer 2) and the baseline CTAT score increased by 0.55 (p = 0.02, observer 1) and 0.55 (p = 0.02, observer 2) for each percentage decrease in baseline FEV1 (fig 2). The follow up CTBO score increased by 0.25 (p<0.0001, observer 1) and 0.27 (p<0.0001, observer 2) and the follow up CTAT score increased by 0.36 (p = 0.002, observer 1) and 0.63 (p<0.0001, observer 2) for each percentage decrease in follow up FEV1.

Association between FEV1 at baseline CT scan and (A) bronchiolitis obliterans (CTBO) score and (B) air trapping (CTAT) score at baseline CT scan. The CTAT score showed a greater and stronger association than the CTBO score (slope 0.55 for CTAT score versus 0.20 for CTBO score), but the association of the CTAT score with FEV1 appeared to be less precise than for the CTBO score (p = 0.02 and p = 0.0001, respectively). Data given are for observer 1 first observation.
We divided the subjects into a group without BOS (FEV1 >80% baseline) and a group with BOS (FEV1 <80% baseline) and arbitrarily set a CT score of >5 as abnormal. In patients without BOS, 12 of 22 had a CT score >5 (55% of patients with normal FEV1 had an abnormal CT score). Air trapping alone was present in 19 of the 22 subjects without BOS (86%). In subjects with BOS, 13 of 16 had an abnormal CT score >5 (81%) and air trapping alone was present in 16 (100%).
Relationship between baseline CTBO score and changes in CTBO score and FEV1
There were significant associations between the baseline CTBO score and both FEV1 and the CTBO score measured after 1 year. The mean FEV1 at follow up decreased by 1.55% (observer 1) or 1.37% (observer 2) of baseline for every additional unit in the CTBO score at baseline (p<0.0001). The mean CTBO score at follow up increased by 1.25 units (observer 1) or 1.12 units (observer 2) for every additional unit in the CTBO score at baseline (p<0.0001).
Relationship between baseline CTAT score and changes in CTAT score and FEV1
There were significant associations between the baseline CTAT score and both FEV1 and the CTAT score measured after 1 year. The mean FEV1 at follow up decreased by 0.27% (observer 1) or 0.24% (observer 2) of baseline for every additional unit in the CTBO score at baseline (p = 0.0003 and p = 0.0004, respectively). The mean CTBO score at follow up increased by 0.74 units (observer 1) or 0.68 units (observer 2) for every additional unit in the CTBO score at baseline (both p<0.0001).
DISCUSSION
The aims of the present study were to determine the intra- and inter-observer agreement of the CTBO score and CTAT score, to determine the cross sectional association between the CTBO score and CTAT score with FEV1, and to relate the CTBO score at baseline to changes in FEV1 and changes in the CTBO score over the course of 1 year. Our hypotheses were that (1) the CTBO score and CTAT score would show significant associations with FEV1 and (2) the CTBO score at baseline would predict changes in FEV1 and the CTBO score over the course of 1 year. This study was not designed to determine if the CTBO score is more useful than the CTAT score.
Similar to previous studies,14,16 our data show good inter-observer and intra-observer agreements for the CTAT score. However, also similar to a previous study,13 the intraclass correlation coefficient for the composite CTBO score in our study was borderline. This was related to the relatively low level of inter-observer agreement in scoring mucus plugging, airway wall thickening, and mosaic pattern. A number of factors may be responsible for the disagreements in scoring airway wall thickening and mosaic pattern. Firstly, most of our patients had mild (BOS-0 and BOS-1) airflow obstruction. As the CT scans showed only subtle abnormalities, this makes scoring more difficult than in cystic fibrosis where the abnormalities are more pronounced, although in cystic fibrosis studies the scores for airway wall thickening and mosaic pattern were also not very reproducible.15,20 Secondly, although both observers had substantial expertise with interpretation and scoring of chest CT scans, they had limited experience of reading CT scans from lung transplant recipients. However, this situation may accurately reflect the typical clinical setting where chest CT scans are often read by radiologists with limited experience in lung transplant CT interpretation. Inter-observer agreement may be better for observers in large transplant centres who are more experienced in evaluating CT scans of lung transplant recipients. Alternatively, it may be best to combine these subjective scoring systems with a computerised analysis of lung parenchyma21,22 and airways23,24 which could combine the clinical impression with objective quantitative values.
The most important findings of this study are that both the CTBO and CTAT scores are significantly associated with FEV1, and both scores predicted the clinical course of a patient over the year following the CT scan. A 1% higher CTBO score at baseline predicts a 1.55% faster worsening in FEV1 and a 1.25% faster worsening in the CTBO score over the coming year (observer 1). Similarly, a 1% higher CTAT score at baseline predicts a 0.27% faster worsening in FEV1 and a 0.74% faster worsening in the CTBO score over the coming year (observer 1). This finding suggests that both the composite CTBO score and the CTAT score could potentially identify BO earlier than FEV1. We cannot determine from our study whether the CTBO score is more useful than the CTAT score, and it would therefore be prudent for future longitudinal studies evaluating the usefulness of subjective CT interpretation in BO to include a composite CT score as well as an air trapping CT score alone.
Nevertheless, these results support the concept that CT scanning is a valuable tool in the evaluation and follow up of lung transplant recipients. Lung function is currently the “gold standard” for detecting lung allograft dysfunction, but it is an indirect measurement and can only give a global assessment of the pulmonary condition. The major advantage of CT scanning is that it is a direct measure of lung structure and allows for the identification of structural abnormalities associated with chronic allograft dysfunction, including bronchiectasis, airway wall thickening, mucus in small and large airways, and air trapping due to small airway abnormalities. Furthermore, CT imaging allows for the detailed analysis of the regional distribution of pathological processes such as BO. This is particularly pertinent in single lung transplant recipients in whom physiological measures such as FEV1 are confounded by the contribution from the native lung. Even in double lung transplant recipients, lung function tests may be insensitive in those with a heterogeneous distribution of damage, especially when the abnormalities are located in the most peripheral airways. For these reasons, we suggest that CT scanning could identify BO earlier than FEV1, at a time when changes in immunosuppression may result in improved clinical outcomes. The use of clearly defined CT parameters (particularly a composite CT score that quantifies numerous lung components), possibly in combination with quantitative CT measures, may therefore have an important role as a standardised outcome for research trials involving BO.
In this study we did not analyse our data using the BOS 0-p stage. Because FEV1 declines later in the disease process, this new category (BOS 0-p) was added based on forced expiratory flows between 25% and 75% of forced vital capacity (FEF25–75).3 However, its prognostic usefulness has been debated,17,25 with variable positive and negative predictive values reported. In view of this uncertainty, our statistical analysis was performed using FEV1 as a continuous variable rather than being based on BOS stages, and hence this did not affect our analysis.
Potential limitations of the study include the relatively small study population, the short follow up, and the variation in timing of the baseline CT scan. A larger number of patients followed over a longer time frame would be useful to help characterise the potential role of CT scans for the early detection of chronic lung allograft dysfunction. Such a study could also examine the optimal interval between CT scans to detect BO earlier than FEV1. Finally, our analysis may be limited by the fact that only three expiratory CT images were obtained and it may be advantageous in future studies to increase this number.
In conclusion, we systematically evaluated inter-observer and intra-observer agreement for qualitative CT scoring of a variety of abnormalities including a composite CTBO score in a patient population with predominantly mild abnormalities. Both the composite CTBO score and the CTAT score had good or fairly good inter-observer and intra-observer agreement. Our findings indicate a potential role for a composite CT score, as well as an air trapping score alone, in lung transplant recipients.
Acknowledgments
The authors acknowledge Dr Boris Sobolev for his statistical advice, the British Columbia Lung Association and the Canadian Institute of Health Research/Michael Smith Foundation for financial support, and the staff of the British Columbia Transplant Society Lung Transplant Program for help with the collection of data.
REFERENCES
Footnotes
-
Published Online First 2 May 2006
-
Dr de Jong was supported by a British Columbia Lung Association Fellowship in Respiratory Medicine and a Canadian Institute of Health Research/Michael Smith Foundation Transplant Research Training Award and Dr Coxson is a Parker B Francis Fellow in Pulmonary Research.
-
Conflict of interest: The authors declare no competing interest in the content of this manuscript.
Linked Articles
- Airwaves