Article Text

Abstract
Background: A study was undertaken to compare the ability of computed tomographic (CT) scores and pulmonary function tests to detect changes in lung disease in children and adults with cystic fibrosis (CF).
Methods: CT scans and pulmonary function tests were retrospectively studied in a cohort of patients with CF aged 5–52 years for whom two or three CT scans at 3 year intervals were available, together with pulmonary function test results. All CT scans were scored by two observers. Pulmonary function results were expressed as percentage predicted and Z scores.
Results: Of 119 patients studied, two CT scans were available in 92 patients and three in 24. CT (composite and component) scores and lung function both deteriorated significantly (p<0.02). Peripheral bronchiectasis worsened by 1.7% per year in children (p<0.0001) and by 1.5% per year in adults (p<0.0001). Bronchiectasis worsened in 68 of 92 patients while forced expiratory volume in 1 second (FEV1) worsened in 54 of 92 patients; bronchiectasis also deteriorated in 27 patients with stable or improving FEV1. The CT score (and its components) and pulmonary function tests showed similar rates of deterioration in adults and children (p>0.09).
Conclusion: The peripheral bronchiectasis CT score deteriorates faster and more frequently than lung function parameters in children and adults with CF, which indicates that pulmonary function tests and CT scans measure different aspects of CF lung disease. Our data support previous findings that the peripheral bronchiectasis CT score has an added value to pulmonary function tests in monitoring CF lung disease.
- CT, computed tomography
- FVC, forced vital capacity
- FEV1, forced expiratory volume in 1 second
- MEF25, MEF50, mid expiratory flow at 25% and 50% of vital capacity
- PFT, pulmonary function test
- RV, residual volume
- TLC, total lung capacity
- cystic fibrosis
- computed tomography
- pulmonary function tests
- bronchiectasis
- lung structure
Statistics from Altmetric.com
- CT, computed tomography
- FVC, forced vital capacity
- FEV1, forced expiratory volume in 1 second
- MEF25, MEF50, mid expiratory flow at 25% and 50% of vital capacity
- PFT, pulmonary function test
- RV, residual volume
- TLC, total lung capacity
Patients with cystic fibrosis (CF) show progressive worsening in lung structure and function due to chronic infection and inflammation.1–3 Pulmonary function tests (PFTs) are considered the gold standard for monitoring changes in CF lung disease.2 It has been found, however, that functional changes can be preceded by structural changes detected on computed tomography (CT) scans.4–8 CT scoring systems can quantify structural abnormalities in CF in a reproducible fashion.5,9–13 A recent study in children from a single CF centre showed that structural lung abnormalities evaluated by composite CT scores worsened while PFTs remained stable or improved over a 2 year interval. In addition, the component CT scores for bronchiectasis and mucous plugging worsened significantly and irreversibly.6
The aims of this study were to compare the ability of CT scores and PFTs to detect changes in CF lung disease in a different cohort of children and in adults. We hypothesised that (1) on average, CT scores and PFTs would show worsening in adults at an equal rate, and (2) in concordance with previous findings in children, CT scores on average would deteriorate while PFTs would remain stable.
METHODS
Study population
Since 1997 the West Swedish CF centre (Gothenburg, Sweden) has added CT scans to PFTs in the annual check up for patients aged 5 years and older. The first CT scan was done when a patient obtained reliable PFT results, and CT scans were repeated every third year thereafter. The annual check up was postponed if exacerbation was evidenced by a change in the antibiotic regimen necessitated by acute worsening of CF lung disease. CT scans and PFTs were therefore performed only when patients were clinically stable. All routine CT scans up to April 2004 were included. Patients were diagnosed as having CF when they had a positive sweat test and/or two known CF mutations. The cohort was divided into subjects aged ⩽18 years at first scan (children) and those aged >18 years (adults). Pancreatic status and the prevalence of chronic Pseudomonasaeruginosa infection were assessed at the time of the first CT scan. Chronic Pseudomonas infection was defined as sputum or nasopharyngeal cultures positive for Pseudomonas on two or more occasions in 6 months. In all subjects cultures had been obtained on average monthly.
The ethical review board of the West Swedish CF centre approved this retrospective study.
Lung structure
Lung structure was evaluated using CT scans. In children, a single detector CT scanner (Philips LX, Philips Medical Systems, Best, The Netherlands) was used from 1997 to 1999, and a multidetector row (four or eight rows of detectors) CT scanner after 1999 (General Electric Light Speed Ultra, GE Medical Systems, Milwaukee, WI, USA). Scans were obtained using a beam current of 120 mA, an exposure time of 0.5 s, and a beam potential of 120 kV from lung apex to base at 15 mm intervals using 1.25 mm thick slices. In adults, a PQ 6000 scanner (Picker International Inc, Highland Heights, OH, USA) was used throughout the study period. Scans were obtained using a beam current of 160 mA, a 1 second exposure time, and a beam potential of 120 kV from lung apex to lung base at 10 mm intervals using 1.5 mm thick slices.
All scans were reconstructed with a high spatial frequency algorithm (bone), printed (window width 1400 Hounsfield units (HU), window level −400 HU), blinded to date and patient identification, and scored in random order by two independent experienced observers using an adapted scoring system recently developed by Brody et al.13 This scoring system evaluates the five lung lobes and the lingula as a sixth lobe for severity and extent of central and peripheral bronchiectasis, extent of central and peripheral mucous plugging, severity and extent of central and peripheral airway wall thickening, extent of opacities (atelectasis or consolidations), and extent of cysts and bullae. Hyperinflation (gas trapping) was excluded from scoring since not all scans had expiratory images and mosaic perfusion was scored instead. Ground glass pattern was not scored in this study. The maximum composite CT score without air trapping and ground glass pattern and with mosaic perfusion was 180.13 In addition, component CT scores were calculated by adding the component scores from the six lobes. Maximal component scores for central bronchiectasis, peripheral bronchiectasis, central mucus, peripheral mucus, central airway wall thickening, peripheral airway wall thickening, opacities, mosaic perfusion, and cysts or bullae were 18. For statistical analysis the mean composite and component CT scores of both observers were expressed on a scale of 0–100 (percentage of maximum possible score).
Lung function
Conventional PFTs were done using a dry rolling seal spirometer (MasterLab, Jaeger, Würzburg, Germany). Forced vital capacity (FVC), forced expiratory volume in 1 second (FEV1), mid expiratory flow at 25% and 50% of VC (MEF25 and MEF50), residual volume (RV), and total lung capacity (TLC) were expressed as percentage of predicted values and as Z scores. The ratio between FEV1 and FVC and between RV and TLC was calculated and expressed as a percentage, as percentage predicted, and as a Z score. For children, prediction equations developed by Quanjer and colleagues14 were used for FEV1 and FVC and prediction equations developed by Zapletal and colleagues15 were used for MEF25, MEF50, RV, and TLC. For adults, prediction equations from the European Respiratory Society16 were used for all parameters. Spirometric tests (FEV1, FVC, MEF25 and MEF50) were performed in all patients at each annual check up. Plethysmography (RV and TLC) was performed in 106 of 119 patients (89%), 81 of 92 (88%), and 21 of 24 patients (88%) at the first, second, and third check up, respectively.
Statistical analysis
Interobserver agreement of composite and component CT scores was calculated using intraclass correlation coefficients. An intraclass correlation coefficient of >0.8 represents good agreement. Systematic errors in component scores were detected using Bland and Altman plots that express the difference between two observers as a function of their mean.17 Descriptive statistics for children and adults were calculated for the time of the baseline CT scan. Annual changes in the composite CT score, component CT scores, and PFTs over time were evaluated separately for children and adults using repeated measurements analysis of variance (RMANOVA). This analysis includes all measurements in the patients with one, two or three evaluations. Because distributions of MEF25 (Z score) and MEF50 (Z score) were not normal, percentage predicted values transformed to a 10logarithmic scale were used for analysis of MEF25 and MEF50. For all other PFTs Z scores were used as these account for variability of test scores. A positive slope (annual change value) for the CT score, RV, TLC and RV/TLC and a negative value for other PFTs indicates worsening of disease. In addition, the numbers of patients who remained stable, improved, or who worsened for both CT and PFTs measurements were calculated. Discrepancies between changes in the composite CT score, peripheral bronchiectasis CT score, and FEV1 were also recorded. Data are expressed as mean (SD) or as mean (SE) and p<0.05 was considered significant.
RESULTS
Study population
CT scans were available for 119 patients with CF (72 children and 47 adults). Two scans were available for 92 patients (53 children), and a third scan was available for 24 of these. Baseline characteristics are given in table 1.
Baseline characteristics of study patients
Reproducibility of the scoring system
Intraclass correlation coefficients (r value) between both observers for CT scores were: composite 0.92; bronchiectasis 0.88; opacities 0.80; mucous plugging 0.72; airway wall thickening 0.67; bulla and cysts 0.53; and mosaic perfusion 0.27. Bland and Altman plots gave no evidence of systematic errors in scoring between the two observers for mean bronchiectasis and bulla or cysts, but for mosaic perfusion and mucous plugging observer observer 1 (PdJ) scored on average systematically higher than observer 2 (LR) and for airway wall thickening observer 2 scored on average higher than observer 1. The higher scores rated by observer 1 for mucous plugging and mosaic perfusion were more pronounced at the lower scores, but the higher score rated by observer 2 for airway wall thickening was independent of the scale. There were no systematic differences between the two observers for the other component CT scores and the composite CT score, although observer variability expressed as a percentage of the mean was larger at the lower end of the scale.
Rate of deterioration in CT scan and PFTs in children and adults
Table 2 shows the slopes of the RMANOVA regression equations of CT and PFTs with age, representing annual changes in CT scans and PFTs. Interestingly, FEV1 worsened by 0.07 Z score in the children (p = 0.03) and FEV1/FVC worsened by almost 0.1 Z score per year in both children (p = 0.002) and adults (p = 0.02). MEF25 and MEF50 also worsened in children (p = 0.005 and 0.006, respectively) and adults (p = 0.007 and 0.005, respectively), and RV worsened in adults (p = 0.01). All other PFTs remained unchanged (p>0.07). Composite CT scores and all component CT scores except the mosaic perfusion score in children and adults and peripheral mucous plugging score in adults deteriorated significantly over time in children (p<0.004) and adults (p<0.03). The strongest rate of deterioration was observed for peripheral bronchiectasis score in children (1.7% per year, p<0.0001) and for the composite CT score in adults (1.5% per year, p = 0.0003). There was no significant difference in the slopes for any of the parameters between children and adults (p>0.09), but the composite CT score and RV tended to deteriorate faster in adults than in children.
Annual changes in pulmonary function test (PFT) results and composite and component CT scores in children and adults
Discrepancies between changes in CT scores and PFTs
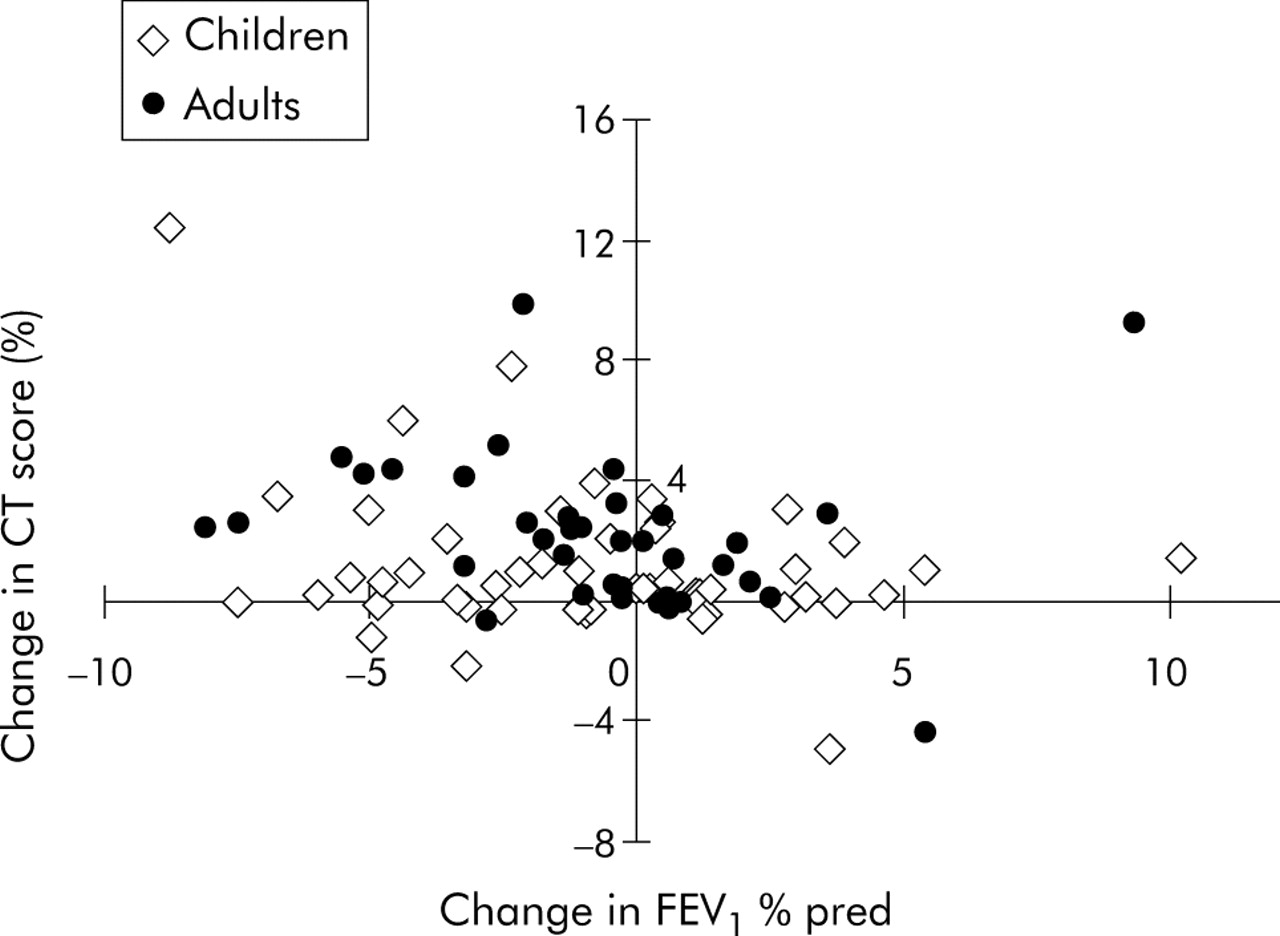
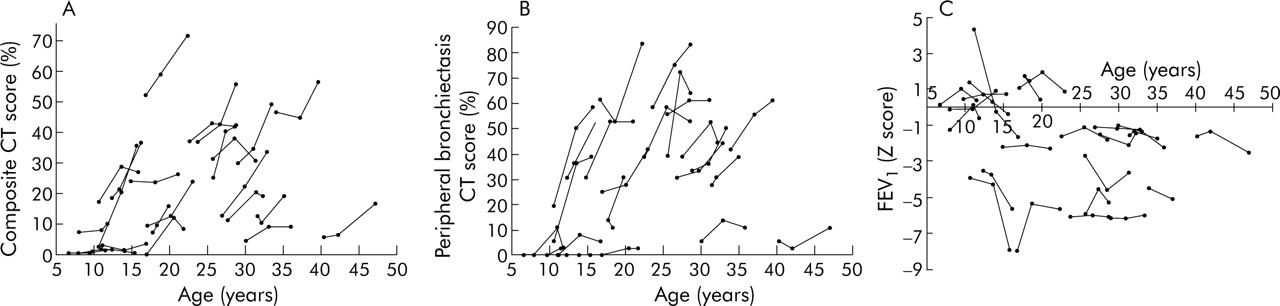
Figure 1 shows the marked discrepancies between changes in structure (composite CT score) and changes in function (FEV1). FEV1 worsened in 31 of the 53 children (58%) while the composite CT score and peripheral bronchiectasis CT score worsened in 35 (66%). The findings of CT scanning and PFTs were discordant in 29 of the 53 children (55%). In adults, FEV1 worsened in 24 of 39 (62%), composite CT score in 34 (87%), and peripheral bronchiectasis CT score in 33 (85%). The findings of CT scanning and PFTs were discordant in 12 of the 39 adults (31%). Figure 2 shows the changes over the three evaluations for composite CT score, peripheral bronchiectasis CT score, and FEV1 in the 24 patients who had three scans. Figure 3 gives an example of the progression in structural abnormalities over 4 years despite stable lung function. It is evident from figs 2 and 3 that, in many patients (27 of 92), the composite CT score worsened while FEV1 remained stable.

Change in FEV1 versus change in composite CT score over 3 years in children and adults with CF. The changes in the CT score and FEV1 are concordant in the left upper quadrant (both worsening in FEV1 and CT: 19 children and 23 adults) and in the right lower quadrant (both improvement in FEV1 and CT: 5 children and 4 adults). The changes in the CT score and FEV1 are discordant in the left lower quadrant (worsening in FEV1 and improvement in CT: 12 children and 1 adult) and in the right upper quadrant (improvement in FEV1 and worsening in CT: 17 children and 11 adults).

Changes in (A) composite CT score, (B) peripheral bronchiectasis CT score, and (C) forced expiratory volume in 1 second (FEV1) over 6 years in 24 patients who had three evaluations. Most of the 24 patients had a stable FEV1 over the 6 years while the composite CT score and peripheral bronchiectasis CT score13 showed the expected disease progression.

Worsening of irreversible structural abnormalities and improvement in lung function parameters over 4 years in a female patient with cystic fibrosis (age at first scan in 1999 = 9.5 years, age at second scan in 2001 = 12.0 years, age at third scan in 2003 = 13.9 years). Composite CT scores13 worsened from 21 to 37 to 40; FEV1 improved from 51% predicted to 61% predicted to 70% predicted; FVC improved from 67% predicted to 78% predicted to 85% predicted; FEV1/FVC improved from 75% to 78% to 82%; FEF25–75 improved from 11% predicted to 14% predicted to 20% predicted. Arrows in the upper three images (2A(i–iii)) represent the increase in severity of bronchiectasis and airway wall thickening in both upper lobes. Arrows in the middle three images (2B(i–iii)) show the decrease in central mucous plugging and increase in size of central bronchiectasis. Circled areas show the decrease in central mucous plugging and an increase in the bronchiectatic size of the airway in the lower lobe. The circled areas in the lower three images (2C(i–iii)) show the increased number and size of peripheral bronchiectasis, although there was some motion artefact on the CT scan of 1999.
DISCUSSION
The major findings of this retrospective clinical study are that, both in adults and children with CF, routine CT scans detect deterioration in more patients than do PFTs and at a steeper rate, and that in almost half of the patients the change in CT score is discordant from the change in PFTs.
We hypothesised that, in adults, on average both CT scores and PFTs would show deterioration. However, our findings were in disagreement with our hypothesis: while the peripheral bronchiectasis CT score (1.52% per year) and composite CT score (1.55% per year) worsened, most PFT parameters including FEV1 remained (on average) unchanged. In addition, we found that in one third of the adults there was discordance between the changes in the CT scores and PFT results.
Our second hypothesis was that, in agreement with previous findings, CT scans in children would, on average, show deterioration while PFTs would remain stable.6 In contrast to previous findings, however, we found that the deterioration in FEV1 (0.07 Z score is approximately 1% predicted) equalled that of the component CT score. However, the peripheral bronchiectasis CT score decreased 70% faster than either the FEV1 or the composite CT score. In addition, the proportion of children with a decline in the peripheral bronchiectasis CT score was larger than the proportion with a decline in FEV1. In more than half of the children the change in the CT score was discordant with the change in PFTs. The rate of deterioration in the peripheral bronchiectasis CT score was also larger than the rate of deterioration in the composite CT score.
The fact that the peripheral bronchiectasis CT score declined faster than PFTs warrants further discussion. For several reasons we feel that the bronchiectasis CT score is an attractive outcome parameter, both clinically and in trials, and we believe this abnormality is most characteristic of CF lung disease. Evaluation of bronchiectasis on the CT scan is considered to be the gold standard18–21 and PFTs are considered insensitive for diagnosing bronchiectasis. Bronchiectasis can be evaluated relatively easily on CT scans (as shown by the good interobserver agreement in this and other studies)5,13 and, while it is argued that bronchiectasis is reversible in other diseases,22,23 in CF it is irreversible.6 Finally, we believe that airway wall thickening (related to airway inflammation), mucous plugging, and consolidations are all risk factors for the development of bronchiectasis, and bronchiectasis is therefore a highly relevant end stage feature of CF lung disease. We currently lack a true sensitive end point to monitor CF lung disease. Mortality and quality of life are considered true end points but they are insensitive. The relationship between bronchiectasis, CT score, and mortality remains to be investigated in CF but, from studies in patients with non-CF bronchiectasis, we know that the severity of bronchiectasis is closely correlated with quality of life.24 It is likely that the same is true for CF although other factors such as pancreatic insufficiency and diabetes might obscure this correlation.
There may be several reasons why PFTs deteriorated less than bronchiectasis on the CT scan. Firstly, PFTs have a high noise to signal ratio and Z scores or percentage predicted values are calculated using reference equations based on a large population. Secondly, CT scans can show focal areas of bronchiectasis that can be scored reproducibly, whereas PFT values can fluctuate for reasons other than structural airway damage, such as viral infections and patient effort. The fact that PFTs and CT scans measure different aspects of CF lung disease is also reflected by our observation that composite CT scores worsened in a substantial number of patients with stable or improving PFTs. In addition, PFTs worsened in several patients with a stable composite CT score. This discrepancy between lung function and CT findings supports the view that both are needed to determine the state of CF related lung disease adequately, and that CT scanning provides detailed structural information that cannot be obtained by PFTs or chest radiographs. We feel strongly that this structural information helps us to tailor treatment and to reduce under or over treatment. However, to date there is no scientific proof that the use of CT scanning improves disease outcome.
There are two possible reasons why the peripheral bronchiectasis CT scores worsened faster than the composite CT scores in children but not in adults. Firstly, reversible abnormalities such as mucous plugging,25,26 airway wall thickening, and mosaic perfusion might have been more reversible in the children. This would lead to less change over time in the partly reversible composite CT score in relation to the irreversible bronchiectasis CT score. Secondly, changes in airway wall thickening and mosaic perfusion were more subtle in the children and therefore were more difficult to score. Less reproducible scoring of these abnormalities could have introduced more noise and subsequently have reduced the ability to detect disease progression in the children’s composite CT scores.
The most likely explanation for the discrepancies in PFT findings between this cohort and the previously published cohort is duration of follow up. The latter was followed for 2 years only while our cohort was followed for up to 6 years. Furthermore, there might be differences between CF centres and between patient populations.
We can only speculate as to why composite CT scores in the children in this study deteriorated at a similar rate to PFTs. As the children in the previous study had, on average, more advanced disease (lower PFTs at baseline), the CT abnormalities might have been less reversible and could therefore have been scored more reproducibly, as discussed previously. On the other hand, while in the present study CT images were acquired at 15 mm intervals, the previous study obtained them at 10 mm intervals. As CF airway disease starts heterogeneously, the larger interval between images is likely to have resulted in less sensitive composite CT scores in this study.
The PFT findings in this study warrant further consideration. Firstly, we found a significant worsening in MEF25 and MEF50 which may be consistent with early lung disease.7 Unfortunately, MEF25 and MEF50 have a relatively large standard deviation, and changes in Z scores that we could not use in this study may not have been significant. Secondly, the FEV1/FVC ratio changed significantly. Although this parameter is not usually included in the analysis of large clinical trials in CF,27–30 our findings suggest that it may be a relatively sensitive lung function measurement in CF.
The adults in this study were a selected group of long term survivors and few had severe lung disease (27 of 39 adults had an FEV1 of ⩾75% predicted). Accordingly, the proportion of pancreatic sufficient patients among the adults was higher than among the children. Our findings might therefore not be valid for patients with end stage lung disease.
The potential negative effect of radiation exposure of repeated CT scanning remains a point of discussion and concern.31,32 When using repetitive CT scanning it is important to keep the cumulative lifelong radiation exposure as low as possible. For this reason, CT scans were performed once every 3 years rather than annually. We recently completed a computational modelling study to estimate the cancer mortality risk of lifelong biennial CT scanning in CF patients.33 Based on this model, the risk of our current CT protocol is estimated to be well within acceptable limits. Technical improvements are likely to reduce radiation doses further.
Our study is limited in that we did not evaluate air or gas trapping on the CT scans, which is an early marker of CF lung disease.13,34–36 Nevertheless, the sensitivity of this CT abnormality to track disease progression in CF is at present unknown and requires further study. In addition, we did not include potentially more sensitive PFTs such as multiple breath washout tests.37 The comparison between changes in such tests and CT parameters requires further study. The rate of progression of bronchiectasis could have been influenced by allergic bronchopulmonary aspergillosis (ABPA). However, only one patient treated in 1995 has been classified as having ABPA at the centre. After a short course of oral steroids he has been doing well with stable lung function using only high dose inhaled steroids and on and off itraconazole. We are confident of not having missed any other ABPA because total IgE measurement has been included in the annual review since 1990 and all patients with high total IgE titres would be investigated for ABPA.
In conclusion, this study shows that routine CT scans deteriorated while PFTs remained unchanged or deteriorated at a slower rate in both adults and children with CF. The deterioration on the CT scan was best reflected in the peripheral bronchiectasis CT score in children and in both the composite CT score and peripheral bronchiectasis CT score in adults. Bronchiectasis can be scored reproducibly and is irreversible in CF. Our findings indicate that a composite CT score may be less useful than a peripheral bronchiectasis CT score since it consists of reversible and irreversible components, and not all components were scored reproducibly in this study. We conclude that, by providing complementary information to PFTs, the peripheral bronchiectasis CT score is important for monitoring CF patients clinically and is expected to become an important outcome parameter in clinical studies in CF.
Acknowledgments
The authors thank Pia Lundegaard for all the time she spent blinding the CT scans for this study.
REFERENCES
Footnotes
-
Published Online First 21 October 2005
-
This study was funded by the Cystic Fibrosis Team Rotterdam CF research funds, Rotterdam, The Netherlands.
-
PdJ, AL, LR, WH, JJ, MB and HT have no competing interests in the content of this manuscript.
Linked Articles
- Airwaves