Article Text

Abstract
Background: Patients with acute pulmonary embolism (APE) present with a broad spectrum of prognoses. Computed tomographic pulmonary angiography (CTPA) has progressively been established as a first line test in the APE diagnostic algorithm, but estimation of short term prognosis by this method remains to be explored.
Methods: Eighty two patients admitted with APE were divided into three groups according to their clinical presentation: pulmonary infarction (n = 21), prominent dyspnoea (n = 29), and circulatory failure (n = 32). CTPA studies included assessment of both pulmonary obstruction index and right heart overload. Haemodynamic evaluation was based on systolic aortic blood pressure, heart rate, and systolic pulmonary arterial pressure obtained non-invasively by echocardiography at the time of diagnosis of pulmonary embolism.
Results: The mortality rate was 0%, 13.8% and 25% in the three groups, respectively. Neither the pulmonary obstruction index nor the pulmonary artery pressure could predict patient outcome. In contrast, a significant correlation with mortality was found using the systolic blood pressure (p<0.001) and heart rate (p<0.05), as well as from imaging parameters including right to left ventricle minor axis ratio (p<0.005), proximal superior vena cava diameter (p<0.001), azygos vein diameter (p<0.001), and presence of contrast regurgitation into the inferior vena cava (p = 0.001). Analysis from logistic regression aimed at testing for mortality prediction revealed true reclassification of 89% using radiological variables.
Conclusion: These results suggest that CTPA quantification of right ventricular strain is an accurate predictor of in-hospital death related to pulmonary embolism.
- APE, acute pulmonary embolism
- BP, blood pressure
- CF, circulatory failure
- CTPA, computed tomographic pulmonary angiography
- PAPs, systolic pulmonary artery pressure
- PD, prominent dyspnoea
- PI, pulmonary infarction
- RV, right ventricular
- RV/LV ratio, right ventricular to left ventricular diameter ratio
- acute pulmonary embolism
- computed tomographic pulmonary angiography
- RV/LV ratio
- obstruction index
- prognosis
Statistics from Altmetric.com
- APE, acute pulmonary embolism
- BP, blood pressure
- CF, circulatory failure
- CTPA, computed tomographic pulmonary angiography
- PAPs, systolic pulmonary artery pressure
- PD, prominent dyspnoea
- PI, pulmonary infarction
- RV, right ventricular
- RV/LV ratio, right ventricular to left ventricular diameter ratio
- acute pulmonary embolism
- computed tomographic pulmonary angiography
- RV/LV ratio
- obstruction index
- prognosis
Acute pulmonary embolism (APE) is a common disease responsible for a natural mortality rate than can reach 30%.1,2 In some cases, pulmonary embolism may cause such haemodynamic compromise that death ensues suddenly, sometimes before hospital admission.3 However, in most severely affected patients, circulatory failure develops progressively, within the first hours after onset of APE. This haemodynamic profile results from acute cor pulmonale due to increased pulmonary vascular input impedance which overwhelms the adaptive resources of the right ventricle.4 The problem facing the medical team is the necessity to detect those patients with life threatening right ventricular (RV) failure even though systemic blood pressure (BP) may be still satisfactorily compensated at presentation. This is one reason why bedside echocardiography has emerged as first line examination for the detection of RV dysfunction, in addition to the possibility of being serially repeated.5–8 Thrombi within cardiac cavities or in the pulmonary vascular bed are important adverse prognostic factors. Unfortunately, such thrombi are detected by echocardiography mostly by coincidence, even when assessed by an experienced operator.7 APE is therefore suspected when other diseases leading to right heart failure—such as pericardial effusion and myocardial infarction—have been reasonably excluded. Indeed, many of the findings of RV overload are also detectable with computed tomographic pulmonary angiography (CTPA).9–16 In addition, this approach is usually available at all hours in most emergency institutions and provides the potential to reveal not only central haemodynamic disturbances but also to directly diagnose APE.17 Nevertheless, clinical studies designed to evaluate whether CTPA can accurately predict short term prognosis remain relatively scarce and present conflicting conclusions.13,18–20 We therefore carried out this retrospective study to test the hypothesis of a correlation between the pulmonary vascular clot burden and radiological indices of RV overload with in-hospital mortality.
METHODS
Patient population
Patient selection was retrospectively generated from the emergency department diagnostic database. Because this retrospective study aimed at testing the value of prognostic indicators, final inclusion was based on the selection of patients who had symptoms of severe pulmonary embolism—namely, major dyspnoea and arterial hypoxaemia below 70 mm Hg while breathing room air, syncope or circulatory shock. Medical records of patients who were eligible for the study were reviewed by two authors (AG and BL).
Eight patients were excluded from the study because diagnostic strategies other than CTPA were used in six (V/Q lung scan in two; digital substraction pulmonary angiography in two; echocardiographic pattern of right heart failure and suggestive clinical findings in two) and because CTPA examinations were not available for review at time of the study in two. The final study group included 82 patients (42 women) admitted between January 1995 and December 2001. The mean age of the patients was 61 years (range 22–84). Clinical severity at admission was used to classify the patients according to Stein and Henry21 into three groups: pulmonary infarction (PI group), prominent dyspnoea present at rest (PD group), and circulatory failure (CF group). Twenty one patients were suspected of having pulmonary infarction due to thoracic pain and/or haemoptysis and were included in the PI group; 29 patients presented with severe dyspnoea and were placed in the PD group; and 32 patients with complaints which ranged from transient loss of consciousness to clinical signs of shock with systemic hypotension (defined as systolic BP <100 mm Hg) comprised the CF group.
Therapeutic protocol
All patients were treated by the permanent team of emergency care physicians using standard therapeutic protocols for the management of APE.22,23 In essence, patients with persistent hypotension or shock received careful fluid challenges and vasopressor support (catecholamine infusion) as needed. Aetiological treatment consisted of anticoagulation with intravenous infusion of heparin only in 55 patients (67%) and systemic thrombolysis with intravenous alteplase (Actilyse, Boehringer Ingelheim Pharma, Germany) in 21 (26%). The decision to proceed to thrombolytic therapy was based on the existence of either massive APE (>50% obstruction of the pulmonary vasculature) and haemodynamic instability or the presence of acute cor pulmonale evidenced by qualitative echocardiography. Six patients (7%) underwent surgical embolectomy because of contraindication to thrombolytic therapy (n = 1) or because of right heart worm-shaped type A thrombi associated with circulatory failure (n = 5). These thrombi were detected by echocardiography in four patients while CTPA allowed visualisation in all of them.
Transthoracic echocardiography
Data from transthoracic echocardiography were available at the time of diagnosis in 20 of the 21 patients in the PI group, in 26 of the 29 in the PD group, and in 30 of the 32 in the CF group. Systolic pulmonary arterial pressure (PAPs) was derived from the right atrioventricular pressure gradient using peak velocity of tricuspid flow regurgitation with continuous wave Doppler in the apical four chamber view and the modified Bernoulli equation.24 Right atrial pressure was considered equal to 5 mm Hg or 10 mm Hg according to whether or not the inferior vena cava collapsed during inspiration, respectively.25
Helical CTPA
All spiral CTPA examinations were performed within 2 hours of patient admission to the Department of Emergency Care. Images were obtained on the same scanner (PQ 5000, Philips, Eindhoven, The Netherlands) during inspiratory breath holding when possible or during quiet breathing when patients were short of breath. Intravenous injection of contrast medium (140 ml of 30% iodinated contrast material, Xenetix, Guerbet, Aulnais-sous Bois, France) was started 20 seconds before start of acquisition by using an indwelling antecubital venous catheter and an automated injector at a rate of 3 ml/s. A caudocranial spiral volumetric acquisition was obtained with a collimation of 5 mm (n = 11), 3 mm (n = 14), or 2 mm (n = 57) and a pitch of 1.5–2 selected according to the breath holding capabilities of each patient; a reconstruction increment of 1–3 mm; 1 second rotation time; a soft tissue reconstruction algorithm; and 125 mA and 130 kV per slice. The Z axis coverage started 2 cm below the level of the top of the diaphragm to the upper part of the aortic arch, enabling visualisation of the heart and pulmonary arteries up to the subsegmental level. The presence of endoluminal clots was considered diagnostic of pulmonary embolism. Indirect CT signs of RV overload were considered to be present if visual inspection showed dilatation of the right ventricle, superior vena cava or azygos vein enlargement, and the presence of inferior vena cava contrast regurgitation.
Offline helical CTPA image analysis
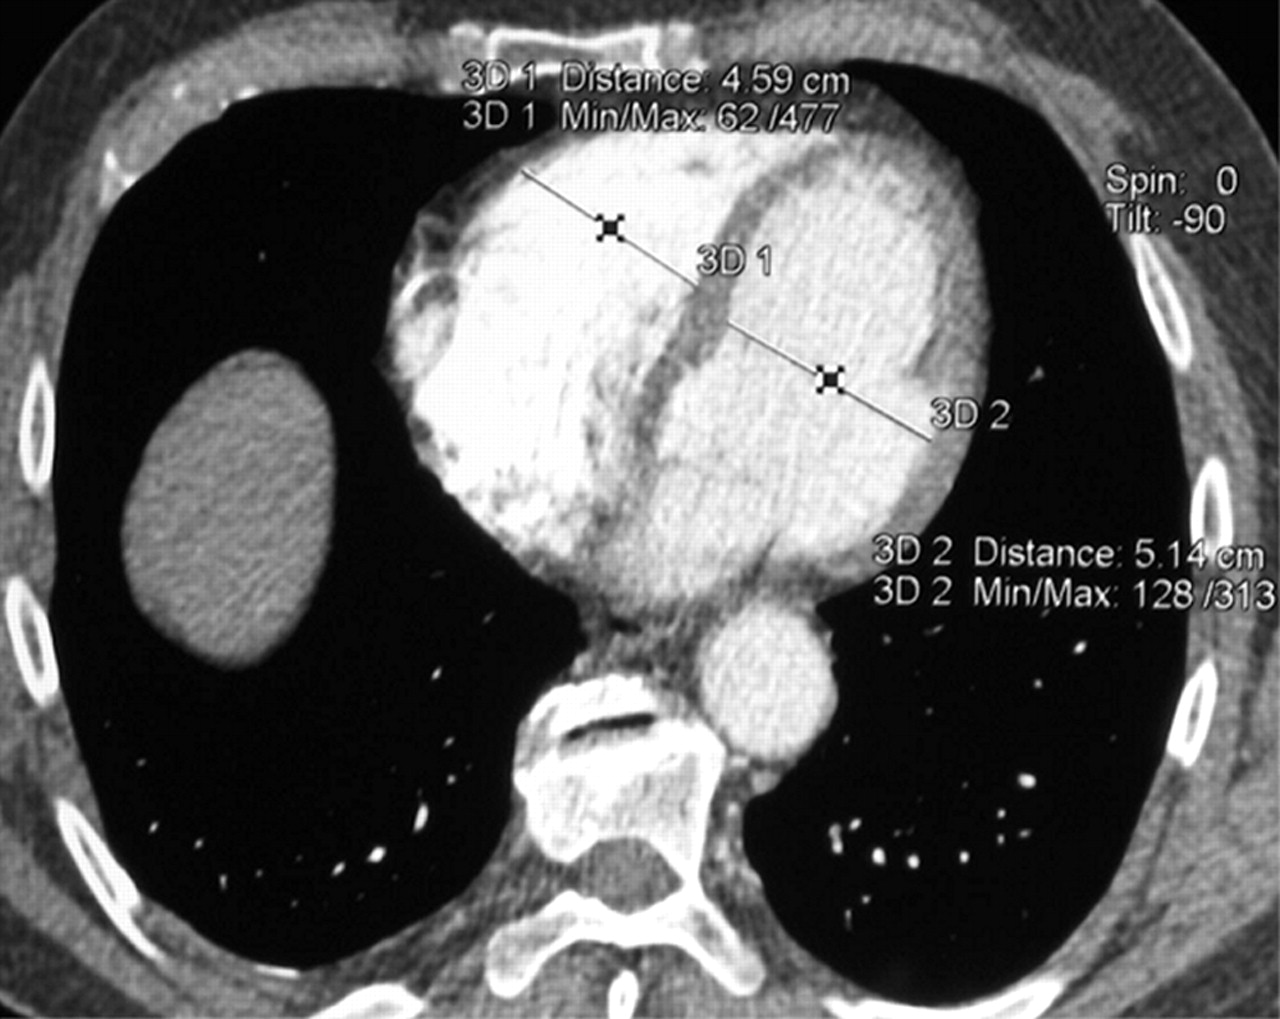
For the purpose of our study, the images were reviewed retrospectively on an independent work station in random order by a team of two experienced senior thoracic radiologists blinded to the corresponding clinical data and short term clinical evolution. Analysis was conducted to gain a more accurate assessment of the clot burden and indices of RV overload. The pulmonary obstruction index was determined according to Qanadli et al.12 RV overload was assessed by considering the following four parameters: right ventricular to left ventricular diameter ratio (RV/LV ratio), superior vena cava diameter, azygos vein diameter, and the presence of inferior vena cava contrast regurgitation. The RV/LV ratio was obtained by computing the ratio between the widths of the right and the left ventricular cavities assessed on axial images obtained at the plane of maximal distance between the ventricular endocardial free wall and the interventricular septum, perpendicular to the long axis (fig 1). The diameter of the superior vena cava was measured at the level of the azygos vein. Contrast regurgitation into the inferior vena cava was scored 1 if present or 0 if undetectable.

Measurement of ventricular dimensions from reconstructed axial view in a patient with acute pulmonary embolism. Right and left ventricular diameters were measured at the largest points in diastole between the inner margins of the interventricular septum and the free wall.
Statistical analysis
The results were expressed as mean (SE) or range when appropriate. Statistical analysis was performed with commercially available software (Statistica; Statsoft Inc, Tulsa, OK, USA). Agreement between the two radiologists was assessed using the method of Bland and Altman.26 Due to the ordinal nature of variables, Spearman’s rank correlation between the results of the two radiologists and between the difference of the two evaluations and their arithmetic means was used.
Correlations between the haemodynamic variables (HR, BP, PAPs) and CT variables (obstruction index, RV/LV ratio, superior vena cava diameter, azygos vein diameter, caval contrast regurgitation) with outcomes or severity were assessed using Kendall’s tau-B correlation coefficient (τb). Kruskall-Wallis analysis was used to compare the distribution of continuous variables in several groups. The χ2 test for homogeneity was used when the variables were nominal.
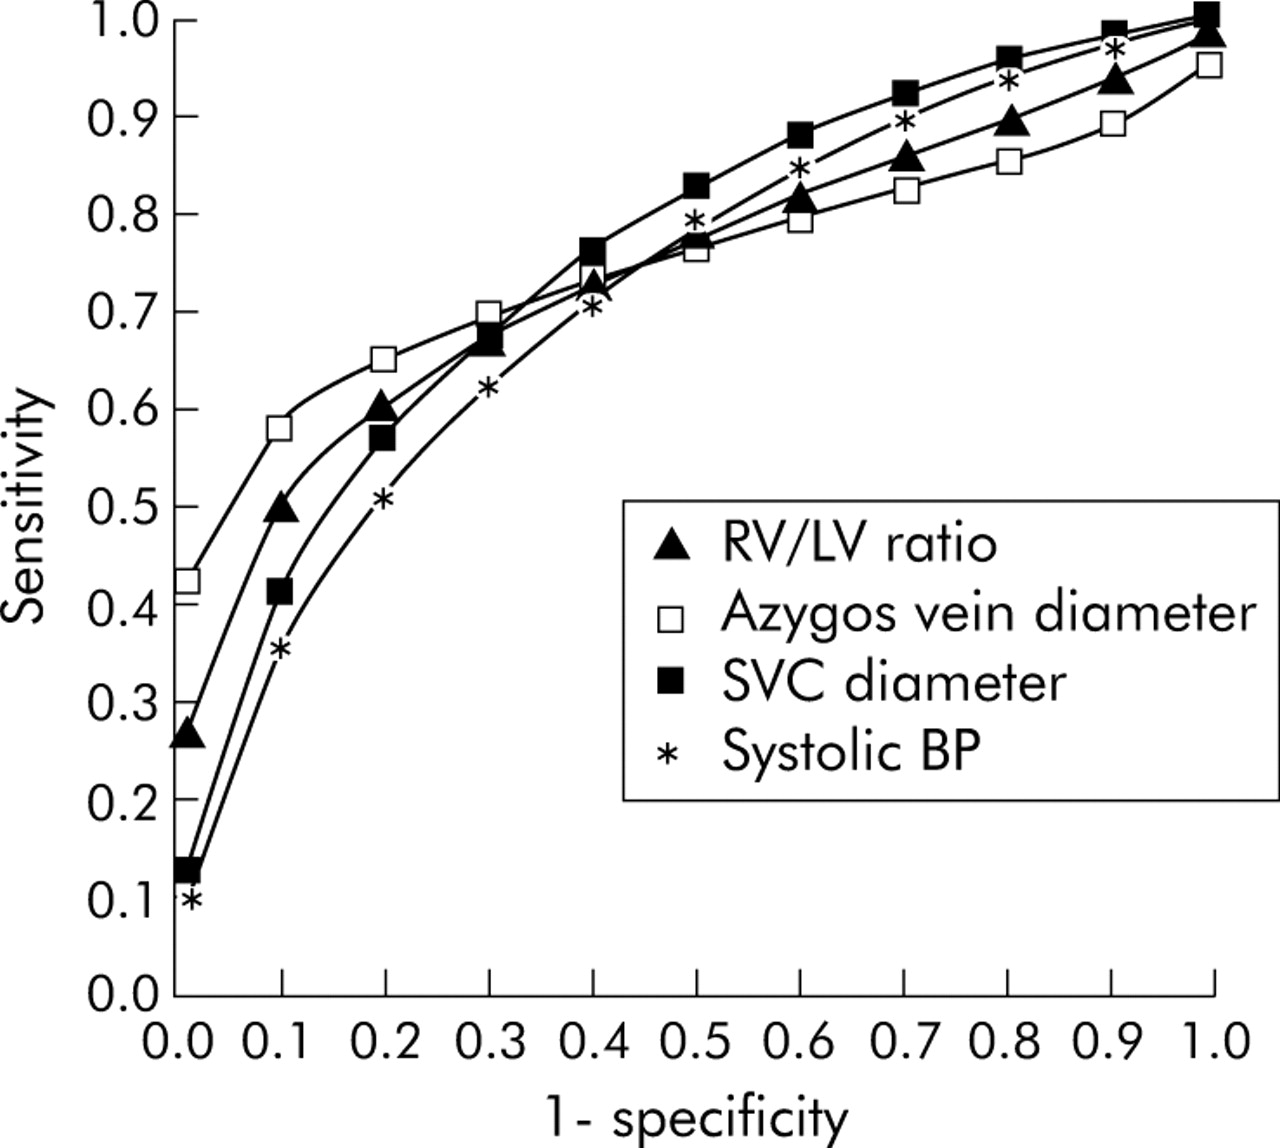
Discriminating variables were submitted to receiver operating characteristic (ROC) analysis for predicting mortality and area under curves (AUC) were calculated and tested for significance (H0: AUC >0.5). For the strongest predictive variables we calculated the thresholds giving equal sensitivity and specificity.27
Finally, predictors that showed a significant relation with mortality subsequently underwent univariate logistic regression analysis to design, for each variable, cut off values associated with a mortality risk of 5%, 10%, 20%, 30%, 40% and 50%. Furthermore, we performed stepwise descending multivariate logistic regressions using clinical and radiological predictors, allowing the progressive selection of the parameters defining the most pertinent model for mortality prediction.
In all cases a p value <0.05 was considered statistically significant.
RESULTS
The clinical characteristics of the patient groups are shown in table 1. There were no statistically significant differences between groups regarding age (p = 0.052), sex ratio (p = 0.77), and presence of coexisting cardiopulmonary diseases (p = 0.42). Regardless of group classification, APE was associated with dyspnoea in 93.9% of cases. In contrast, neither cyanosis nor haemoptysis were consistently present during the actual episode of pulmonary embolism.
Clinical characteristics and symptoms at the time of initial diagnosis
Clinical classification and relation to mortality
Seventy patients (85.4%) survived APE and were discharged from hospital and 12 (14.6%) died. The mean time to death was 5.16 days (range 1–14). Mean hospital stay was 14.6 days (range 1–68) while mean length of stay in the intensive care unit was 5.1 days (range 1–48). Classification of patients according to their clinical presentation at admission was found to be significantly correlated to mortality (p<0.001). There were eight deaths (25%) in the CF group, four (13.8%) in the PD group, and none in the PI group. APE was estimated to have been the cause of death in nine patients (75%) and contributed to death in three (25%). In these patients, APE was associated with severe sepsis (n = 1), post-anoxic encephalopathy (n = 1), and severe haemorrhage (n = 1).
The need for an aggressive therapeutic approach (thrombolysis or surgical embolectomy) was correlated with the clinical severity group classification (p = 0.046). There was no correlation between therapeutic modality and short term prognosis, except for surgical embolectomy which was associated with a worse outcome (p = 0.001).
Haemodynamic data at admission
Heart rate and PAPs were correlated with the severity group classification (p<0.05 and p<0.001, respectively), averaging 105 (3) beats/min and 52 (3) mm Hg in the CF group, 98 (3) beats/min and 48 (3) mm Hg in the PD group, and 97 (5) beats/min and 38 (3) mm Hg in the PI group. The degree of systemic hypotension was correlated with severity (p<0.001), from 135 (4) mm Hg in the PI group to 125 (4) mm Hg in the PD group and 117 (4) mm Hg in the CF group.
Helical CTPA analysis
All CTPA examinations were of excellent quality and selected parameters were assessable in every patient, except for inferior vena cava regurgitation analysis which was only available in 50 patients due to technical factors. The correlation coefficients between the two CT readers were highly significant (Spearman r = 0.65–0.97 depending on the parameter studied; p<0.001). There was no effect of the differences between these two evaluations on the level of the variables studied (r = 0.04–0.19, p<0.001). The mean values of selected CTPA variables that characterised the different clinical groups are shown in table 2.
Mean (SE) helical CTPA findings
Correlation of haemodynamic and radiological variables with clinical classification and outcome
In the univariate analysis all haemodynamic variables and all CT parameters were significantly associated with the severity of the clinical classification (table 3). Regarding prognosis, there was a univariate association between heart rate (p = 0.032) and systolic BP (p<0.001) with mortality. The CT variables indicating right heart strain—including RV/LV ratio (p = 0.002), superior vena cava diameter (p<0.001), azygos vein diameter (p<0.001), and inferior vena cava regurgitation (p = 0.001)—were significantly associated with death. In contrast, neither PAPs (p = 0.84) nor pulmonary obstruction index attained a statistically significant correlation with mortality (p = 0.145). Mean values of variables among survivors and deceased patients are shown in table 4.
Correlation of haemodynamic and CTPA predictors with group classification (severity) and in-hospital mortality
Mean (SE) haemodynamic and radiological variables among survivors and deceased patients
Significant ROC curves are shown in fig 2. The AUC to predict mortality were 0.74 with systolic BP (p = 0.005), 0.64 with heart rate (p = 0.09), 0.66 with obstruction index (p = 0.09), 0.74 with RV/LV ratio (p<0.01), 0.76 with superior vena cava diameter (p<0.005), and 0.77 with the azygos vein diameter (p<0.005). Using 1.46 as the cut off for RV/LV ratio, sensitivity and specificity were equivalent for predicting mortality and reached 69%. An azygos vein diameter of 10.4 mm was associated with mortality at 70% sensitivity and specificity. A superior vena cava diameter of 20.9 mm showed 69% sensitivity and specificity and, similarly, a systolic BP of 117 mm Hg showed 66% sensitivity and specificity to predict mortality.
Receiver operating characteristic (ROC) curves for predicting mortality with right to left ventricular (RV/LV) ratio, azygos vein diameter, superior vena cava (SVC) diameter, and systolic blood pressure (BP).
Logistic regression analysis
Univariate logistic regression using predictors that showed a relation with mortality allowed determination of the critical values of the variables corresponding to increasing mortality risk (table 5). The relative value for predicting outcome was not equivalent for the radiological and clinical variables. In fact, multivariate logistic regression identified systemic arterial pressure as the strongest predictor of mortality among clinical indices with an odds ratio of 0.96 (p = 0.015). This clinical based model allowed correct classification of 84% of the patients (p = 0.004). The performance of this predictive model was significantly improved by introducing the radiological parameters RV/LV ratio and azygos vein diameter into the model (p = 0.0025).
Quantitative parameter threshold values related to mortality risk (logistic regression)
When the prediction model was initially based on radiological indices, RV/LV ratio, and azygos vein diameter, the odds ratio reached 8.64 (p<0.015) and 1.4 (p<0.025), respectively. The model using these two variables allowed correct classification of up to 89% of the patients (p<0.0001). Incorporation of clinical variables into the statistical matrix failed to improve this model (p = 0.16).
DISCUSSION
The results of this study suggest that several CTPA parameters are important for predicting the outcome of patients presenting with APE. In decreasing order of discriminant power, these predictors are RV/LV ratio, azygos vein diameter, superior vena cava diameter, and inferior vena cava contrast medium regurgitation. Analysis of mean differences between survivors and non-survivors failed to demonstrate any significant statistical differences between groups for either PAPs or pulmonary vascular obstruction index.
The current literature is not clear with regard to the possible association between indices of severity of pulmonary arterial obstruction and immediate outcome. Wu et al have recently reported that patients with a pulmonary obstruction score of more than 60% had higher mortality.19 In contrast, Mansecal et al failed to obtain any discriminant correlation between pulmonary haemodynamic data and prognosis.28 Similarly, Araoz et al reported clot burden as a poor predictor of mortality in patients with APE.18 Our results support the latter conclusions: both PAPs and pulmonary vascular obstruction index are significantly correlated with clinical severity but are not useful predictors of mortality.
Our data are consistent with the pathophysiological scheme of APE induced circulatory failure. It should be remembered that the normal pulmonary vascular bed is a low resistive but highly expandable system mechanically coupled with the right ventricle which operates physiologically as a low pressure, volume relaxator.29,30 The cardiovascular effects of an APE must therefore be regarded not only as the result of the degree of pulmonary vascular obstruction but also by the degree to which it requires the right ventricle to function as a high pressure pump.30,31 In other words, failure occurs if the thin right ventricle walls are unsuccessful in compensating for the sudden increase in parietal tension. In our opinion, it is the uncoupling of right ventricular resources from the pulmonary vascular load, rather than obstruction per se, that induces ventricular dilatation and dysfunction. This successively leads to decreased stroke volume, tricuspid regurgitation, reduced venous return, and finally circulatory collapse.4 The lack of knowledge of the point at which the right ventricle is actually operating therefore precludes using only the obstruction index or PAPs to predict potential circulatory failure and subsequent death.
Our CTPA study demonstrates proportional increases in the RV/LV ratio in severely affected patients, which is consistent with the occurrence of RV failure. These observations are in agreement with others in which similar CTPA variables were recognised as providing valuable prognostic information.9,13,20,32 More specifically, Quiroz et al have recently reported that an RV/LV ratio greater than a critical value of 0.9 (obtained by using the reconstructed four-CH view) was associated with a sensitivity of 83.3% and a specificity of 48.7% for predicting adverse events, including not only 30 day mortality but also the need for resuscitation.13 Our data from axial views show that most patients who die rapidly from APE have an RV/LV ratio of more than 1.5 on presentation. We suggest that this threshold value might be useful for predicting in-hospital survival. It is possible that study of abnormalities in the motion of the wall of the right ventricle might be a more powerful predictor of outcome related to APE than the RV/LV ratio. However, neither echocardiography nor CT image acquisition with ECG gating are routinely available in our institution for immediate APE diagnosis. In terms of practical utility for most emergency departments, ungated CT assessment of the RV/LV ratio has the advantage of being simply and rapidly ascertained with only visual inspection of the axial images.9 In addition, our results suggest that the diameters of the superior vena cava and of the azygos vein, as well as the presence of contrast regurgitation from the right heart chambers, are also indicators of both severity and increased risk of mortality. This latter point is, however, rejected by other authors.32 Such a discrepancy may result from differences in the severity of the insult.
Although our data leave open the question of the criteria for thrombolysis in haemodynamically stable patients, our results nevertheless suggest that the RV/LV ratio might be used to recognise those high risk patients who should receive the most aggressive treatment from the outset.
One of the main limitations of our study is its retrospective design. Furthermore, our work was based on the evaluation of a population of selected patients—namely, patients with severe APE, as evidenced by the high pulmonary obstruction index in every group. One may also reasonably assume that pre-existing cardiopulmonary disease might have influenced the clinical expression of APE compared with previously healthy patients suffering from the disease. However, we did not adjust the statistical model for pre-existing cardiac conditions because these patients were equally distributed over the three groups. A larger prospective study with unselected patients should be conducted to evaluate not only the role of CTPA but also of echocardiography and cardiac biomarkers such as troponins or brain natriuretic peptide on assessment of prognosis. Echocardiographic evaluations did not provide quantitative data regarding either cardiac chamber dimensions or assessment of cardiac wall motion, preventing any further analysis or comparisons with CT data of cardiac strain. Finally, ECG ungated CT scanning was probably not as well suited for conducting the cardiac chamber measurements because of the absence of a reference point for diastole in the cardiac cycle. We have therefore assumed that our axial images satisfactorily bisected both ventricles along their maximal diastolic dimensions.
In conclusion, our results suggest that the CTPA obstruction index is not a reliable prognostic factor for in-hospital mortality after APE, especially compared with CT indicators of RV dysfunction. In particular, an RV/LV ratio from axial views above a threshold value of 1.5, together with dilated systemic proximal veins and reflux of contrast material into the inferior vena cava, may be useful for recognising patients with a high mortality risk.
REFERENCES
Footnotes
-
Competing interests: none declared
-
Published Online First 30 August 2005