Article Text

Abstract
Background: Fibrin deposition is a hallmark of pneumonia. To determine the kinetics of alterations in local coagulation and fibrinolysis in relation to ventilator associated pneumonia (VAP), a single centre prospective study of serial changes in pulmonary and systemic thrombin generation and fibrinolytic activity was conducted in patients at risk for VAP.
Methods: Non-directed bronchial lavage (NBL) was performed on alternate days in patients expected to require mechanical ventilation for more than 5 days. A total of 28 patients were studied, nine of whom developed VAP.
Results: In patients who developed VAP a significant increase in thrombin generation was observed in the airways, as reflected by a rise in the levels of thrombin-antithrombin complexes in NBL fluid accompanied by increases in soluble tissue factor and factor VIIa concentrations. The diagnosis of VAP was preceded by a decrease in fibrinolytic activity in NBL fluid. Indeed, before VAP was diagnosed clinically, plasminogen activator activity levels in NBL fluid gradually declined, which appeared to be caused by a sharp increase in NBL fluid levels of plasminogen activator inhibitor 1.
Conclusion: VAP is characterised by a shift in the local haemostatic balance to the procoagulant side, which precedes the clinical diagnosis of VAP.
- ventilator associated pneumonia
- coagulation
- fibrinolysis
- inflammation
- cytokines
- NBL, non-directed bronchial lavage
- PAA, plasminogen activator activity
- PAI-1, plasminogen activator inhibitor type 1
- TATc, thrombin-antithrombin complexes
- TF, tissue factor
- t-PA, tissue type plasminogen activator
- u-PA, urokinase type plasminogen activator
- VAP, ventilator associated pneumonia
Statistics from Altmetric.com
- NBL, non-directed bronchial lavage
- PAA, plasminogen activator activity
- PAI-1, plasminogen activator inhibitor type 1
- TATc, thrombin-antithrombin complexes
- TF, tissue factor
- t-PA, tissue type plasminogen activator
- u-PA, urokinase type plasminogen activator
- VAP, ventilator associated pneumonia
Fibrin deposition is a hallmark of many acute inflammatory lung diseases such as acute lung injury (ALI), acute respiratory distress syndrome (ARDS), and pneumonia.1 Fibrin deposits enhance inflammatory responses by increasing vascular permeability, activating endothelial cells to produce proinflammatory mediators, and eliciting recruitment and activation of neutrophils.2 Eventually, these effects will disrupt normal gas exchange by creating intrapulmonary shunts and ventilation-perfusion mismatches.
Enhanced expression of tissue factor (TF) is a crucial event in the activation of the clotting cascade. Many proinflammatory cytokines have been reported to influence TF expression, such as tumour necrosis factor α-(TNF) and interleukin (IL)-1, IL-6, and IL-8, whereas anti-inflammatory cytokines such as IL-10 inhibit TF expression.3 Tissue type and urokinase type plasminogen activators (t-PA and u-PA) activate the fibrinolytic system. Their main inhibitor is plasminogen activator inhibitor type 1 (PAI-1). Both TNF and IL-1 have been found to exert antifibrinolytic effects by stimulating the release of PAI-1 and by reducing the release of t-PA.3
Severe sepsis and experimental endotoxaemia result in an imbalance between coagulation and fibrinolysis in the circulation, as reflected by an enhanced TF mediated procoagulant response and a concurrent inhibition of fibrinolysis primarily due to increased release of PAI-1.2–4 Similarly, ARDS is associated with enhanced coagulation and suppressed fibrinolytic activity in the alveolar compartment, which predominantly is the consequence of increased local expression of TF and PAI-1, respectively.5,6
Changes in the alveolar haemostatic balance in patients with severe primary pneumonia have recently been described.7 Patients with severe pneumonia requiring mechanical ventilation had alterations in their alveolar haemostatic balance that were very similar to the changes found in patients with ARDS.7 In this study measurements were performed in a single bronchoalveolar lavage (BAL) fluid specimen obtained at variable intervals after the onset of disease.
Interventions aimed at inhibiting fibrin formation have been studied extensively in sepsis in the last decade. In a recent study this strategy was found to reduce the mortality in patients with severe sepsis.8 It remains to be established whether anticoagulant therapy can benefit patients with ALI or pneumonia in a similar way to patients with sepsis. To gain more insight into the processes underlying enhanced fibrin formation during pneumonia, we sought to determine the relationship in time between alterations in local coagulation and fibrinolysis, on the one hand, and the manifestation of ventilator associated pneumonia (VAP) on the other. For this we prospectively and longitudinally monitored changes in thrombin generation and fibrinolytic activity in the airways and circulation of patients at risk for VAP by measuring levels of thrombin-antithrombin complexes (TATc), TF, factor VIIa, plasminogen activator activity (PAA), PAI-1, t-PA, and u-PA in non-directed bronchial lavage (NBL) fluid and plasma.
METHODS
Subjects
Subjects included in the present study are identical to those enrolled in an investigation in which the local expression of cytokines was evaluated.9 Critically ill patients, expected to be in need of mechanical ventilation for more than 5 days, were enrolled into the study. The use of immunosuppressive drugs such as corticosteroids was a criterion for exclusion. The protocol was reviewed and approved by the Central Oxford Regional ethics committee.
Non-directed bronchial lavage (NBL) technique
NBL was performed on admission and on alternate days throughout the period of mechanical ventilation by instilling 20 ml sterile 0.9% saline via a standard 50 cm, 14 gauge tracheal suction catheter as described previously.9–11 In short, the distal end of the catheter was introduced via the endotracheal tube and advanced until significant resistance was encountered. Immediately after instillation over 10–15 seconds, fluid was aspirated before withdrawal of the catheter. Generally, 5–10 ml of fluid was recovered.
Specimen processing
NBL fluid was kept at 4°C until processing, which was performed within 1 hour. The specimen was centrifuged at 1500× g for 15 minutes at 4°C. An aliquot of the supernatant was sent to the microbiology department for semi-quantitative culture as described previously.11 The remaining supernatant was stored at −80°C until assays were performed. Immediately before the lavage procedure blood samples were drawn into sterile Vacutainer tubes containing heparin. Blood samples were centrifuged at 1500× g for 15 minutes at 4°C and the supernatants were stored at −80°C until assays were performed.
Diagnosis of pneumonia
The diagnosis of pneumonia required a combination of the clinical features of VAP together with microbiological confirmation.10–12 The study investigators recorded temperature, peripheral white cell count, quantity and colour of respiratory secretions, and Pao2/Fio2 on each occasion that samples were obtained. Serial chest radiographs were assessed by a specialist chest physician who was unaware of the clinical features or scores. To standardise the reporting of the clinical features of VAP, the clinical variables were scored as a clinical pulmonary infection score (CPIS).10–12 CPIS is a categorical scoring system for clinical data (for example, fever, secretions, white cell count, chest radiography, Pao2/Fio2) supplemented by retrospective criteria such as a clinical course consistent with VAP, absence of other sources of sepsis, or histopathological evidence of VAP (box 1). CPIS was calculated daily for all patients.
Box 1 Criteria for the diagnosis of ventilator associated pneumonia
Pneumonia was confirmed retrospectively either by a clinical pulmonary infection score (CPIS) of >8 and one of the extra criteria or a CPIS of >6 and two of the extra criteria. Pneumonia was not diagnosed in the absence of chest radiograph infiltrates. Subsequent information such as microbiology results, a response to antibiotic treatment, and the absence of alternative sources of sepsis or confirmatory lung histology (when available) was necessary to confirm the diagnosis of pneumonia.
CPIS criteria:
Temperature (°C)
-
⩾36.5 and ⩽38.4 = 0 points
-
⩾38.5 and ⩽38.9 = 1 point
-
⩾39 and ⩽36 = 2 points
Blood leucocytes (mm3)
-
⩾4000 and ⩽11000 = 0 points
-
<4000 or >11000 = 1 point
-
>17000 = 2 points
Tracheal secretions
-
+/− = 0 points
-
+ = 1 point
-
++ = 2 points
Oxygenation: Pao2/Fio2 (kPa)
-
>33
-
⩽33 = 2 points (unless ARDS = 0 point)
Pulmonary radiography
-
Clear = 0 points
-
Diffuse (or patchy) infiltrate = 1 point
-
Localised infiltrate = 2 points
Extra criteria:
-
Clinical course on/off antibiotics consistent with pneumonia.
-
Lack of evidence for alternative source of sepsis within relevant time span.
-
Lung biopsy or post-mortem histology demonstrating pneumonia within relevant time span.
The clinical diagnosis had to be supported by the results of microbiological culture of the NBL fluid. Diagnosis of VAP required either a significant growth (⩾104 CFU/ml) on semiquantitative culture of the NBL fluid or growth of a lower colony count (103 CFU/ml) associated with isolation of the pathogen from the blood. If the study investigators agreed that the clinical, radiological, and microbiological data were consistent with a diagnosis of VAP, then the diagnosis was considered to be confirmed. The day of onset of VAP was taken to be the day that the attending clinicians started antibiotic treatment.
Assays
TATc, TF, PAI-1, and t-PA concentrations were measured using specific commercially available ELISAs according to the instructions of the manufacturer (TATc: Behringwerke AG, Marburg, Germany; TF: American Diagnostics, Greenwich, CT, USA; PAI-1: TintElize PAI-1, Biopool, Umea, Sweden; t-PA: Asserachrom t-PA, Diagnostica Stago, Asnieres-sur-Seine, France). The levels of factor VIIa were determined using a previously described enzyme capture assay for measuring factor VIIa activity.13 Briefly, solid phase bound monoclonal antibodies rose against recombinant factor VIIa (rVIIa) enabled capturing of rVIIa. In the next step, bound rVIIa was allowed to convert a fluorogenic substrate during incubation, which is linearly correlated with rVIIa concentrations. Levels of u-PA were determined by means of ELISA, as described previously.14 PAA was measured by an amidolytical assay.15 Briefly, 25 μl of plasma was mixed to a final volume of 250 μl with 0.1 M TrisHCl, pH 7.5, 0.1% (v/v) Tween-80, 0.3 mM S-2251 (Chromogenix, Mölndal, Sweden), 0.13 M plasminogen, and 0.12 mg/ml CNBr fragments of fibrinogen (Chromogenix, Mölndal, Sweden). The results are expressed as IU/ml.
Assays were performed batchwise to keep inter-assay variability as low as possible. Intra-assay variability of the assays used is low (3–5%).
Statistical analysis
Data on admission (baseline data) from patients in whom VAP was diagnosed were compared with data from patients without VAP using the Student’s t test for parametric data and the Wilcoxon rank sum test for non-parametric data. Data are presented as median with interquartile range (IQR) unless stated otherwise. Data obtained during mechanical ventilation from patients with and without VAP were compared using analysis of repeated measures where the time of admission yielded the start of observation. Changes over time were tested within each group separately using analysis of repeated measures. This was done in a straightforward approach for patients without VAP, but for patients with VAP we considered observations until VAP was diagnosed (including VAP moment). For the analyses of repeated measurements the MIXED procedure of the SAS statistical package was used on logarithmic transformed data. p values of ⩽0.05 were considered to be statistically significant.
RESULTS
Study population
Specimen collection was initiated in 60 patients. The specimens of 32 patients were not analysed because these patients were ventilated for less than 5 days (that is, fewer than three samples were obtained in these patients). None of these patients developed VAP. Ten episodes of VAP occurred in nine of the remaining 28 patients. The mean (SD) time to onset of pneumonia was 9.6 (3.0) days. Patients developing VAP were similar to all patients and to those who did not develop VAP during 5 or more days of mechanical ventilation with respect to age, initial APACHE II scores, and SAPS II scores. Baseline characteristics on admission are shown in table 1 and microbiological data are shown in table 2.
Baseline characteristics of study patients
Microbiological results in patients who developed ventilator associated pneumonia (VAP)
Activation of coagulation in patients with VAP
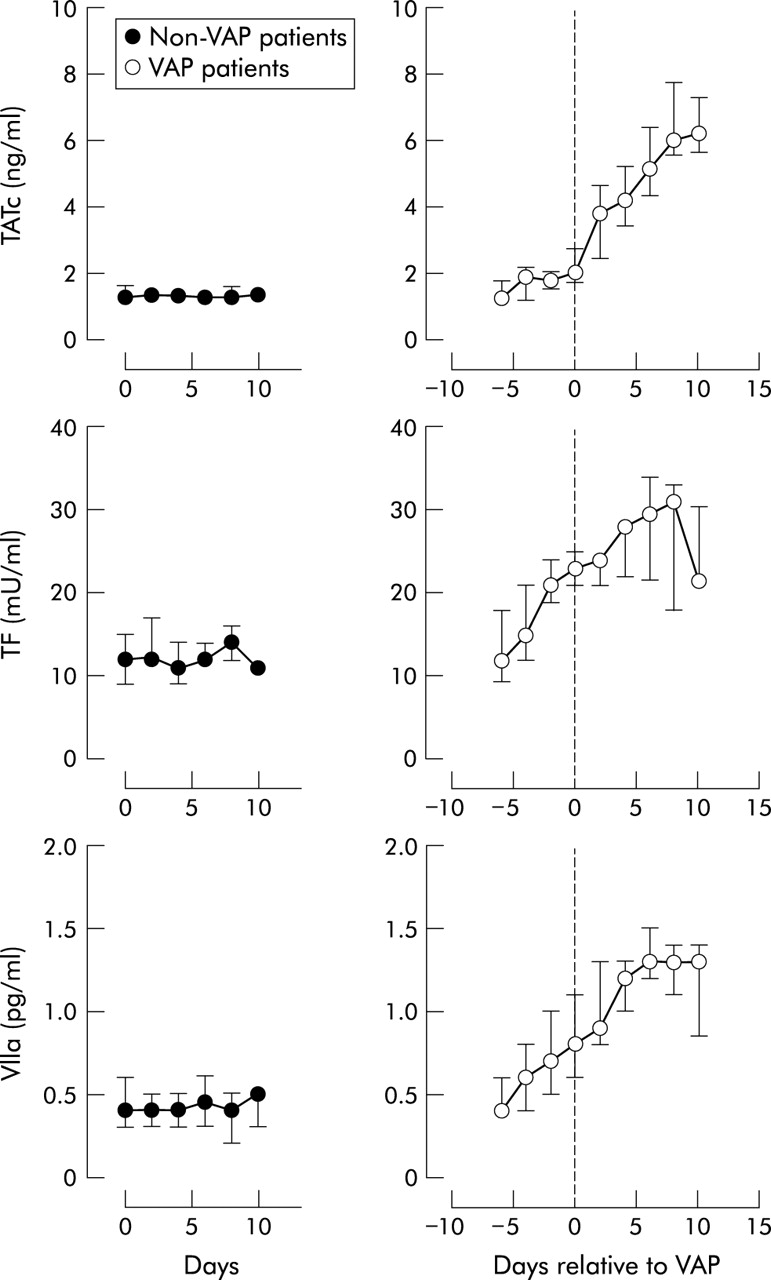
In patients who developed VAP a significant increase in thrombin generation in NBL fluid was observed, as reflected by a rise in TATc levels (p<0.0001; fig 1). TATc levels increased from 1.2 (1.0–1.7) ng/ml before the onset of VAP to a maximum of 6.2 (5.6–7.4) ng/ml 10 days after the diagnosis of VAP. In contrast, in patients who did not develop VAP during the study TATc levels in NBL fluid were stable over time (p<0.001 compared with patients who developed VAP). The increase in TATc levels in NBL fluid was accompanied by a gradual increase in systemic TATc levels in patients with VAP (p = 0.003) which was not detected in non-VAP patients (p = 0.02 compared with patients who developed VAP; table 3). Thrombin generation appeared to be mediated via the TF/factor VIIa pathway, since marked increases were seen in the levels of soluble TF and factor VIIa in NBL fluid. As shown in fig 1, soluble TF levels in NBL fluid increased from 12 (10–18) pg/ml at baseline to a maximum of 31 (18–33) pg/ml 8 days after the diagnosis of VAP (p = 0.0012; fig 1) whereas factor VIIa levels showed a threefold increase from 0.40 (0.40–0.60) mU/ml before the development of VAP to 1.30 (1.20–1.50) mU/ml 6 days after VAP was diagnosed (p<0.0001; fig 1). Levels of soluble TF and factor VIIa in NBL fluid in patients who did not develop VAP remained unchanged over time (p = 0.02 and p = 0.001 v VAP patients).
Plasma TATc and PAA levels in mechanically ventilated patients with and without ventilator associated pneumonia (VAP)

Local activation of coagulation in patients with VAP. Median (interquartile range) concentrations of thrombin-antithrombin complexes (TATc), soluble tissue factor (TF), and factor VIIa levels in non-directed bronchial lavage (NBL) fluid in patients on mechanical ventilation who did not develop VAP are shown in the left panel and in those who developed VAP are shown in the right panel. In patients with VAP day 0 corresponds to the day VAP was diagnosed (for criteria see Methods).
The diagnosis of VAP was preceded by decreased fibrinolytic activity in the NBL fluid. PAA levels in NBL fluid gradually fell from 100 (71–100) IU/ml to 47 (44–59) IU/ml on the day of VAP diagnosis (p<0.0001; fig 2). Lowest levels of PAA in NBL fluid were reached 8 days after the diagnosis of VAP. The fall in PAA levels in NBL fluid was not accompanied by a decrease in systemic PAA levels in patients with VAP (p = 0.07; table 3). The decrease in PAA levels in NBL fluid in VAP patients appeared to be caused by a sharp increase in NBL fluid levels of the fibrinolytic inhibitor PAI-1 which increased from 4.6 (2.8–12.4) ng/ml to 24.5 (19.6–31.0) ng/ml in these patients (p<0.0001; fig 2). Interestingly, most of the increase in PAI-1 levels was observed before the diagnosis of VAP was established. Further analysis of the fibrinolytic system is shown in fig 3 which shows a significant increase in levels of u-PA in NBL fluid (p = 0.0001) while levels of t-PA antigen in the NBL fluid in VAP patients remained unchanged. The changes in PAA, PAI-1 and u-PA levels in NBL fluid did not occur in mechanically ventilated patients who did not develop VAP (p = 0.0003, p = 0.002 and p = 0.02 v VAP patients, respectively). Plasma PAA levels in non-VAP patients increased during mechanical ventilation (p = 0.0003; table 3).
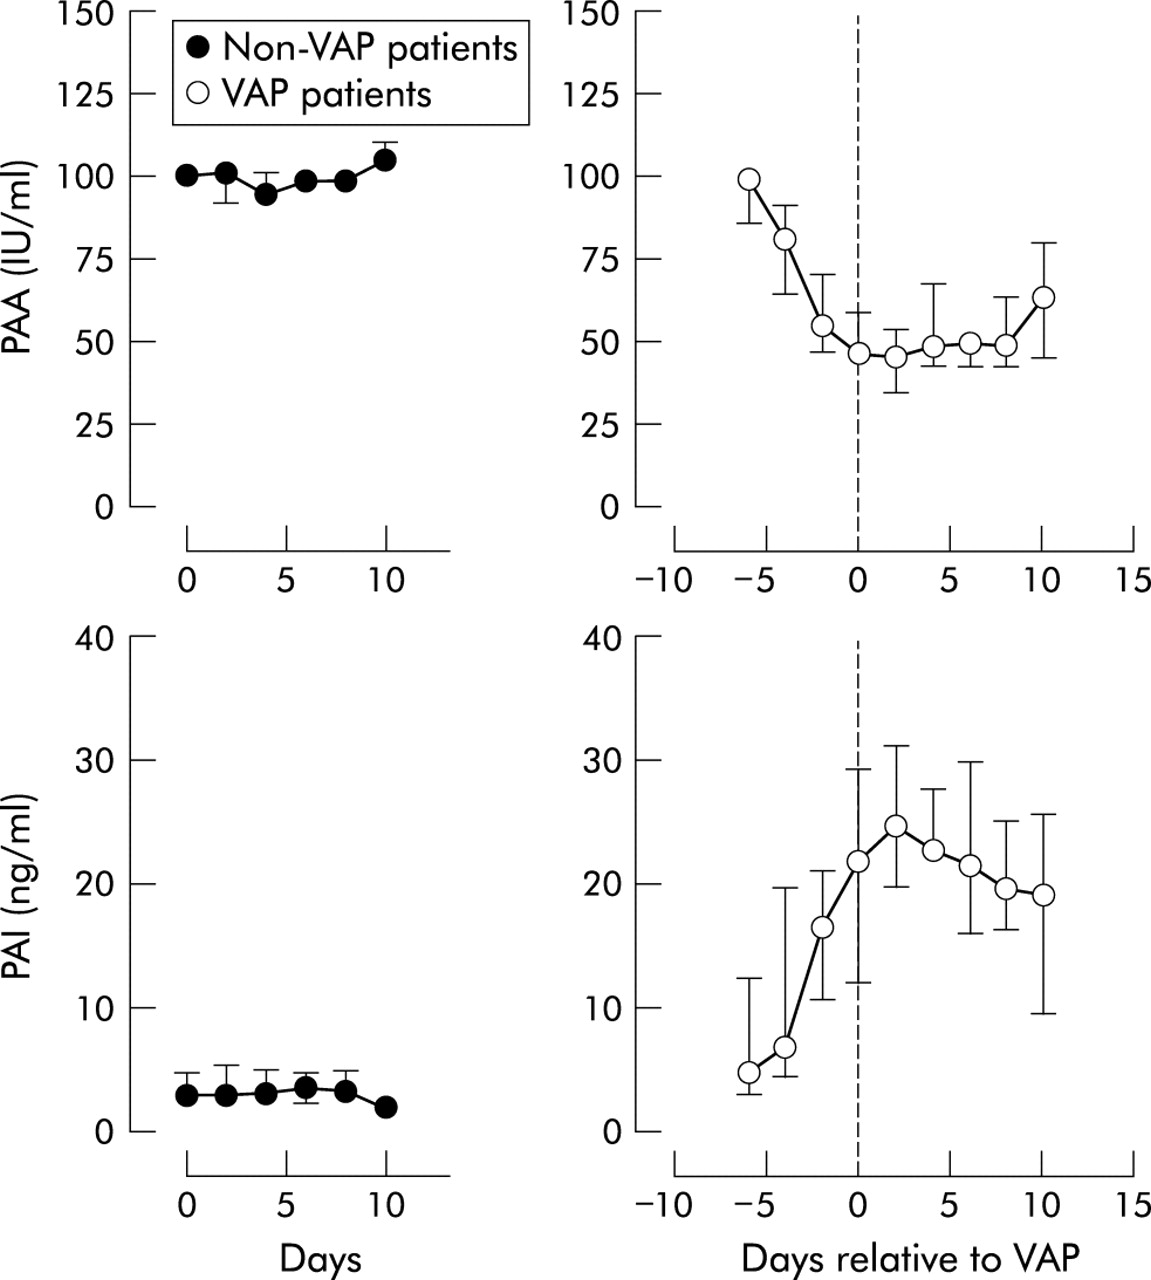
Locally decreased plasminogen activating activity (PAA) and increased plasminogen activator inhibitor (PAI)-1 levels in patients with ventilator associated pneumonia (VAP). Median (interquartile range) concentrations of PAA and PAI-1 in non-directed bronchial lavage (NBL) fluid in patients on mechanical ventilation who did not develop VAP are shown in the left panel and in those who developed VAP are shown in the right panel. In patients with VAP day 0 corresponds to the day VAP was diagnosed (for criteria see Methods).

Increased local urokinase type plasminogen activator (u-PA) levels but not tissue type plasminogen activator (t-PA) levels in patients with ventilator associated pneumonia (VAP). Median (interquartile range) concentrations of u-PA and t-PA in non-directed bronchial lavage (NBL) fluid in patients on mechanical ventilation who did not develop VAP are shown in the left panel and in those who developed VAP are shown in the right panel. In patients with VAP day 0 corresponds to the day VAP was diagnosed (for criteria see Methods).
DISCUSSION
In the present study, undertaken in 28 mechanically ventilated patients of whom nine developed VAP, marked disturbances in the haemostatic balance in the airways were found. Patients with VAP had a dramatic increase in procoagulant activity, as reflected by a rise in TATc levels in the NBL fluid, and a concomitant depression of fibrinolysis, as reflected by a gradual fall in NBL fluid levels of PAA. Interestingly, the increase in procoagulant activity and especially the depression of fibrinolysis were present before the clinical manifestation of VAP. Furthermore, in patients who did not develop VAP, neither the coagulant pathway nor the fibrinolytic pathway was influenced during the observation period. Unfortunately the groups were too small to draw any firm conclusion on differences between pneumonia caused by different pathogens. Larger groups are needed to establish whether any differences between respiratory pathogens exist with regard to their capacity to influence the alveolar haemostatic balance.
Pulmonary activation of coagulation and inhibition of fibrinolysis are also seen in other pulmonary conditions such as ALI and ARDS.7 However, none of the patients in our study suffered from these conditions.
Patients who developed VAP during mechanical ventilation were compared with those who did not develop VAP. The two groups were comparable in age, severity scores, and in the reason for mechanical ventilation. In order to make a controlled comparison of changes around the time VAP was diagnosed, we should have created a non-VAP group who had been on mechanical ventilation for a similar length of time by including a control group on ventilation at this time. This would have enabled us to make direct comparisons between the two groups around the time at which the patients developed VAP. Unfortunately the design of the study did not allow this: we have studied the changes from the start of mechanical ventilation in the control group and the changes around the time of VAP for the VAP group. However, when the changes over time were studied separately within the two groups, we found few changes over time from start of mechanical ventilation in the non-VAP group but a change around the time of VAP diagnosis for the case group. This is not truly a controlled analysis, but clearly demonstrates differences between the two groups.
Our results support those of previous studies in finding increased procoagulant activity in the alveolar space in patients with pneumonia.7,16,17 Günther et al recently found pronounced disturbances in the alveolar haemostatic balance in patients with severe pneumonia, both spontaneously breathing and those needing mechanical ventilation.7 The procoagulant activity in BAL fluid, which was accompanied by a local depression of fibrinolytic capacity, was comparable to that in BAL fluid from patients with ARDS triggered by extrapulmonary causes. Interestingly, procoagulant activity in spontaneously breathing patients with pneumonia was increased less, but was still higher than in healthy controls. Similarly, alveolar fibrinolytic activity in patients with ARDS, ARDS with pneumonia, and pneumonia alone was depressed compared with healthy controls. In contrast to procoagulant activity, fibrinolytic activity in the BAL fluid of spontaneously breathing patients and mechanically ventilated patients with pneumonia were comparable.
Our data suggest that activation of coagulation (through activation of the TF pathway) and a reduction in PAA (through upregulation of PAI-1) are the mechanisms responsible for the appearance of fibrin in the alveolar space during pneumonia. These findings are in line with those of Günther et al.7 However, here we show that both local activation of coagulation and local inhibition of fibrinolysis precede the clinical diagnosis of VAP. Indeed, several days before the diagnosis of VAP both TF and factor VII levels were increased in the NBL fluid, concomitantly with a rise in PAI-1 levels in the airway. Levels of TF, factor VIIa, and PAI-1 remained raised for several days in patients with VAP. A corresponding increase in u-PA was found in the patients developing VAP. u-PA is the major plasminogen activator of alveolar macrophages. The origin of t-PA in alveoli is not yet established, but the discrepancy between t-PA levels and u-PA levels suggests another cellular source. Notably, the u-PA antigen assay detects inactive (single chain) u-PA as well as active (two chain) u-PA in complex with PAI-1. Our findings therefore indicate that NBL fluid levels of u-PA are increased in the respiratory tract during VAP but that the resulting potential increase in fibrinolytic activity is completely blocked by the increase in NBL fluid levels of PAI-1.
One potential limitation of the study is whether samples obtained in these patients adequately reflect changes in fibrin formation in the alveoli. Only specimens from the larger airways are obtained by NBL, and this might not reflect changes in the smaller airways and alveoli. A second potential limitation is that this study does not give insight into whether local changes in coagulation and fibrinolysis can be considered detrimental or beneficial for the host. Although representing a precondition for secondary reparative processes, regional upregulation of TF and factor VIIa and concomitant inhibition of fibrinolysis, which results in persistent deposition of fibrin in the alveolar compartment during pneumonia, may contribute to functional impairment of the lungs. Fibrin is an important inhibitor of surfactant function which may result in alveolar collapse and pulmonary shunting.18,19 Moreover, alveolar deposition of fibrin might promote invasion of fibroblasts leading to irreversible loss of alveolar spaces because of scarring. Further (animal) studies are needed to resolve this issue.
It is possible that the changes in coagulation and fibrinolysis found in the pulmonary compartment (as measured in the NBL fluid) are the result of leakage from the system. Indeed, we also observed increased activation of coagulation in the systemic compartment. However, we favour the opinion that activation of coagulation and inhibition of fibrinolysis is a local process for the following reasons: (1) although there was systemic activation of coagulation, systemic inhibition of fibrinolysis did not occur in our study; (2) with the used lavage technique there is a more than 100-fold dilution of alveolar concentrations, so levels of coagulation and fibrinolysis markers were much higher in the pulmonary compartment than systemic levels; (3) our laboratory recently demonstrated local production of PAI-1 and TF within the pulmonary compartment during experimentally induced pneumonia in mice.20
In conclusion, disturbances in the local haemostatic balance were found in mechanically ventilated patients who developed VAP. There was a marked increase in procoagulant activity, with a rise in TF and factor VIIa, together with an inhibition of local fibrinolysis, with a rise in PAI-1 levels, before the diagnosis of VAP was made clinically. These data suggest that a shift in the haemostatic balance in the lungs towards a procoagulant state is an early feature of VAP.
Acknowledgments
The authors thank Carolyn I Mackinlay, specialist chest physician, for the evaluation of serial chest radiographs.
REFERENCES
Footnotes
-
This study was funded in part by the Oxford Health Services Research Committee (research project number 593).
Linked Articles
- airwaves