Article Text

Abstract
Background: Signalling of angiotensin II via angiotensin II type 1 receptor (AT1) promotes cardiac and renal fibrosis, but its role in lung fibrosis is little understood. Using a rat bleomycin (BLM) induced model of pulmonary fibrosis, we examined the expression of AT1 in the lung and the effect of an AT1 antagonist on pulmonary fibrosis.
Methods: Adult male Sprague-Dawley rats were given 0.3 mg/kg BLM intratracheally. Two days earlier they had received 10 mg/kg/day of the AT1 antagonist candesartan cilexetil mixed in the drinking water. AT1 expression in the lungs was examined by immunohistochemistry and immunoblot methods. The effect of the AT1 antagonist on pulmonary fibrosis was studied by analysis of bronchoalveolar lavage (BAL) fluid, histopathology, and hydroxyproline assay.
Results: Immunohistochemical studies showed overexpression of AT1 in inflammatory immune cells, alveolar type II cells, and fibroblasts. A quantitative assay for AT1 showed that AT1 expression was significantly upregulated in cells from BAL fluid after day 3 and in the lung homogenates after day 21. Candesartan cilexetil significantly inhibited the increase in total protein and albumin, as well as the increase in total cells and neutrophils in BAL fluid. On day 21 candesartan cilexetil also ameliorated morphological changes and an increased amount of hydroxyproline in lung homogenates. In addition, BLM increased the expression of transforming growth factor (TGF)-β1 in BAL fluid on day 7; this increase was significantly reduced by candesartan cilexetil.
Conclusion: AT1 expression is upregulated in fibrotic lungs. Angiotensin II promotes lung fibrosis via AT1 and, presumably, in part via TGF-β1.
- angiotensin II type 1 receptor
- candesartan cilexetil
- pulmonary fibrosis
Statistics from Altmetric.com
Angiotensin II, which is mainly generated by angiotensin converting enzyme (ACE) and chymase, is a peptide that plays a crucial role in regulating blood pressure and sodium homeostasis via specific receptors including angiotensin II type 1 receptor (AT1).1 Candesartan cilexetil is an AT1 selective antagonist and is widely used for the treatment of hypertension.2 Recent studies have shown that angiotensin II is also closely associated with tissue injury and fibrogenesis in circulatory organs. The administration of candesartan cilexetil significantly attenuates injury and fibrosis in injured heart models in vivo.3,4 Angiotensin II has been reported to promote the proliferation and collagen synthesis of cardiac fibroblasts inhibited by AT1 antagonists.5–7 Candesartan cilexetil was found to inhibit peroxide production derived from macrophages.8 These results indicate that angiotensin II activates fibroblasts and macrophages by signalling via AT1, resulting in clinical findings of heart injury and fibrosis.
The process of fibrosis is also important in the lung since its progression may result in respiratory failure and a poor prognosis in patients with various types of interstitial lung disorders. The progression of fibrosis is closely related to a complicated network consisting of many cytokines, chemical mediators, growth factors, and biophysical peptides derived from inflammatory immune cells, endothelial cells, and alveolar type II cells. As a member of this network, a pathway via angiotensin II has been reported to be associated with pulmonary fibrosis. A high concentration of ACE has been observed in bronchoalveolar lavage (BAL) fluid from patients with idiopathic pulmonary fibrosis.9 In an animal model of radiation induced pulmonary fibrosis, concentrations of ACE and angiotensin II were increased in lung tissue homogenates.10 These studies suggest that the process of pulmonary fibrosis is promoted by a local renin-angiotensin system in the lung. Evidence that AT1 is localised not only in the heart and kidney but also in the lung11,12 reinforces this suggestion. Human lung fibroblasts were increased by stimulation of angiotensin II with AT1.13 The ACE inhibitor attenuated bleomycin (BLM) induced pulmonary fibrosis.14 Administration of an AT1 antagonist significantly attenuated radiation induced pulmonary fibrosis.15 Taken together, the evidence from these studies suggests that angiotensin II is an important factor in the promotion of pulmonary fibrosis, and AT1 is an important receptor for transmission of its signalling. However, the relationship between the expression of AT1 and the effect of AT1 antagonists in the injured lung in vivo is not clear.
Transforming growth factor (TGF)-β1 is a key multifunctional cytokine in many fibrotic diseases. Angiotensin II is closely associated with TGF-β1 production in cardiac and renal fibrosis,16–18 which suggests that angiotensin II leads to fibrosis in these models through acceleration of TGF-β1 synthesis via AT1. TGF-β1 also acts as a principal fibrogenic mediator in the lung.19–21
The aims of this study were (1) to clarify whether the expression of AT1 in the lung increases with the progression of fibrosis and, if so, whether candesartan cilexetil attenuates the fibrosis and (2) to determine how it is associated with the cytokine network including TGF-β1. Using a rat model of pulmonary fibrosis generated by BLM with/without candesartan cilexetil, we examined the relationship between morphological changes, hydroxyproline content, number of inflammatory immune cells in BAL fluid, and the expression of TGF-β1 and AT1 in the lung tissues.
METHODS
Animals and preparation of BLM induced pulmonary fibrosis
Adult male Sprague-Dawley rats weighing 200–220 g (Sankyo Lab, Tokyo, Japan) were anaesthetised and 0.3 mg/kg BLM (Nippon Kayaku, Tokyo, Japan) in 0.5 ml sterile saline or 0.5 ml of sterile saline (vehicle control) were administered intratracheally. Two days before the administration some rats received 10 mg/kg/day candesartan cilexetil (Takeda Chemical Industries, Tokyo, Japan) dissolved in the drinking water. Rats were divided into four groups as follows: BLM alone, BLM + candesartan, saline alone, and saline + candesartan. The rats were killed on days 0, 1, 3, 7, 14, or 21 (n = 4–6 for each group and time point). The lungs were lavaged five times with 7 ml saline and the lavage fluids were centrifuged at 250g for 10 minutes to separate the cells and the supernatants. A total cell count was performed with a haemocytometer and differential cell counts were performed on cytospin preparations stained with Wright-Giemsa. Two hundred cells were counted for determination of the differential cell count. The supernatants, resuspended pellets, and lavaged lung tissues were stored at −30°C.
Histopathology
Rats from each group were killed on days 0, 3, 7, 14, 21 and 10% buffered formalin was intratracheally instilled into the lungs. Lung tissue was embedded in paraffin and lung sections were stained with haematoxylin and eosin for examination by light microscopy.
Immunohistochemistry
Immunohistochemical analysis of AT1 using specific antibody was performed by the avidin-biotin complex (ABC) technique. Paraffin embedded lung sections were dewaxed with xylene, hydrated, and heated at 121°C for 15 minutes in a steam steriliser in 10 mM citrate buffer for antigen retrieval. Endogenous peroxidase activity was quenched by the addition of 0.3% (vol/vol) hydrogen peroxide in methanol for 30 minutes. The slides were first blocked with 1% goat serum in phosphate buffered serum (PBS) for 30 minutes. Polyclonal rabbit anti-human AT1 antibody (Santa Cruz Biotech, Santa Cruz, CA, USA) was used for the immunostaining. For negative controls, non-specific rabbit IgG was used. The antibodies were used at a dilution of 1:200 (AT1) in PBS. The sections were incubated for 60 minutes with the antibody at room temperature in a moist chamber. Biotinylated anti-rabbit goat IgG was incubated with the sections for 30 minutes and with ABC solution for 30 minutes (Vector, Burlingame, CA, USA). Immunoreactivity was detected by the addition of 0.5 mg/ml diaminobenzidine and 0.01% hydrogen peroxide in 50 mM Tris buffer solution. Between each step the sections were washed three times with PBS over a period of 15 minutes. The sections were counterstained with haematoxylin, dehydrated, and mounted.
Western blot and dot blot analysis of AT1
Lung homogenates were centrifuged at 600g for 20 minutes at 4°C and the resultant supernatants were subjected to Western blot analysis, according to the method of Towbin and colleagues (n = 5).22 Cell samples from BAL fluid were sonicated for 15 seconds at room temperature and then subjected to dot blot analysis (n = 5). For Western blot analysis, an aliquot of 10 μg homogenate was placed in sample buffer (4% sodium dodecylsulfate, 125 mM Tris-HCl, pH 6.8, 1% β-mercaptoethanol, 50% (vol/vol) glycerol, and 0.01% (wt/vol) bromophenol blue) and denatured at 100°C for 10 minutes. The homogenate samples were electrophoresed and transferred onto a nitrocellulose membrane overnight. For dot blot analysis, 1 μg of cells from the BAL fluid was mounted on a nitrocellulose membrane and air dried. Both membranes were blocked by PBS containing 2% skimmed milk and 0.1% Tween-20 for 1 hour. The membranes were washed in 0.1% Tween-20 in PBS twice for 5 minutes each. Incubation with primary antibody (anti-AT1 polyclonal antibody diluted 1:1000 by Tween-20-PBS) was performed for 1 hour at room temperature. After washing the membranes were incubated with secondary antibody conjugated with horseradish peroxidase (anti-rabbit IgG 1:1000 dilution) for 1 hour. The membrane was then subjected to a chemiluminescence detection system (Amersham Pharmacia Biotech, Buckinghamshire, UK) and exposed to x ray film. Densitometric analysis was performed using the NIH image program (http://rsb.info.nih.gov/nih-image/).
Hydroxyproline assay
Frozen lung tissues were homogenised by a polytron tissue homogeniser in saline containing 0.1 M phenylmethylsulfonylfluoride. The homogenised sample (n = 6) was hydrolysed in 6 N HCl and the hydroxyproline concentration was determined according to the method of Kivirikko et al.23
Protein and albumin assay
The protein concentration in BAL fluid was measured using the bicinchoninic acid (BCA) method (Pierce Chemical, Rockfold, IL, USA) (n = 4–6). The albumin concentration in BAL fluid was measured using bromcresol green (BCG) solution (Sigma Co, St Louis, MO, USA) (n = 4 or 5).
Measurement of TGF-β1 in BAL fluid
BAL fluid samples underwent acidification to convert the latent TGF-β1 to an active form. 1 N HCl was used followed by neutralisation with 1 N NaOH. Total (latent and active form) TGF-β1 levels were measured using a quantitative sandwich enzyme immunoassay kit (Promega, Madison, WI, USA). All samples were assayed in duplicate (n = 4–6).
Statistical analysis
The results are expressed as mean (SD) with mean difference and 95% confidence intervals (CI) between groups and from day 0. Statistical analysis was carried out by one way or two way analysis of variance (ANOVA) followed, when differences were significant, by appropriate post hoc tests using the Tukey-Krammer tests. p values of <0.05 were considered to be statistically significant.
RESULTS
Histopathology
After intratracheal administration of BLM, the histopathological changes in the lung were evaluated on days 0, 3, 7, 14, and 21. On day 3 infiltration of neutrophils and macrophages into the alveolar walls and spaces was seen, together with thickening of the alveolar interstitium. These changes were most prominent on day 7. On days 14 and 21 the number of inflammatory cells was small while fibroblasts were numerous, and a mild collagenous deposit with interstitial thickening was observed in the alveolar walls (fig 1C). Daily oral administration of candesartan cilexetil resulted in moderate amelioration of inflammatory cell infiltration by day 7, together with a marked reduction in interstitial thickening by BLM on day 21 (fig 1D).

Histopathological findings on day 21 after administration of bleomycin (BLM). The groups given saline alone (A) and saline + candesartan (B) had a normal alveolar structure. The group given BLM alone (C) had marked alveolar thickening and diffuse fibrotic changes with cellular infiltration, while the group given BLM + candesartan (D) had reduced alveolitis and fibrotic changes. Bar = 50 μm.
Immunohistochemistry of AT1
The expression of AT1 in the lungs of the four groups was immunohistochemically analysed on day 21. In the lungs of rats in the saline alone group specific immunoreactivity was observed in alveolar macrophages, alveolar type II cells, endothelial cells, and bronchial epithelial cells (fig 2A). AT1 positive capillary endothelial cells, interstitial macrophages, and fibroblasts were also observed in fibrotic lesions in lungs from the BLM alone group (fig 2B). The intensity and extent of immunoreactivity did not differ between the BLM alone group and the BLM + candesartan group (data not shown). Negative controls were unstained in all specimens (fig 2C and D).

Immunohistochemical study of angiotensin II type 1 receptor (AT1) in (A, C) the saline alone group on day 0, and (B, D) the BLM alone group on day 21. Immunostaining was performed using (A, B) polyclonal rabbit anti-human AT1 antibody and (C, D) non-specific rabbit IgG. Normal lung section showed specific immunoreactivity in alveolar macrophages, alveolar type II cells, endothelial cells, and bronchial epithelial cells (A). Injured lung sections showed labelling of infiltrated capillary endothelial cells and fibroblasts in the thickened alveolar interstitium (B). The negative controls were unstained in all specimens (C, D). Bar = 25 μm.
Comparative quantification of AT1
The level of AT1 expression in the BLM alone group was measured in lung homogenates and BAL fluid cells by Western blot and dot blot analysis, respectively. In lung homogenates on days 0, 3, 7, 14, and 21, anti-AT1 antibody recognised a protein with an apparent molecular mass of 46 kDa which is identical to that of AT1 according to Harrison-Bernard et al24 (fig 3A). The time course of AT1 expression in both the lung homogenates and BAL fluid cells was significantly different (p<0.01, p = 0.01, one way ANOVA). AT1 expression increased from day 14 (fig 4A), reaching a peak on day 21 (55.1 (10.9) × 103, mean difference 40.0 × 10³ (95% CI 27.3 × 10³ to 52.6 × 10³, p<0.05). A similar increase in AT1 expression was observed in BAL fluid cells but the peak level occurred on day 3 (22.0 (7.13) × 103, mean difference 17.1×10³ (95% CI 9.31 × 10³ to 24.9 × 10³, p<0.05), much earlier than in lung homogenates (figs 3B and 4B).

Typical immunoblot profiles of angiotensin II type 1 receptor (AT1) in rats following intratracheal administration of bleomycin (BLM), n = 5. (A) Western blot analysis of AT1 expression in lung homogenates at days 0, 3, 7, 14, and 21 after BLM. Anti-AT1 polyclonal antibody recognised the protein with an apparent molecular mass of 46 kDa, which is identical to AT1 reported by Harrison-Bernard et al.24 The band on the left in each panel shows the control on day 0. BLM increased the expression of AT1 on days 14 and 21 compared with day 0 (n = 5). (B) Dot blot analysis of AT1 expression in BAL fluid cells. BLM administration resulted in an increase in the expression of AT1 which was maximal on day 3 (n = 5).

Change in density of angiotensin II type 1 receptor (AT1) expression after administration of bleomycin (BLM) in rats (n = 5). The densitometric intensity of each immunoreactive band or spot exposed to x ray film was analysed using the NIH imaging program. Significant differences between time points were seen in both lung homogenates and BAL fluid cells (p<0.01, p = 0.01, respectively, one way ANOVA). In lung homogenates (A) the increase in AT1 expression began on day 14 and reached a peak on day 21. In BAL fluid cells (B) AT1 expression had increased rapidly by day 3 and then declined gradually until day 21. Data were corrected to the mean value for day 0 and are shown as mean (SD). *p<0.05 compared with day 0.
Hydroxyproline content of lung tissue
A significant increase in the concentration of hydroxyproline in lung tissue was observed on days 14 and 21 in the BLM alone group but no such increase was seen in the saline alone group. The concentrations for all four groups on day 21 are shown in fig 5. The levels were found to be significantly different in the four groups (p<0.01, one way ANOVA). In the BLM alone group the increase in hydroxyproline content (4.83 (0.97) mg/lung) was almost double that in the saline alone group (2.35 (0.71) mg/lung, mean difference 2.49, 95% CI 1.53 to 3.45, p<0.05) and the saline + candesartan group (2.46 (0.41) mg/lung, mean difference 2.38, 95% CI 1.36 to 3.39, p<0.05). This increase was significantly blocked by candesartan cilexetil (BLM + candesartan group: 3.28 (0.57) mg/lung, mean difference 1.56, 95% CI 0.59 to 2.53, p<0.05).
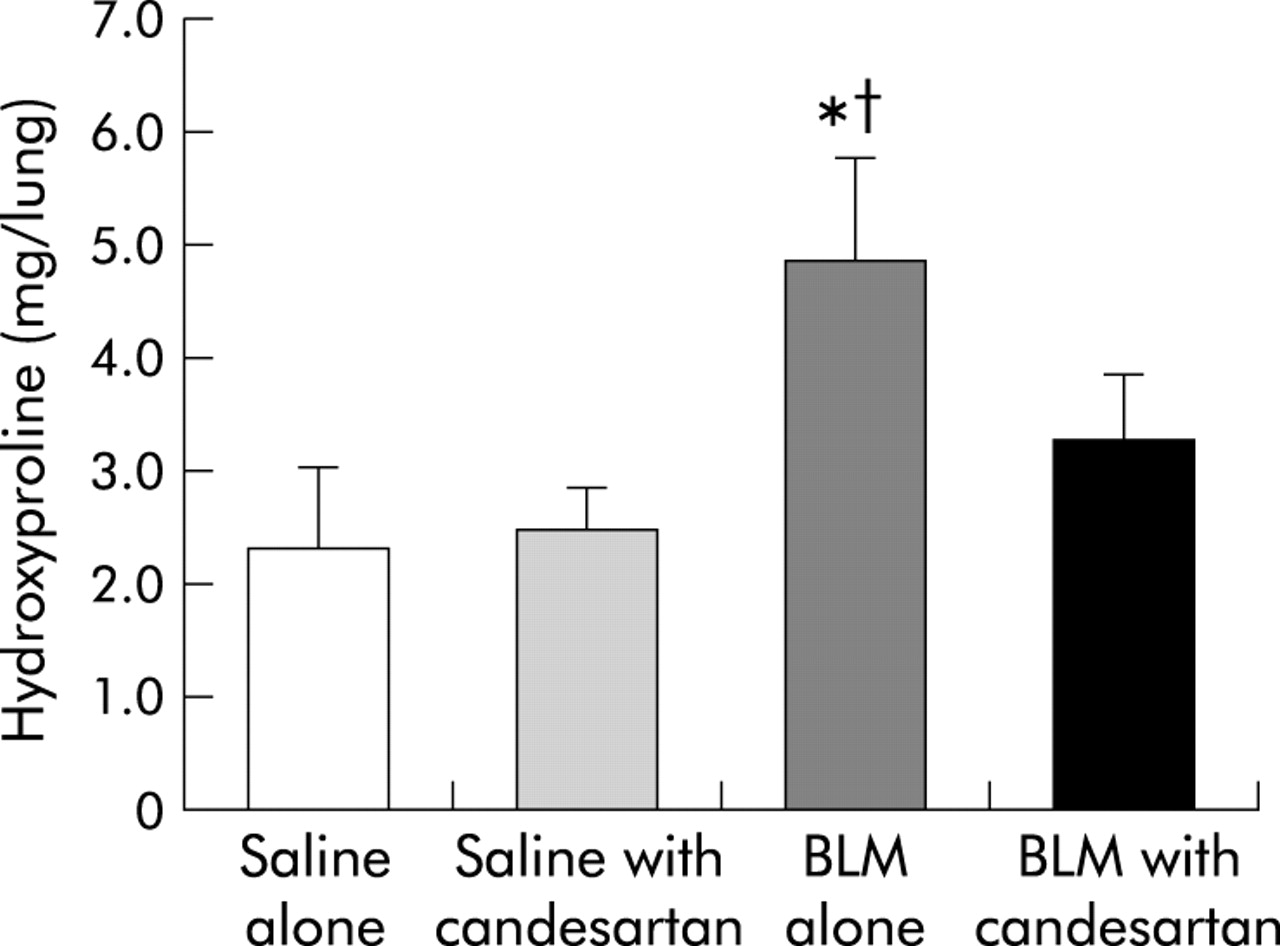
Comparison of hydroxyproline concentration in lung homogenates on day 21 in the four groups (n = 6): saline alone, saline + candesartan cilexetil, bleomycin (BLM) alone, and BLM + candesartan cilexetil. The concentrations were found to be significantly different in the four groups (p<0.01, one way ANOVA). The BLM alone group had a significantly increased hydroxyproline concentration on day 21. Candesartan cilexetil significantly reduced the increase in hydroxyproline content caused by the administration of BLM. Data are shown as mean (SD). *p<0.05 v saline alone group; †p<0.05 v BLM + candesartan group.
BAL fluid cells
Recovery rates of BAL fluid ranged from 83% to 100% and were not significantly different between the four groups. Neither the saline alone group nor the saline + candesartan group showed any significant difference in total cell numbers or differential cell counts during the 21 days. A significant difference in total cell number, neutrophils, and alveolar macrophages was seen between the BLM alone group and the BLM + candesartan group (p<0.01, p<0.01, p<0.01, respectively, two-way ANOVA; fig 6). A significant difference was also seen between time points from day 0 to day 21. A post hoc test showed that BLM induced a significant increase in mean (SD) total cell counts on days 3, 7, and 14 (day 3: 462 (126) × 103/ml, mean difference 359 × 103, 95% CI 224 × 103 to 495 × 103, p<0.05; day 7: 589 (127) × 103/ml, mean difference 486 × 103, 95% CI 350 × 103 to 623 × 103, p<0.05; day 14: 396 (92.9) × 103/ml, mean difference 294 × 103, 95% CI 191 × 103 to 397 × 103, p<0.05) compared with baseline levels at day 0 (102 (36.3) × 103/ml; fig 6A). The maximal cell number was observed on day 7. Candesartan cilexetil significantly inhibited the increase on day 7 (342 (35.0) × 103/ml, mean difference 247 × 103, 95% CI 111 × 103 to 383 × 103, p<0.05). The major cellular components of the increase were neutrophils and alveolar macrophages.

Change in (A) total cell count, (B) neutrophils, and (C) alveolar macrophages in BAL fluid during the 21 days following administration of bleomycin (BLM) and the effect of candesartan cilexetil (n = 4 or 5). Animals given BLM alone and those treated with BLM + candesartan showed a significant difference in the time course in total cell count, neutrophils, and alveolar macrophages (p<0.01, p<0.01, p<0.01, respectively, two way ANOVA). Total cell counts (A) and neutrophils (B) increased significantly and peaked on day 7. These increases were significantly inhibited by candesartan cilexetil. Alveolar macrophages (C) increased from day 3 and peaked on day 14; this increase was reduced with candesartan cilexetil. Data were obtained from five rats and are shown as mean (SD) values. *p<0.05 versus BLM + candesartan group; †p<0.05 versus BLM alone on day 0.
BLM induced a significant increase in neutrophils on day 3 which peaked on day 7 (day 3: 263 (71.9) × 103/ml, mean difference 262 × 103, 95% CI 188 × 103 to 336 × 103, p<0.05; day 7: 348 (76.6) × 103/ml, mean difference 348 × 103, 95% CI 269 × 103 to 427 × 103, p<0.05; fig 6B). The increase on day 7 was the main reason for the increased total cell count and was blocked by candesartan cilexetil (141 (37.7) × 103/ml, mean difference 207 × 103, 95% CI 119 × 103 to 295 × 103, p<0.05). Alveolar macrophages were also significantly increased on day 14 (334 (114) × 103/ml, mean difference 234 × 103, 95% CI 108 × 103 to 361 × 103, p<0.05) and this was reduced in the presence of candesartan cilexetil (193 (58.7) × 103/ml, mean difference 141 × 103, 95% CI −16.0 × 10³ to 298 × 103), although the decrease was not significant (fig 6C). There were similar increases in the numbers of lymphocytes and eosinophils but the absolute numbers were extremely small compared with those of neutrophils and alveolar macrophages (data not shown).
Total protein and albumin in BAL fluid
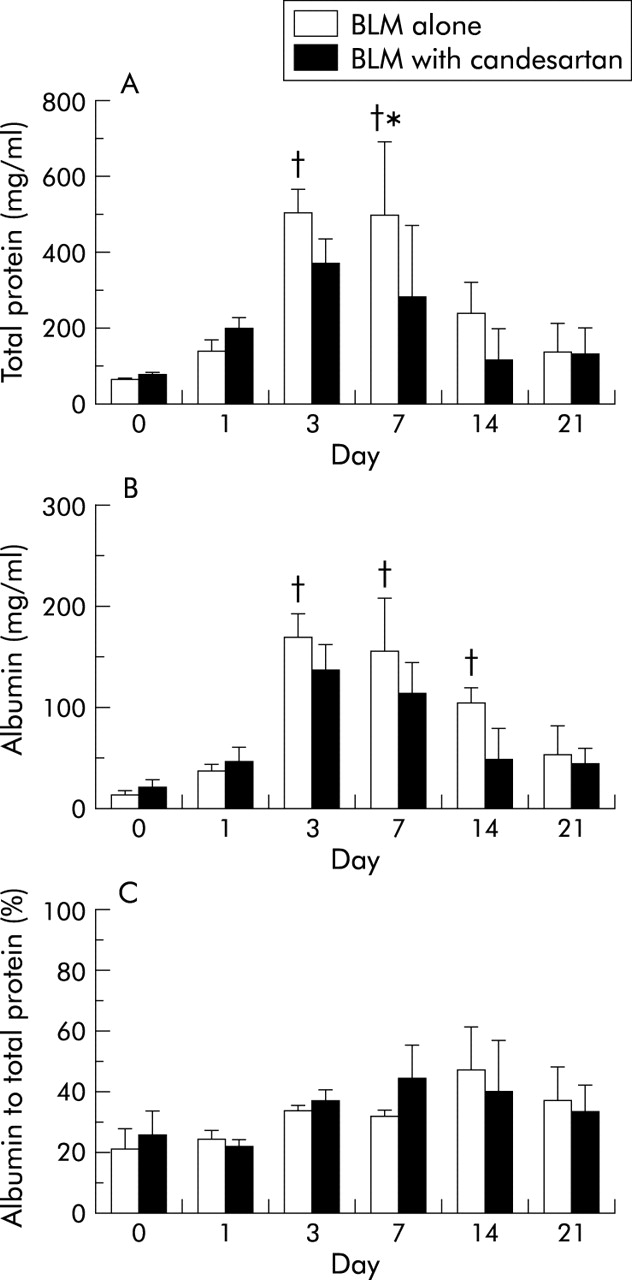
Neither the saline alone group nor the saline + candesartan group showed any significant changes in the concentration of total protein and albumin during the 21 days. There was a significant difference in the time course of total protein and albumin concentrations in BAL fluid between the BLM alone and the BLM + candesartan groups (both p<0.01, fig 7A and B). A significant increase in total protein was observed on day 3 (509 (64.0) mg/ml, mean difference 444, 95% CI 391 to 497, p<0.05) and day 7 (501 (191) mg/ml, mean difference 437, 95% CI 279 to 595, p<0.05) compared with baseline levels on day 0 (64.7 (64.7) mg/ml). Candesartan cilexetil significantly inhibited the increase in total protein on day 7 (278 (113) mg/ml, mean difference 224, 95% CI 27.8 to 421, p<0.05). Similarly, a significant increase in albumin was observed on day 3 (167 (23.7) mg/ml, mean difference 154, 95% CI 138 to 174, p<0.05), on day 7 (153 (51.2) mg/ml, mean difference 140, 95% CI 97.2 to 182, p<0.05), and on day14 (102 (14.9) mg/ml, mean difference 90.0, 95% CI 75.7 to 102, p<0.05). Candesartan cilexetil inhibited the increase in albumin on days 3, 7 and 14, although this inhibition was not significant. BLM induced a significant difference between time points in the proportion of albumin to total protein (p<0.01), but the difference with candesartan cilexetil treatment was not significant. The proportion of albumin to total protein in the BLM + candesartan group was higher than in the BLM alone group on day 7 (BLM alone: 31.1%, BLM + candesartan: 44.0%, mean difference 13.0, 95% CI 3.78 to 22.2; fig 7C).

(A) Total protein, (B) albumin, and (C) proportion of albumin to total protein in the centrifuged supernatants of BAL fluid. There was a significant difference in the time course of total protein and albumin concentrations in BAL fluid in the BLM alone and BLM + candesartan groups (both p<0.01, two way ANOVA). In the BLM alone group total protein and albumin increased significantly from day 1. Candesartan cilexetil significantly inhibited the increase in total protein. The proportion of albumin to total protein in the BLM alone group was higher than in the BLM + candesartan group on day 7. Data are shown as mean (SD) values (n = 4 or 5). *p<0.05 versus BLM + candesartan group; †p<0.05 versus BLM alone on day 0.
TGF-β1 levels in BAL fluid
TGF-β1 levels in BAL fluid supernatants were measured using ELISA kits (fig 8). There was a significant difference between the time course in TGF-β1 levels in the BLM alone and BLM + candesartan groups (p<0.01 and p = 0.01, respectively, two way ANOVA). TGF-β1 concentrations in the BLM alone group were significantly increased on day 7 (129 (16.3) pg/ml) compared with day 0 (27.2 (12.6) pg/ml, mean difference 102, 95% CI 83.4 to 121, p<0.05). Candesartan cilexetil significantly inhibited the increase on day 7 (94.9 (32.1) pg/ml, mean difference 34.5, 95% CI 1.78 to 67.2, p<0.05).

Transforming growth factor (TGF)-β1 levels in BAL fluid from rats (n = 5). There was a significant difference in the time course of TGF-β1 levels in the BLM alone and BLM + candesartan groups (p<0.01 and p = 0.01, respectively, two way ANOVA). TGF-β1 was significantly increased, reaching a peak on day 7. This increase was significantly reduced by candesartan cilexetil. Data are shown as mean (SD) values. *p<0.05 versus BLM + candesartan group; †p<0.05 versus BLM alone on day 0.
DISCUSSION
This study has shown that the expression of AT1 is upregulated in BLM induced pulmonary fibrosis and that the AT1 antagonist candesartan cilexetil inhibits the synthesis of TGF-β1 and ameliorates the pulmonary fibrosis. These results suggest that signalling of angiotensin II via AT1 promotes BLM induced pulmonary fibrosis.
This is the first report to show the detailed localisation of AT1 in the rat lung, although the presence of AT1 in human lung has been reported.12 AT1 in rat lung was localised on alveolar macrophages, alveolar type II cells, vascular smooth muscle cells, endothelial cells, and fibroblasts. These cells are believed to play an important role in the process of fibrosis. The localisation of AT1 in normal rat lung, as shown in fig 2, was the same as that in human lung as described in a previous paper.12 AT1 expression in the lung increased markedly after intratracheal administration of BLM, which is known to generate fibrosis, suggesting that angiotensin II as a ligand of AT1 is involved in pulmonary fibrosis. The quantitative assay for AT1 showed that the time course of intensity of AT1 expression in BAL fluid cells was different from that in lung homogenates. AT1 increased as early as day 3 in BAL fluid cells, while in the lung homogenates the increase did not take place until days 14–21. This time lag may be due to the different cellular components of these samples. Neutrophils and alveolar macrophages may contribute to the increase in AT1 in BAL fluid cells while capillary endothelial cells, interstitial macrophages, and fibroblasts may be the major sources of the increase in the lung homogenates.
Lung fibroblasts are known to proliferate under the stimulation of angiotensin II via AT1.13 Since the fibroblast is a major cell component involved in the synthesis of collagen fibres, the increase in AT1 in this cell may be critically important for the formation of fibrosis. An increased number of these cells was histopathologically observed on day 21, and the expression of AT1 in the lung homogenates continued to increase for 21 days after BLM instillation, suggesting that AT1 mediated fibrosis occurs progressively. If chronic types of lung injury such as idiopathic pulmonary fibrosis also maintain a high level of AT1 expression, candesartan cilexetil should be administered over a long period in order to achieve a satisfactory therapeutic effect and, moreover, an agent inhibiting the gene expression of AT1 should be developed for use as a novel therapeutic strategy.
Activated neutrophils in the alveolar space release toxic radical oxygen species and various proteolytic enzymes which result in severe tissue injury. Many chemotactic factors and adhesion molecules including E-selectin and interleukin (IL)-8 are involved in the migration and accumulation of neutrophils in the bronchoalveolar space. The administration of candesartan cilexetil significantly reduced neutrophil accumulation in the bronchoalveolar space, suggesting that angiotensin II may play a crucial role in the acceleration of neutrophil chemotaxis in the BLM injured lung. Previous studies support this suggestion. Angiotensin II generates E-selectin on endothelial cells and promotes leucocyte adhesion to endothelial cells; these effects are inhibited by the AT1 antagonist losartan.25 The AT1 antagonist also inhibits the expression of another adhesion molecule, Mac-1, on neutrophils.26 Angiotensin II is itself a potent factor in promoting neutrophil migration27; it induces the synthesis of chemotactic factors in endothelial cells28 and quinapril, an ACE inhibitor, reduces the synthesis of IL-8 in macrophages in an arteriosclerosis model.29 These findings and the results of the present study therefore show that the renin-angiotensin II system is involved in neutrophil accumulation in the BLM injured lung.
IL-8 is known to be not only a neutrophil chemotactic chemokine but also a pathogenetic mediator of pulmonary fibrosis.30 Since neutrophils are a major source of IL-8, its predicted overproduction by increased neutrophils in the BLM injured lung is likely to enhance the progression of fibrosis.
TGF-β1 is the most important factor in mediating pulmonary fibrosis. Patients with idiopathic pulmonary fibrosis and some animal models of pulmonary fibrosis have shown increased TGF-β1 production.19,20 TGF-β1 is mainly produced by alveolar macrophages.20,21 Our study showed that TGF-β1 levels in BAL fluid increased from day 3 and peaked on day 7 when the increase was significantly inhibited by treatment with an AT1 antagonist. These results suggest that angiotensin II promotes pulmonary fibrosis directly or indirectly via the acceleration of TGF-β1 synthesis. Similar results have been reported in animal models of cardiac and renal fibrosis.17,18 In vitro studies have also shown that angiotensin II increases TGF-β1 synthesis in cultured cardiac fibroblasts,16 vascular smooth muscle cells,31 bronchial smooth muscle cells,32 and renal mesangium cells.33 These reports, together with the results of our study, show that angiotensin II plays, in part, a role in accelerating the formation of fibrosis mediated by TGF-β1 which is partially inhibited by AT1 antagonists. Since the major source of TGF-β1 in the BLM induced fibrotic lung seems to be alveolar macrophages, it is necessary to evaluate the expression of AT1 by these cells and the subsequent intracellular signal transduction pathway covering the production of TGF-β1.
Administration of BLM increased vascular permeability of the lung.34 Not only BLM itself but also the toxic radical oxygen species and various proteolytic enzymes cause injury to endothelial cells or other structural components of the alveolar-capillary membrane which results in increased vascular permeability. The total protein and albumin content of the BAL fluid are ordinal markers of vascular permeability.34 As shown in fig 7, AT1 antagonist suppressed the acceleration of vascular permeability caused by BLM. Moreover, analysis of BAL fluid showed that the proportion of albumin to total protein in the BLM + candesartan group on day 7 was significantly higher than in the BLM alone group. This suggests that candesartan cilexetil may reduce the amount of some protein components—probably those related to inflammation—in the bronchoalveolar spaces to a greater extent than it reduces albumin. To evaluate the degree to which major protein components are reduced by candesartan cilexetil it is therefore necessary to identify inflammation related proteins induced by AT1 signalling.
In conclusion, our results indicate that AT1 expression is upregulated in BLM induced lung fibrosis and AT1 antagonist prevents the accumulation of inflammatory cells and development of lung fibrosis. Angiotensin II promotes lung injury and fibrosis via AT1 and, presumably, in part via TGF-β1.
REFERENCES
Linked Articles
- airwaves