Article Text

Abstract
Background: A study was undertaken to test the hypothesis that patients respond better to lung volume reduction surgery (LVRS) if their emphysema is confluent and predominantly located in the upper lobes.
Methods: A density mask analysis was used to identify voxels inflated beyond 10.2 ml gas/g tissue (−910 HU) on preoperative and postoperative CT scans from patients receiving LVRS. These hyperinflated regions were considered to represent emphysematous lesions. A power law analysis was used to determine the relationship between the number (K) and size (A) of the emphysematous lesions in the whole lung and two anatomical regions using the power law equation Y=KA−D.
Results: The analysis showed a positive correlation between the change in the power law exponent (D) and the change in exercise (Watts) after surgery (r=0.47, p=0.03). There was also a negative correlation between the power law exponent D in the upper region of the lung preoperatively and the change in exercise following surgery (r=−0.60, p<0.05).
Conclusions: These results confirm that patients with large upper lobe lesions respond better to LVRS than patients with small uniformly distributed disease. Power law analysis of lung CT scans provides a quantitative method for determining the extent and location of emphysema within the lungs of patients with COPD.
- computed tomography
- emphysema
- lung volume reduction surgery
- chronic obstructive pulmonary disease
Statistics from Altmetric.com
Lung volume reduction surgery (LVRS) is a palliative procedure designed to improve the lung function of patients with severe emphysema.1–5 The data show that improvement in lung function occurs in all subjects, but is maintained much longer in patients with a heterogeneous distribution of disease.6 Furthermore, a recent finding from the National Emphysema Treatment Trial (NETT) Research Group has identified a group of patients characterised by homogeneous disease, low forced expiratory volume in 1 second (FEV1), and a very low carbon monoxide transfer factor who have increased morbidity and mortality following LVRS.7 It is therefore very important that criteria are developed to select patients who will receive the most benefit, and the least harm, from LVRS.
The extent and distribution of disease is usually described using qualitative visual grading scales of computed tomographic (CT) images.8–10 However, a recent study has shown that these emphysema grading scales correlate poorly with measurements of emphysema in gross specimens, and that the interobserver agreement using grading scales was only moderate.11 Quantitative analyses of CT scans show a better correlation with pathology11 and provide direct evidence that LVRS reduces both the volume of large emphysematous lesions (>5 mm diameter) and total lung volume.12–14 These techniques are simple and can be used as part of a quantitative morphometric analysis, but do not characterise the heterogeneity of location or size of emphysematous lesions. Nakano et al15 have recently shown that an upper peripheral distribution of emphysema is predictive of improvement in cardiopulmonary exercise following LVRS. Mishima et al16 employed a power law analysis of the CT scan that allowed the number of emphysema lesions to be correlated with their size. They showed that, as the lesions increase in size, they decrease in number resulting in a decreased slope of this relationship.
The purpose of the present study was to develop an objective assessment of the extent and location of emphysema within the lungs of patients undergoing LVRS. The slope of the power law relationship, for the whole lung as well as two anatomical regions, was examined in the preoperative CT scan to predict benefit using cardiopulmonary exercise performance as the outcome measure.
METHODS
Subjects and physiological testing
The analysis was performed on 21 subjects who underwent bilateral LVRS using either video assisted thorascopy (n=17) or median sternotomy (n=4) between June 1994 and June 1997. Patients were selected if they could complete radiological, physiological, and cardiopulmonary exercise tests at baseline and at 3 months after LVRS using previously described techniques.12,17 The institutional review board of the University of Pittsburgh Medical Center approved the study design and all patients provided informed consent.
Physiological testing was performed using previously described techniques.17 Spirometry and tests of lung volume and carbon monoxide transfer factor were measured using standard techniques with the subjects seated in a pressure body plethysmograph. Incremental symptom limited maximal exercise testing was performed on an electronically braked cycle ergometer (Model KEM III, Mijnhart, Holland).
Computed tomographic morphometry (CTM)
All subjects received a conventional transverse CT scan (10 mm thick contiguous slices) on a GE Highlight Advantage CT scanner (General Electric Medical Systems, Milwaukee, WI, USA) with the subject supine while breath holding at full inspiration. No intravenous contrast medium was used.
Analysis of the CT scans has been described in detail elsewhere.18,19 Briefly, the lung parenchyma was segmented from the chest wall and large central blood vessels using a contour-following algorithm. Lung volume was calculated by summing the number of voxels in all slices and multiplying by the voxel volume. The CT density of the lung (g/ml) was estimated from radiographic attenuation of each of the CT voxels.18,20 Inflation of the lung (ml gas/g tissue) was calculated by subtracting the inverse of tissue density from the inverse of the measured density.18,19,21,22
Emphysematous lesions were defined as clusters of connected pixels beyond a threshold value using a “density mask” method (>10.2 ml/g, <−910 HU).12,23 The size of these lesions (A) was calculated by simply summing the number of connected pixels below the density mask. For example, an emphysematous lesion in a particular CT image could be very small (consisting of a single pixel) or very large (consisting of a cluster of many connected pixels). Figure 1 shows two representative CT scans which illustrate that there may be many small lesions (figs 1A and B) or fewer larger lesions (figs 1C and D). The number of lesions of all sizes (measured in numbers of pixels) was counted and the cumulative number (Y) of these lesions larger than a given size was plotted against that lesion size (A) on a log-log plot (fig 2).16,24 Least squares regression on logY versus logA found the best fit linear equation logY=logK − D logA corresponding to a power law equation Y=KA−D. The parameter logK is the intercept or number of lesions larger than area A=1 pixel (1 pixel=0.004 cm2). The slope D is the power law exponent. According to this calculation, lungs with predominantly small lesions have a steep slope and a large D while lungs with larger lesions have a slope that is less steep resulting in a smaller D.
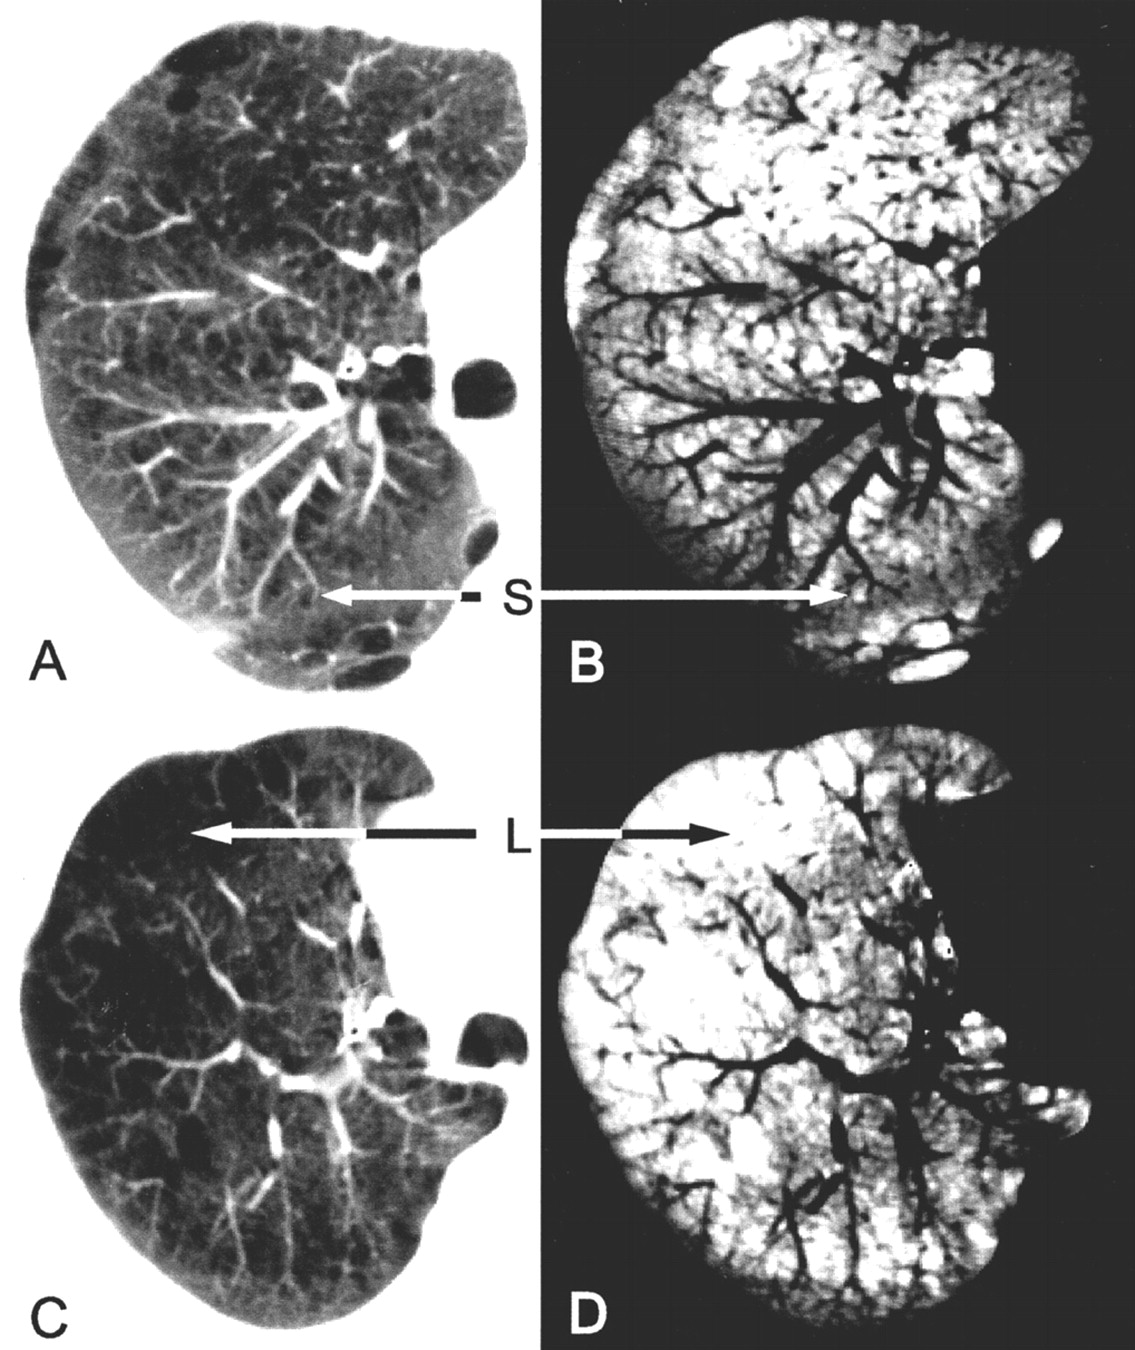
CT images from two representative subjects before LVRS. (A) CT image showing relatively small uniformly distributed lesions; (B) the same image after a “density mask” of 10.2 ml gas/g tissue has been applied; (C) CT image showing relatively large lesions; (D) the same image after a “density mask” has been applied. L=large lesion area; S=small lesion area.
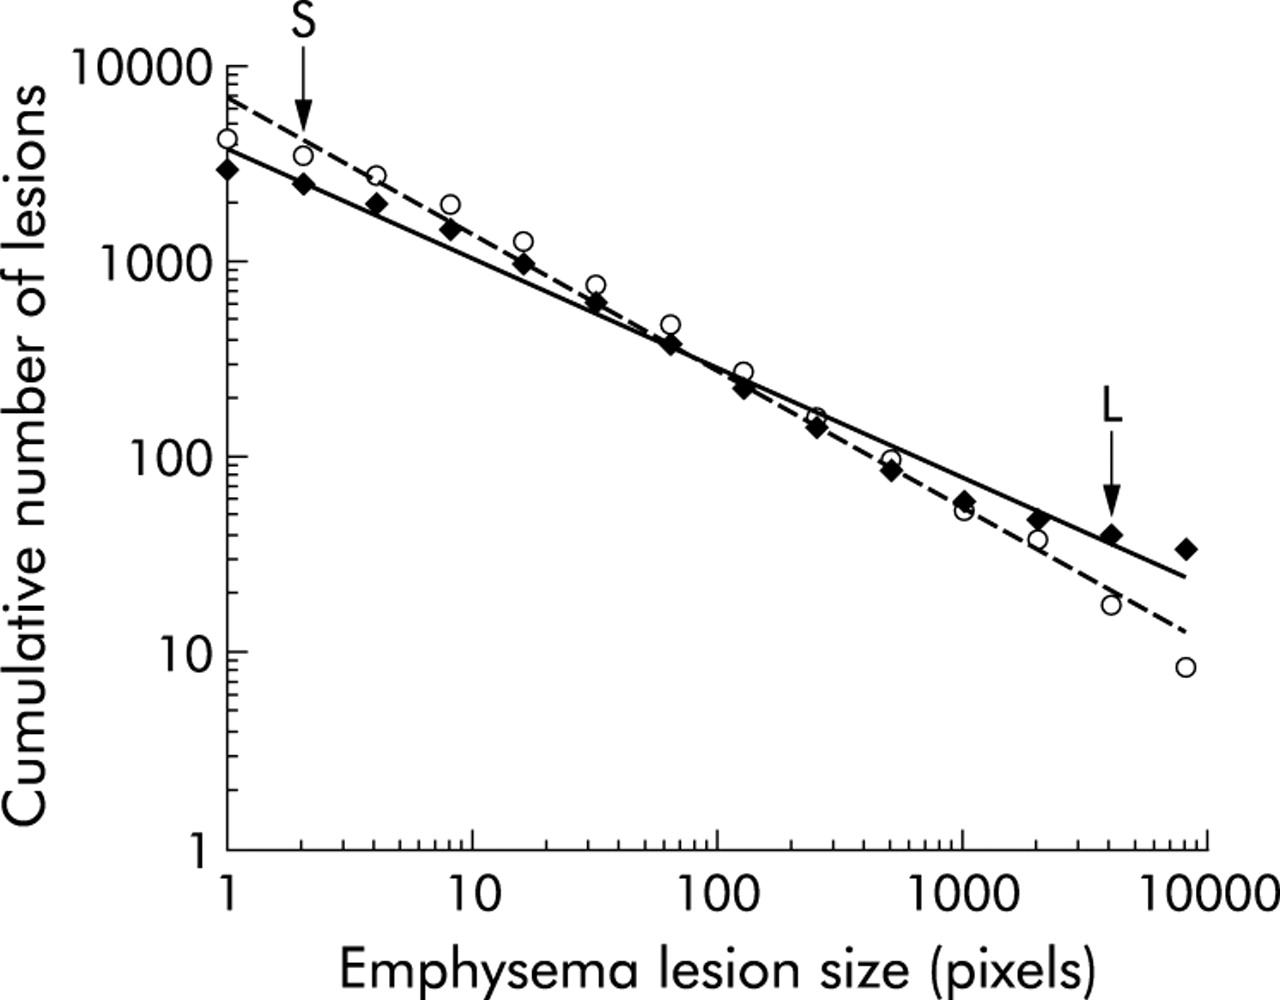
Log-log correlation between the cumulative number of lesions and the preoperative lesion size (measured in number of pixels) for a representative subject.♦=preoperative; ø=postoperative; L=large lesions (fig 1); S=small lesions.
To determine regional differences in the extent of emphysema and lesion size, the lungs were divided at the carina into an apical and basal region.
Analysis of data
Differences in pulmonary function, exercise, lung volume, percentage emphysema, and D following LVRS were tested using a paired two tailed t test. Correlation coefficients were calculated to test the goodness of fit of the power equations. The change in exercise data was correlated with D and with the percentage emphysema using simple regression analysis. A p value of less than 0.05 was considered significant.
RESULTS
Subject demographic data (table 1) show that, following surgery, there was an improvement in both the static (TLC, FRC, RV) and dynamic lung volumes (FEV1, FVC) (p<0.0001) with no change in the carbon monoxide transfer factor (p=0.81). There was also an improvement in the cardiopulmonary exercise ability as measured by cycle ergometry (p<0.001).
Descriptive physiology before and after lung volume reduction surgery (LVRS)
There was a negative correlation between the log cumulative number of lesions greater than a given area versus the log of that area (preoperative: r=0.96 (SD 0.04), postoperative: r=0.94 (SD 0.06)). Figure 2 shows the power law analysis of the preoperative and postoperative data from one subject in whom the exercise performance increased by 40 Watts. The data in fig 2 show an increase in the power law relationship (D) (steeper slope) and the Y intercept (K), indicating that there is a shift in the size distribution towards smaller lesions following LVRS. When expressed as a percentage of total lung volume, there was also a decrease in the percentage of the lung occupied by emphysematous lesions (preoperative 49%, postoperative 27%).
Table 2 shows the total lung volume, percentage emphysema, and the power law exponent (D) for the whole lung and for the apical and basal regions. These data show that there is more emphysema and larger lesions (smaller D) in the region of the lung above the carina than below it. The postoperative decrease in percentage emphysema is significant for the whole lung and each of the two regions, while only the whole lung D was significantly different.
Computed tomographic morphometry before and after lung volume reduction surgery (LVRS)
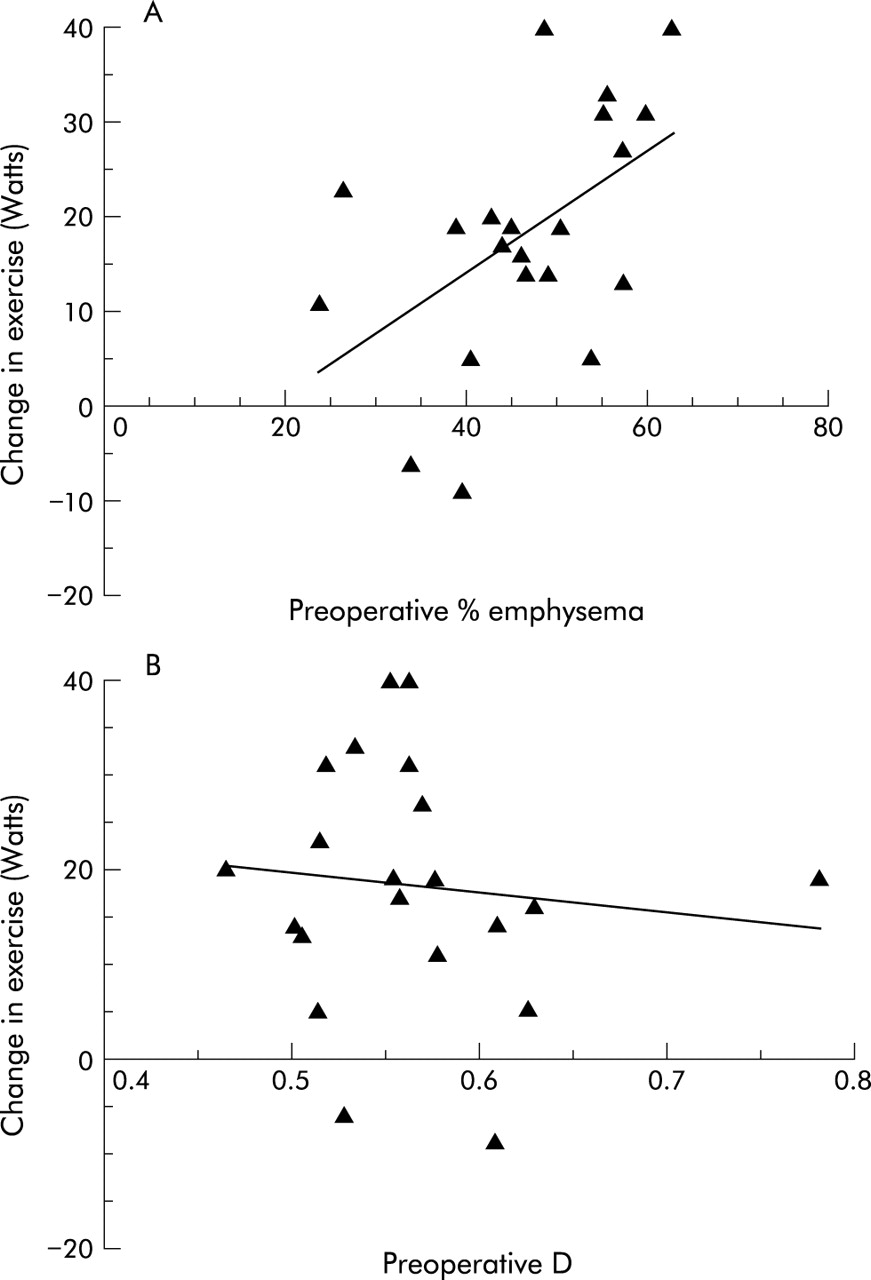
The change in cardiopulmonary exercise (Watts) measured before and after surgery correlated with the change in percentage emphysema (r=0.62, p=0.003; fig 3A) and less strongly with the change in whole lung D following LVRS (r=0.47, p=0.03; fig 3B). The change in exercise correlated with the preoperative percentage emphysema (r=0.51, p=0.02; fig 4A) but not with the preoperative D (r=−0.13, p=0.5; fig 4B).
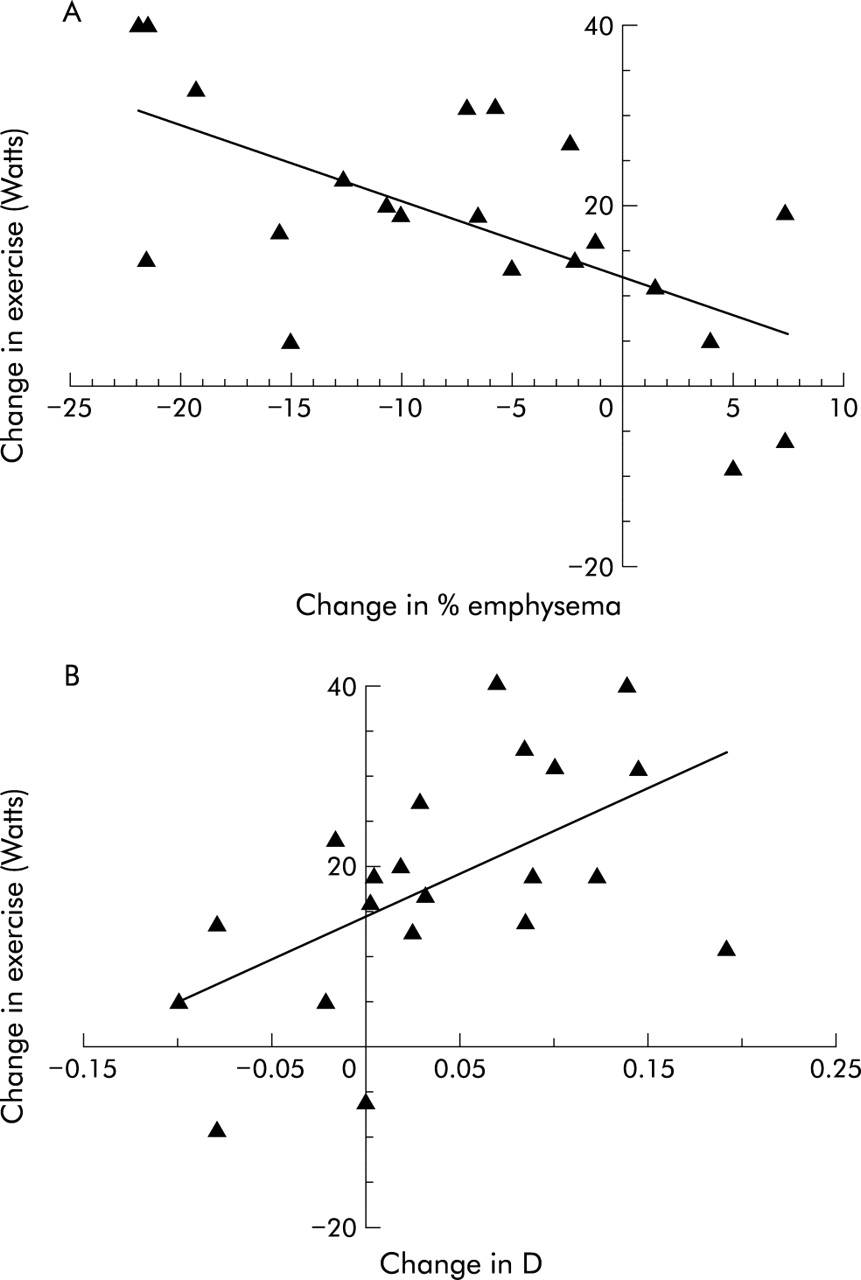
Correlation between change in exercise and (A) change in percentage emphysema (r=−0.62, p=0.003) and (B) change in the power law exponent (D) (r=0.47, p=0.03).

Correlation between change in exercise and (A) preoperative percentage emphysema (r=0.51, p=0.02) and (B) preoperative power law exponent (D) (r=−0.13, p=0.5)
The regional heterogeneity of the emphysema distribution in the lung was examined by dividing the lung into regions above and below the carina. These data show that there was a correlation between the change in exercise and the preoperative percentage emphysema which was strongest in the apical region (r=0.63, p=0.002) and not significant in the basal region (r=0.16, p<0.5; table 3). The preoperative apical D was also correlated with the change in exercise following surgery (r=−0.60, p=0.004; table 3). The preoperative D for the apical region was very strongly correlated with the percentage emphysema in the apical region (r=−0.94, p<0.001) and both predicted the change in exercise.
Change in exercise as a function of preoperative percentage emphysema and power law analysis
DISCUSSION
The data reported here show that, despite a wide range of responses, there is a mean improvement in functional outcome parameters following LVRS (table 1) which is consistent with other investigators.1–5 The results also confirm previous reports of a decrease in overall lung volume, measured both by body plethysmography (table 1) and CT (table 2), and a decrease in the volume of the lung occupied by emphysematous lesions larger than 5 mm in diameter. The power law analysis extends these observations by providing a quantitative method for reliably detecting the location and size of the emphysematous lesions. This observation confirms previous results using qualitative8,10 and quantitative assessments15,25 of disease distribution and provides an objective tool for making this prediction.
Several studies have shown that subjects with a heterogeneous pattern of emphysema on CT scanning respond better to LVRS than those with a homogeneous distribution.6,8,10,15,25–28 Furthermore, the recent report by the NETT study that patients with homogeneous disease and very low carbon monoxide transfer factor do not benefit from LVRS7 stresses the importance of defining criteria whereby patients can be selected who will have the best response to surgery. However, the definition of “heterogeneous/homogeneous pattern” is ambiguous and difficult to apply in clinical settings. Qualitative scoring systems developed for CT scans show variability between observers and institutions.10,11,29 Quantitative CT scanning allows the separation of mild from severe disease16,19,24 and the quantification of structural changes following surgery.12–14 Although CT scanning provides a method of quantifying the size and extent of emphysema within the lungs of living subjects, no single method of CT assessment is universally accepted by all investigators. Emphysema has been quantified using the lowest fifth percentile of the radiographic attenuation distribution,30 a “density mask” cut off of attenuation values,23 and by expansion of the lung volume beyond normal,19 but none of these techniques quantifies the size of the lesions. Recent attempts to quantify the distribution of emphysema have focused on the relative proportion of upper versus lower25 and/or central versus peripheral15 emphysema. Both of these techniques show some promise in predicting outcome, but neither quantifies the size of the emphysematous lesion.
This study was performed using conventional CT images. The standard clinical practice is to assess emphysema on thin slice CT images reconstructed using an edge enhancing algorithm. However, it has been shown that the decreased signal to noise ratio in these high resolution CT images diminishes the ability to discriminate different densities within the lung.31 While slice thickness and reconstruction algorithm will have an effect on the apparent size of the lesion (partial volume effect), we have used the CT images of the same thickness both before and after surgery and a density mask cut off appropriate for these images.19,23
The results presented here confirm the reports of Sakai et al24 and Mishima et al16 who showed that the number and size of emphysematous lesions is described by a power law relationship. Mishima et al further illustrated this effect using an elastic spring network model of the lung that showed a large decrease in the exponent (D) of the power law relationship (less steep slope) with a minimal change in the percentage of the model occupied by “lesions”. They concluded that a decrease in the power law relationship (D) (less steep slope) reflects coalescence into larger lesions and not just more low attenuation voxels on the CT scan.16 Our data also show that the slope is steeper (larger D) when small lesions predominate and becomes less steep (smaller D) as more large lesions appear (fig 2).
Cardiopulmonary exercise is a valuable quantitative outcome measurement for LVRS,32 and our data show improvement in exercise, measured in Watts, in relation to both a decrease in percentage emphysema and an increase in D following surgery. The present analysis confirms previous results showing that the percentage emphysema in the surgically accessible upper lung regions is more strongly correlated with exercise improvement than the percentage emphysema in the lower lung.15 More importantly, it extends this analysis by showing that the size and number of lesions (D) in the upper lung predicts exercise improvement following LVRS. When large emphysematous lesions were removed (increasing D), there was a significant increase in the exercise capacity of the subject (fig 3). Interestingly, some patients had a lower D (change in D <0) following surgery (fig 3), which suggests that removing lung tissue allowed an expansion of the remaining lung and created larger emphysematous lesions. The fact that some of these subjects did show a modest increase in exercise following surgery shows that removal of emphysema may be important. The spatial distribution of the lesions can be determined by dividing the lung into upper and lower regions at the carina. This analysis shows (table 2) that before surgery there was more emphysema and that the lesions were larger in the upper regions than in the lower. Furthermore, the patients with the largest lesions in the upper lung had the greatest improvement in exercise following surgery (table 3).
The analysis presented here is somewhat limited by its retrospective nature and small number of subjects. While the results have a degree of scatter, the overall trend is sufficient to generate the hypothesis that a power law analysis of the CT scan can determine the extent and severity of emphysema and predict the outcome of LVRS. This analysis adds information to the currently used algorithms that use CT measurements to determine lung structure, density, volume, surface area, and airway dimensions by providing an estimate of both the size and location of the emphysematous lesions. We suggest that the analytical method reported here could provide a powerful tool for preoperative selection of patients most likely to benefit from LVRS, that deserves to be tested in a larger clinical trial.
Acknowledgments
The authors wish to express their sincere thanks to William Slivka (University of Pittsburgh Medical Center) who conducted the physiological testing, William Bradford Rogers (University of Pittsburgh Medical Center) for collecting the CT images, Laurie N Silfies (University of Pittsburgh Medical Center) and Steve Kalloger (Vancouver General Hospital) for assistance in the analysis of the data, and Dr John R Mayo (Vancouver General Hospital) for a careful reading of the manuscript. This study was supported by the Medical Research Council of Canada (grant 4219) and the George H Love Foundation. Dr Coxson was supported by a fellowship from the Canadian Thoracic Society – Medical Section of the Canadian Lung Association and Boehringer-Ingelheim during the time of this research.