Article Text

Abstract
Background: Recent evidence suggests that the frequency response requirements for peak expiratory flow (PEF) meters are higher than was first thought and that the American Thoracic Society (ATS) waveforms to test PEF meters may not be adequate for the purpose.
Methods: The dynamic response of mini-Wright (MW), Vitalograph (V), TruZone (TZ), MultiSpiro (MS) and pneumotachograph (PT) flow meters was tested by delivering two differently shaped flow-time profiles from a computer controlled explosive decompression device fitted with a fast response solenoid valve. These profiles matched population 5th and 95th centiles for rise time from 10% to 90% of PEF and dwell time of flow above 90% PEF. Profiles were delivered five times with identical chamber pressure and solenoid aperture at PEF. Any difference in recorded PEF for the two profiles indicates a poor dynamic response.
Results: The absolute (% of mean) flow differences in l/min for the V, MW, and PT PEF meters were 25 (4.7), 20 (3.9), and 2 (0.3), respectively, at PEF ≈500 l/min, and 25 (10.5), 20 (8.7) and 6 (3.0) at ≈200 l/min. For TZ and MS meters at ≈500 l/min the differences were 228 (36.1) and 257 (39.2), respectively, and at ≈200 l/min they were 51 (23.9) and 1 (0.5). All the meters met ATS accuracy requirements when tested with their waveforms.
Conclusions: An improved method for testing the dynamic response of flow meters detects marked overshoot (underdamping) of TZ and MS responses not identified by the 26 ATS waveforms. This error could cause patient misclassification when using such meters with asthma guidelines.
- peak expiratory flow
- peak flow meters
- lung function
Statistics from Altmetric.com
For flow to be recorded accurately from a maximal forced expiratory manoeuvre it is essential that the recording device has adequate dynamic response characteristics, as well as being linear and accurate over its operational range. We have recently shown that the frequency content of expiratory manoeuvres performed to record peak expiratory flow (PEF) includes important signal components up to 30 Hz.1 We have also shown that the panel of profiles recommended by the American Thoracic Society for testing PEF meters2 does not have a sufficient range of rise times (RT) from 10% to 90% of PEF or dwell times (DT) of flow above 90% of PEF to cover the spread of data found in the client population.3 Since pump systems cannot accurately deliver profiles that have a very short DT,4 it is necessary to consider other methods for testing whether the dynamic response of flow meters is adequate for the purpose.
An explosive decompression device5 lends itself to this task as it does not suffer from the wave effects that limit the ability of pump systems to deliver demanding profiles.4 We have modified an explosive decompression system to determine whether it can be used to test the dynamic response of flow meters that either have a continuous analogue output, such as a pneumotachograph (PT), or have a discrete output, such as variable orifice meters.
METHODS
A fast response direct drive valve (type D633–313A, Moog Inc, East Aurora, NY, USA) was attached to the chamber of a 7.5 litre explosive decompression device5 so that the aperture of the solenoid could be rapidly controlled from a computer. The closure time from fully open was stated by the manufacturer as less than 12 ms. The pressure in the chamber was recorded using a transducer (Sensortechnics HCX005D6V, 0–500 kPa) and there was an analogue pressure meter (Nuova Fima, Buenos Aires, Argentina, 0–160 kPa) attached for continuous visual readout. The chamber was filled with copper shavings to help ensure adiabatic conditions during gaseous discharge. The outlet from the solenoid was a 28 mm internal diameter tube to which various flow meters could be attached.
A mini-Wright variable orifice meter was enclosed in a Perspex cylinder so that all the gas passing through the meter was collected again and channelled into the outlet of the cylinder.6 The inlet of the Perspex cylinder was attached to the explosive decompression device and the outlet of the cylinder was attached to the upstream diffuser of a Fleisch type PT of 60 mm diameter (Vitalograph Ltd, Buckingham, UK) fitted with a Sensym low range (0–1 kPa) differential pressure transducer (type SCXL004DN, Farnell Electronics Components Ltd, Leeds, UK, part no 232-671). All signals were A/D converted using a 12 bit converter and sampled at 1000 Hz. Signals were low pass filtered at 200 Hz (four pole Butterworth analogue filter) when the frequency response of the PT was being tested, which gives a gain of 0.99 at 130 Hz, 0.67 at 200 Hz, and 0.08 at 300 Hz. For all the other recordings the same filter was set for low pass at 50 Hz, which is what we normally use for recording subjects, and this gives the same gains at 30 Hz, 50 Hz, and 90 Hz respectively.
The following PEF meters, which had been purchased in 1994 and stored for subsequent laboratory testing only, were studied: a mini Wright (MW) meter (Clement Clarke International Lt, Harlow, UK), a Vitalograph (V) meter (Vitalograph Ltd, Buckingham, UK), a MultiSpiro (MS) meter (MultiSPIRO Inc, Irvine, CA, USA), and a TruZone (TZ) meter (Trudell Medical, Ontario, Canada). The readings for the MW were corrected for the known non-linearity of these meters7 where:
corrected PEF (l/min) = (recorded PEF)2 × 0.0009 + recorded PEF × 0.373 + 47.4
This was the best polynomial fit for these data with a residual standard deviation of 7.1 l/min.
The two computer generated flow profiles shown in fig 1 were discharged five times from the explosive decompression device to test the meters. These profiles were constructed using the flow-time data either side of PEF from a subject’s recorded blow that had a rise time (RT) of 89 ms and dwell time (DT) of 15 ms. The data up to PEF and those after PEF were separately adjusted in the time domain to achieve any desired RT or DT. When profile A is delivered the output profile should have an RT of 110–140 ms and a DT of 100–130 ms. These values were chosen to be roughly at the 95th centile for population values.3 When profile B is delivered the output profile should have an RT of 20–36 ms and a DT of 12–20 ms, which were roughly at the 5th centile. If profiles A and B are delivered to a given meter with the same maximum solenoid aperture and the same driving pressure at the point of PEF, then the delivered PEF should be the same provided that the impedance of the PEF meter is negligible compared with the internal resistance of the calibration device. Thus, if a meter were to yield an importantly different reading for these two profiles when delivered in this way, the dynamic response characteristics of the meter must be inadequate. The output impedance of the solenoid was checked to be in excess of the impedance of the flow meters by recording the PEF and pressure upstream of the Perspex holder when discharging the decompression device five times through the Perspex holder with the MW meter in place, then repeating this with 600 cm2 of domestic all purpose cleaning cloth (J-cloth) placed loosely in the holder to give equivalent smoothing of the flow signal.
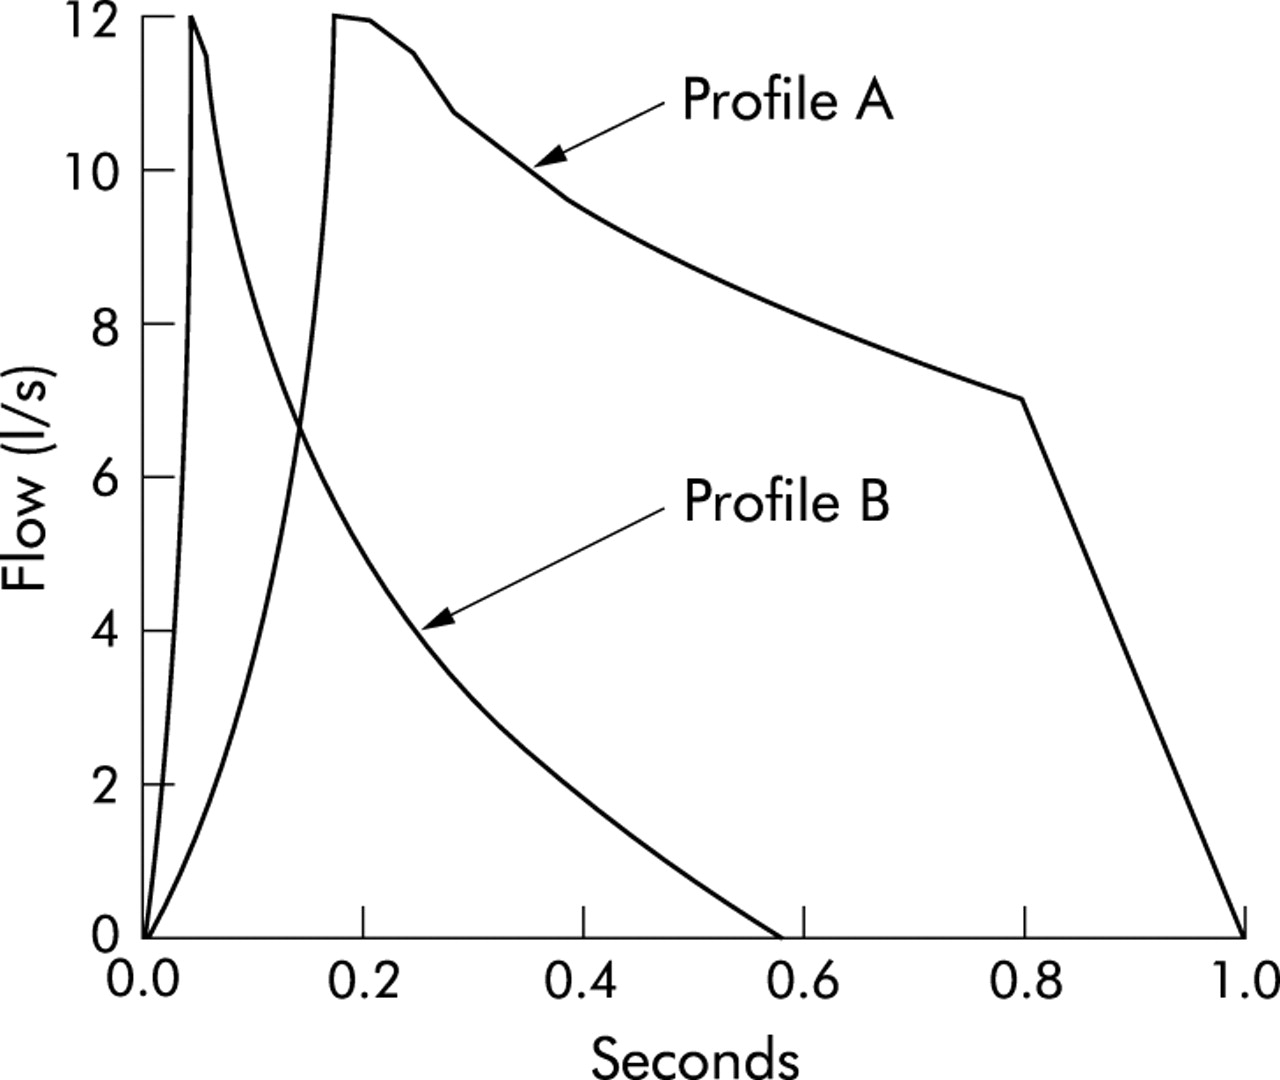
Flow-time plots of profile A with rise time (RT) = 110–140 ms and dwell time (DT) = 100–130 ms and profile B with RT = 20–36 ms and DT = 12–20 ms.
Since the chamber pressure in this small volume explosive decompression system falls as the flow is delivered, and for profile A the rise time is quite long, it is to be expected that the driving pressure will decay from the start value to the value recorded at PEF. The relationship between pressure at the start and at PEF was therefore established for different start pressures for both profiles. Because the driving pressure in the decompression system is constantly falling once the solenoid is opened, the DT of the input signal was suitably increased so that the correct DT for the output was achieved.
Profiles A and B were discharged to each meter five times with the same driving pressure at PEF and the recorded PEF was noted. With the MW meter in its Perspex holder, the whole delivered profile was recorded with the PT to confirm that the profile shape was accurate. Each meter and the PT were also tested with the 26 ATS flow waveforms delivered using an adequate pump system.4
The frequency response of the PT was tested separately by a type of step test.5 A flow was delivered to the PT system from the explosive decompression device and this was then suddenly terminated by closing the solenoid valve. The flow recorded by the PT was recorded at 1000 Hz with the analogue low pass filter set at 200 Hz and the digitised signal was stored. This off-step response was analysed to confirm that the assumption of second order characteristics was appropriate. From the amplitude and periodicity of the first two off-step oscillations, it is possible to calculate the natural resonant frequency (Fn) and damping coefficient (D) using established formulae.5
The frequency power spectra for profiles A, B, all the ATS profiles, and for blows by 50 subjects (26 normal and 24 patients with airflow limitation) from our previous study1 were calculated using commercial numerical routines (Quinn Curtis Inc, Version 2.5, Mass, USA).
RESULTS
The full data for power spectra, RT and DT for the 26 ATS waveforms and profiles A and B are available on the Thorax website as table E1. Only seven of the 26 ATS waveforms had the 99th centile of their power spectrum at 5 Hz or more, indicating that the majority had a very low frequency content. Waveform 6 had the highest frequency content with 99% of its power spectrum defined by 7.1 Hz, whereas this was 17.2 Hz for profile B. In the 50 subjects from our previous study1 the range of the 99% limit for the power spectrum was 2.2–16.0 Hz with a mean (SD) of 5.4 (1.4) Hz for the 26 normal subjects and 6.8 (3.6) Hz for the 24 patients tested.
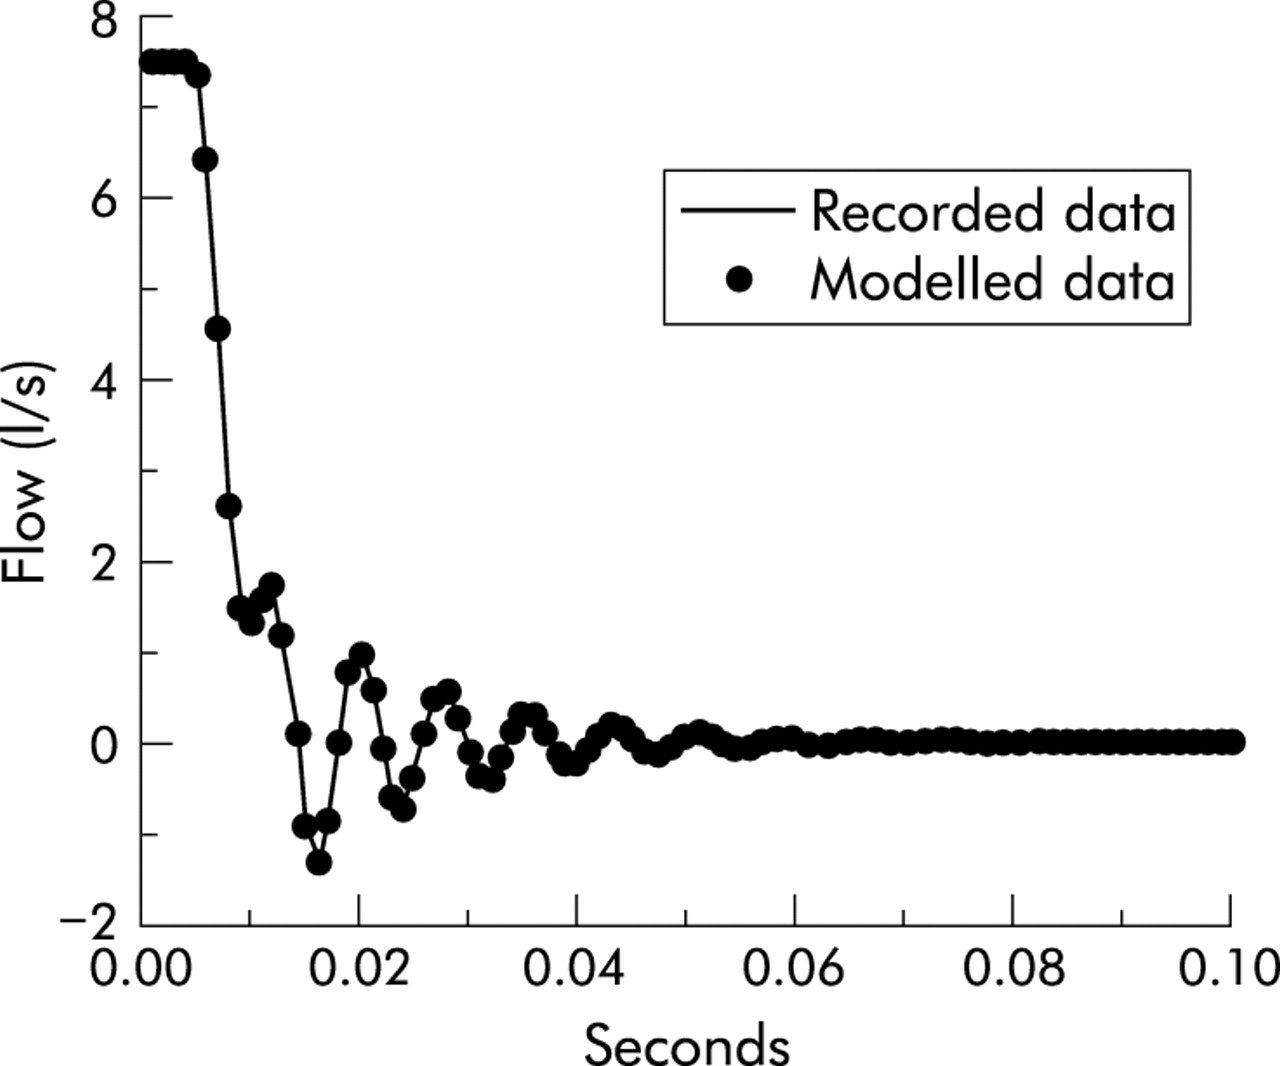
Figure 2 shows the results of the step test on the PT system. Analysis for second order characteristics confirmed that these assumptions were an excellent fit for the data, having taken into account a small artefact during the rapid closure of the valve that represented a degree of hesitation of the valve. This was modelled by placing a delay in the acceleration of the flow to coincide with the hesitation we observed. The natural resonant frequency of the PT system was 143 Hz with a damping factor of 0.1, the point of 5% gain on the signal was at 30 Hz, and the 3 dB gain point was at 54 Hz. This indicates that the frequency response characteristics of the PT were adequate for recording the flow signals from human maximal forced expiratory manoeuvres.

Plot of the recorded signal from the pneumotachograph (PT) on sudden cessation of the flow from 7.6 l/s to zero, with the modelling of second order characteristics plotted as •.
Figure 3 shows the input flow signal, recorded flow signal, and the driving pressure for profiles A and B delivered to a MW meter. The relationship between chamber start pressure (pStart) and pressure at PEF (pPEF) for profiles A and B were linear such that pPEF (in bar) was given by:
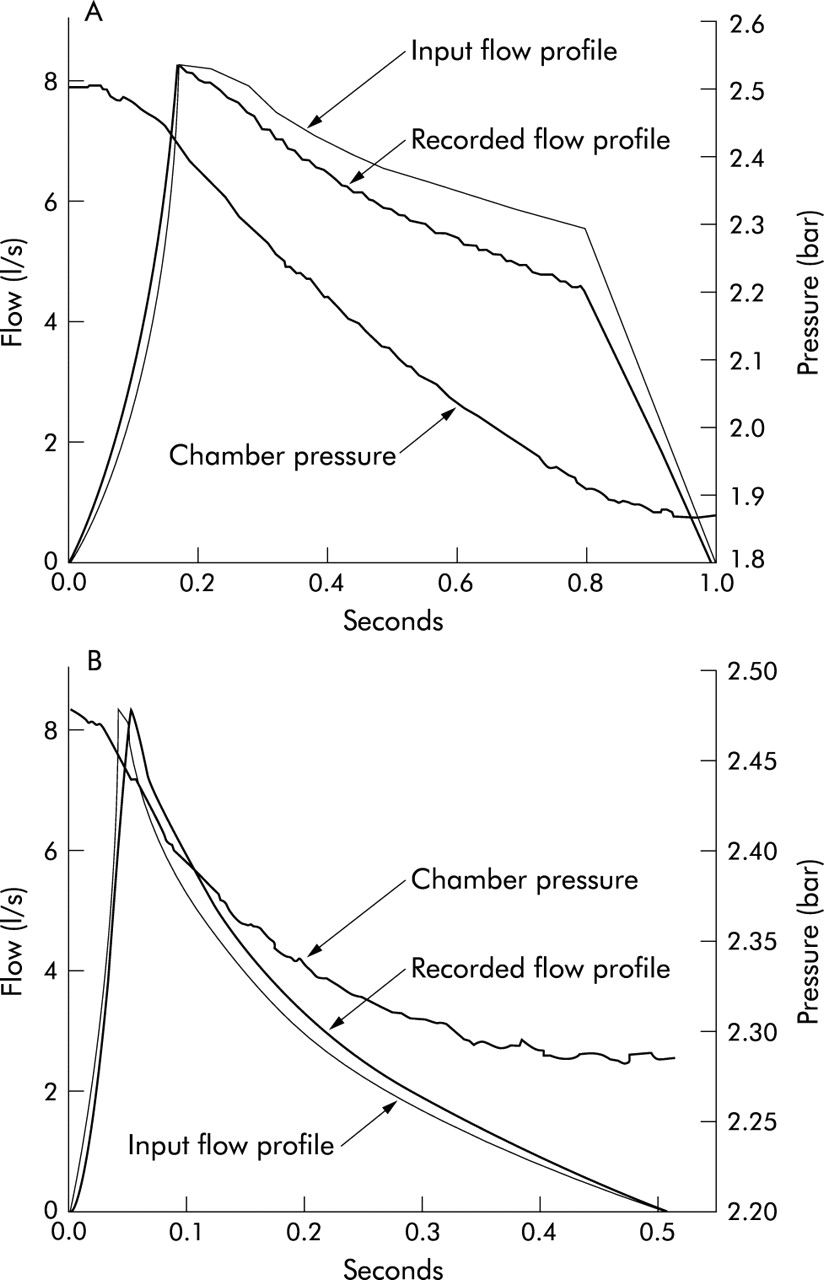
Input flow data, recorded flow, and chamber pressure for discharge of the decompression device through a mini Wright meter and pneumotachograph (PT) for (A) profile A and (B) profile B (8.3 l/s). The right hand ordinate scale is for the chamber pressure in bar (atmospheric pressure =1 bar). Input rise time (RT)=126 ms and dwell time (DT)=160 ms, with recorded RT=127 ms and DT=122 ms in (A); input RT=30 ms and DT=14 ms, with recorded RT=31 ms and DT=16 ms in (B).
Profile A: pPEF = 93% of pStart, r=0.9999, RSD=0.011 l/s
Profile B: pPEF = 97% of pStart, r=0.9999, RSD=0.009 l/s
When tested with the MW inside the Perspex holder for the possible effect of the impedance of the flow meters on the discharge profile, the mean (SD) PEF was 8.98 (0.02) l/s with a peak upstream pressure of 2.4 (0.01) kPa (estimated impedance 0.27 kPa/l.s). When discharged at the same 1.6 bar above atmospheric pressure through the Perspex holder with just a small piece of cloth inside instead of the MW meter, the mean PEF was not significantly different at 8.90 (0.07) l/s (p=0.08, two sample t test with unequal variances) with an upstream pressure of 1.1 (0.04) kPa (estimated impedance of 0.12 kPa/l.s). This confirms that the solenoid impedance, estimated from the data in fig 3A as 18.9 kPa/l.s, is so far in excess of that of the meter (factor of 70) that the output of the solenoid device is not affected by the external impedance of PEF meters.
The results in table 1 show that, for profile A, the delivered RT was within measurement error of the input irrespective of the driving pressure. For profile A at a flow of around 500 l/min it was found that the input DT had to be 160 ms to achieve a delivered DT of approximately 100 ms, and for a flow in the region of 200 l/min the input DT had to be 230 ms to achieve a delivered DT of around 100 ms. For profile B the delivered RT and DT were within measurement error of the input RT and DT, irrespective of the flow delivered.
Recorded PEF, pressure at PEF, RT, and DT for profiles A and B with PEF at two flows of around 500 and 200 l/min
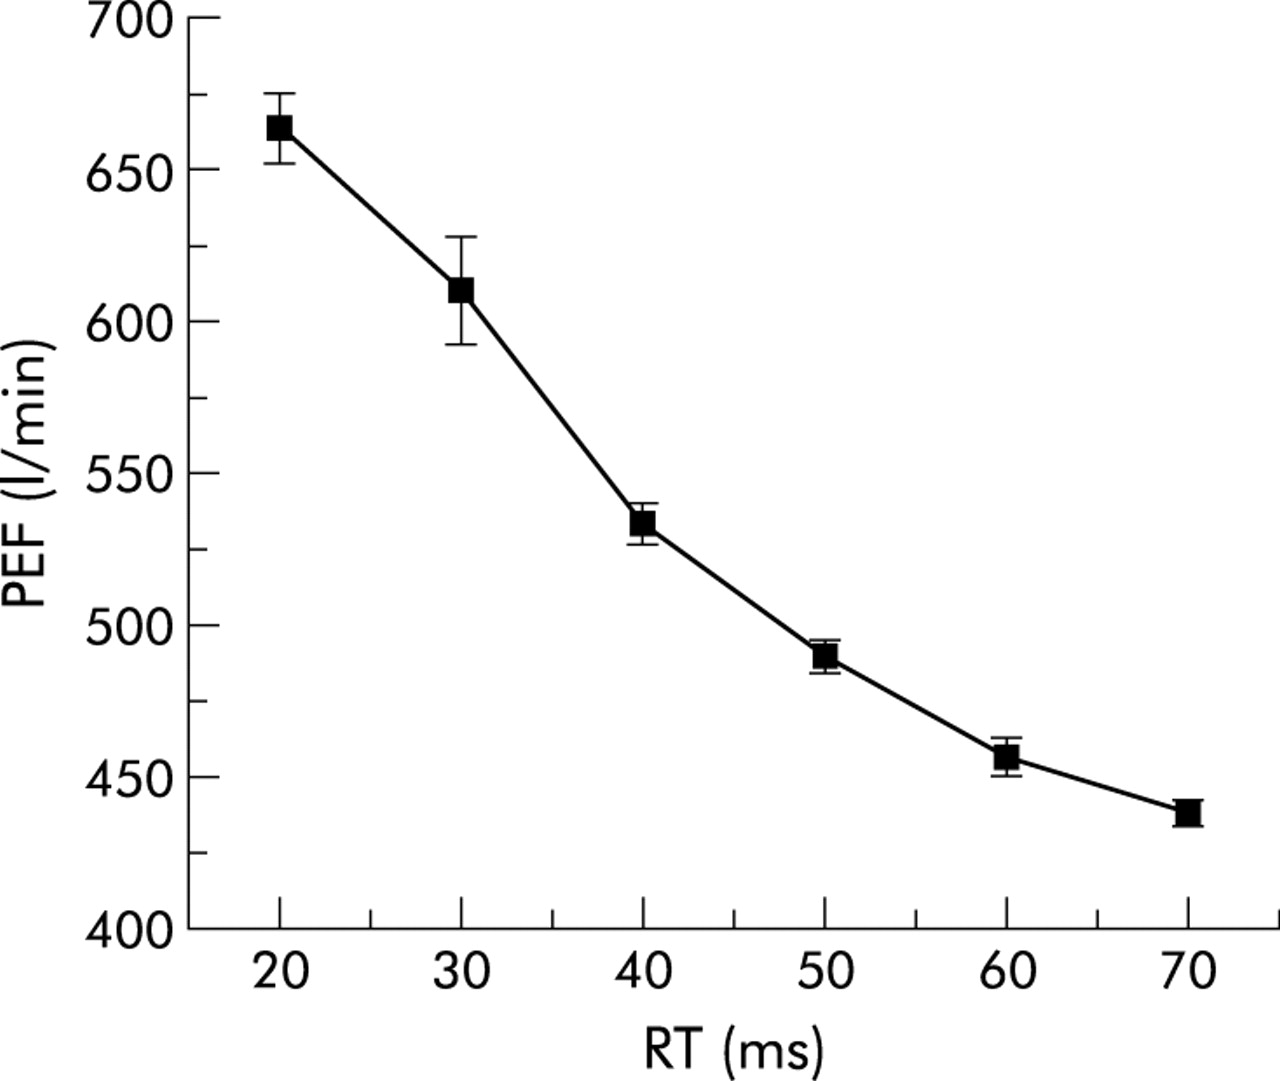
The results for testing the various devices five times with profiles A and B at each of two different chamber pressures are shown in table 2. The readings for the TZ and MS indicate that these meters are very markedly underdamped—that is, the reading considerably overshoots with a brief impulse of flow. The V meter is also slightly underdamped and the MW is very slightly overdamped—that is, the MW slightly underestimates the true flow when this is a brief impulse of flow. However, neither the V nor MW meter had errors in this respect that exceeded the ATS requirements for accuracy. In order to explore the influence of RT and DT separately on the overshoot for the MS meter, profiles were generated with an RT of 70 ms (the median value for normal subjects3) and DT reducing in six decrements from 50 ms down to 15 ms. These were each discharged three times to the MS meter and the PEF did not significantly vary with DT (ANOVA, F=0.499, p=0.79). When profiles with a constant DT of 50 ms (median value for normal subjects) and RT reducing from 70 ms to 20 ms were discharged to the MS meter with the same driving pressure at PEF, the overshoot was as shown in fig 4. The overshoot was 12% (52 l/min) when the RT was 50 ms, which is the median RT value for patients with chronic airflow limitation,3 and 39% (172 l/min) when the RT was 30 ms which is the 10th centile for RT in patients with chronic airflow limitation.
Mean (SD) results from delivering profiles A and B five times to each of the four flow measuring devices under identical conditions

Plot of mean PEF (with SD) recorded by the MS meter for three discharges at a pressure of 2 bar of profiles with dwell time (DT) constant at 50 ms and varying rise time (RT).
The results for the PEF meters and the PT when tested five times with the pump system and the 26 ATS waveforms are shown in table 3. This table shows the absolute error for the mean flow in l/min for the five readings with the percentage error in brackets. All five flow meters met the ATS criteria for accuracy, which allows for up to three errors in excess of 12% of true value or 25 l/min (whichever is the greater) when two meters are each tested with the 26 waveforms.2 The repeatability of readings for each device was expressed as the span of the five readings for each profile—that is, the difference between the highest and lowest reading recorded. The maximum span of five readings on any of the profiles for the PT, MW and V were 4, 5, and 5 l/min, respectively, and for the MS and TZ were 30 and 20 l/min, respectively (both with profile 26). The PEF for profile 25 was beyond the working range of the TZ and the MS meters.
ATS profiles 1–26 with their “true” PEF and the error for the mean of five PEF readings (recorded minus the “true” value from the input profile) in l/min with the error as % of true in parentheses
DISCUSSION
We have shown that, when tested with an adequate device for testing the dynamic response characteristics, some meters do not meet the necessary accuracy requirements for testing PEF in humans and yet appear to meet the current ATS standards. Clinicians have recognised that, with certain PEF meters, it is possible for subjects to tongue or spit8 as they record their PEF in order to achieve a higher result. Meters with adequate dynamic response characteristics would not be as susceptible to this sort of manipulation. In addition, patients with airflow limitation using a meter that is underdamped might obtain a falsely high reading as their airflow limitation deteriorated, since the RT and DT are shorter in patients with airflow limitation.3
The discordance between our findings and the use of the 26 ATS waveforms means that either the method we now propose is incorrect or the ATS recommendations are not stringent enough for testing PEF meters. The modified explosive decompression device we have used has been shown to deliver profiles with the specified accuracy when measured with a PT of adequate frequency response. The data in table E1 indicate that the 26 waveforms do not contain a sufficiently high frequency content to match that found in the client population. A meter is allowed to fail three of the 26 ATS profiles and, if these included profiles with the highest frequency content, then the next highest frequency content (6 Hz as the 99% limit of the power spectrum) is less than the mean for the 24 patients with airflow limitation we have previously tested.
If the ATS were to adopt profiles with sufficiently short RT and DT, their delivery by a pump system would present particular difficulties.4 A method has been suggested to overcome the limitations inherent in pump systems when delivering demanding profiles.9 This used a PT of adequate frequency response to check whether the system’s output was accurate, then the input profile was iteratively adjusted until the desired output was achieved. However, when altering the output impedance on a pump system the characteristics of the whole device change, so it cannot be relied upon to be the same for any new set of operating circumstances. The iterative method therefore has to be undertaken for each device separately and assumes that the PT has ideal recording characteristics. Furthermore, the PT should not be placed upstream of any other flow device unless the common mode rejection characteristics of the differential pressure transducer of the PT have been shown to be satisfactory for operation under the higher pressure conditions upstream of the meter under test.
For explosive decompression devices we have shown that the output impedance offered by the flow meters10 is trivial compared with the impedance offered by the solenoid valve, so the output of this explosive decompression device is not affected by such meters. One limitation of explosive decompression devices is that their true output can only be known by an external reference calibration procedure5 with another flow meter. However, the method proposed here is independent of any calibration by another flow recording device since it relies only on the driving pressure and aperture of discharge being identical while there is a change in profile shape. Once the relationship between starting chamber pressure and pressure at PEF has been established for the two profiles, it is possible to undertake rapid repeated testing in a reliable way. This simplicity has considerable merit over any more complex iterative procedure using a pump for tuning profiles to meters under different test conditions.9 Since this work was instigated, several newer types of fast response solenoid valves have become available so this equipment can now be produced relatively cheaply. Furthermore, we have used a small volume compression chamber of about 8 litres by modifying a previously validated system5; however, by using a larger chamber there would be less pressure decay during profile delivery which would be an advantage.
The explosive decompression device can be used with the two proposed profiles to test the dynamic response characteristics of flow meters with a discrete analogue output and also those with a continuous analogue output such as a PT. However, this device has the additional advantage that it can also be used to deliver an off-step test to define the full frequency response characteristics of devices with a continuous output. This facility is not readily available from a pump system where sudden cessation of airflow is not easy to obtain.
It may be suggested that PEF meters are only trend measuring devices and so their accuracy is not very important. We have previously shown that the curvilinear error of some meters7 would markedly distort any recording of PEF variability,11 so the accuracy of the meter is important. More important still is the fact that all the major guidelines on the management of asthma12–14 determine the severity of asthma and the appropriate level of step treatment by referring to PEF with respect to a previous best value or a predicted value. These guidelines also include criteria for the discharge of asthma patients from the emergency room using PEF as a percentage of the previous best or of a predicted value. We have shown that with some meters a patient with a short RT to PEF may obtain a falsely high reading and so could be inappropriately discharged from the emergency room. This error might occur even when referencing to the patient’s previous best reading if the type of meter used for the emergency room measurement was different from that used to record the previous best value.
One can use the data from table 2 to estimate the impact of poor frequency content on patient management. Consider the assessment of an asthmatic woman aged 40 years and height 1.56 m (predicted PEF 480 l/min) whose true PEF recorded by a PT at the time of a clinical exacerbation was 190 l/min (39% of predicted). This patient is in the category where admission should be considered from an emergency department.12 If this PEF was achieved with a very short RT, as has been found in the presence of airflow limitation,3 then her PEF with the TZ meter would be falsely recorded as 240 l/min (50% of predicted). This reading is now in the possible discharge category so her clinical management, according to the BTS guidelines,12 would be altered solely because of the type of meter used. We have shown that for one of the meters an overshoot of more than 10% in the PEF reading is likely to occur in half of patients with airflow limitation, and the PEF could overshoot by as much as 40% for one in 10 such patients. The choice of meter used by hospitals in their emergency room therefore has implications with regard to clinical governance and risk assessment for the discharge of asthma patients. In the UK it is unlikely that the two meters we have found to have the worst frequency response would be used in this setting since, unlike the V and MW, they cannot be prescribed under the UK drug tariff for prescription; this might not be true in other countries.
We have shown that inexpensive and widely used PEF meters can meet the more stringent dynamic response test we propose. This new test does not demand excessive technical requirements of meters but matches the requirements of the meters to the input signals that patients produce. We propose that flow meter dynamic response characteristics should be tested using this method with an explosive decompression device, so that both patients and clinicians can be certain that PEF meter readings truly reflect the degree of any airflow limitation. A new EU standard for PEF meter performance is currently being established that addresses these issues,15 so in future all meters available in the EU would be free from the errors we have demonstrated.
Supplementary materials
. Web-only Tables
Files in this Data Supplement:
- [View PDF] - Details of PEF, FEV1, and FVC for the 26 ATS waveforms together with the RT, DT, and the frequency limit for 95% and 99% of the power spectrum for these waveforms and profiles A and B
- [View PDF] - Delivered rise time (RT) and 90% dwell time (DT) in ms recorded using the pneumotachograph when the mini-Wright meter was positioned upstream, and their difference from the input RT and DT for the 26 ATS profiles delivered by an optimal pump system
Footnotes
-
Funding: EC Contract MAT1-CT-930032.