Article Text

Abstract
BACKGROUND Since few studies have assessed the repeatability of non-bronchoscopic bronchoalveolar lavage (NB-BAL), we compared cellular counts and cytokine concentrations in fluid obtained by standardised NB-BAL from each side of 20 intubated infants receiving extracorporeal membrane oxygenation (ECMO).
METHODS Total cell counts were obtained from 95 paired lavages and 77 pairs were suitable for differential counts and measurement of cytokine concentrations.
RESULTS Moderate correlation was noted between the two sides for most cell types including total cell counts and percentages of neutrophils and macrophages (R=0.70–0.84) and for cytokine concentrations (IL-8 R=0.78, IL-6R=0.75, TNF-αR=0.64, all p⩽0.001). Using Bland-Altman analysis the mean difference between the two sides approached zero for cellular constituents (total cell counts mean difference 1.7, limits of agreement –187.5 to +190.9 × 10⁴/ml; percentage neutrophils –3.9%, –41.5% to +33.6%; percentage macrophages 3.9%, –33.8% to +41.6%) but tended to be greater on the right for logarithmically transformed cytokine measurements (IL-8: left/right ratio 0.74, limits of agreement 0.12 to 5.45, IL-6: 0.93, 0.09 to 5.87, and TNF-α: 0.93, 0.27 to 3.16). Using linear regression with random effects to assess the variability, only the infant's age appeared to influence the cellular results but, for cytokines, only the volume retrieved affected the variability. The magnitude of the measurements, the underlying disease, the operator's experience, days on ECMO, or survival did not affect the variability.
CONCLUSION Measurements obtained by NB-BAL need to be interpreted with caution and strongly suggest that normalisation for the dilutional effects of saline is essential.
- non-bronchoscopic bronchoalveolar lavage
- bronchoalveolar lavage fluid
- extracorporeal membrane oxygenation
Statistics from Altmetric.com
- non-bronchoscopic bronchoalveolar lavage
- bronchoalveolar lavage fluid
- extracorporeal membrane oxygenation
Although the newer neonatal bronchoscopes have a suction channel, it is often inadequate to permit satisfactory bronchoalveolar lavage (BAL) of infants, especially neonates. Non-bronchoscopic lavage (NB-BAL) has therefore been frequently used in intubated infants to study underlying disease processes.1-4NB-BAL is a simple modification of routine endotracheal suction of infants receiving mechanical ventila-tion. It has been used to study the bronchoalveolar milieu in intubated neonates and infants, particularly in the study of the neonatal respiratory distress syndrome and chronic lung disease of prematurity.5-9
NB-BAL in infants, however, has so far lacked any standardisation and there is significant variation in the lavage procedure in reported studies.2 There are marked differences in choice of catheter size, site of sampling, volume of normal saline instilled, and processing of samples after retrieval. For instance, some investigators prefer “true” bronchoalveolar lavage with the suction catheter wedged in the right lower lobe,5-7 ,10 while others have used tracheal aspirates.11 ,12 Some investigators instil a fixed volume of normal saline13 ,14 while others use a volume based on body weight.5-7 ,10 The repeatability for each method and each individual variable has been poorly studied.2
NB-BAL has been used in infants receiving mechanical ventilation for underlying respiratory disease. Both cellular and non-cellular constituents (especially cytokines) have been studied in the returned lavage fluid. Indeed, with this technique it is now generally accepted that pulmonary inflammation is an important risk factor for the development of chronic lung disease of prematurity.3 ,6 ,7The recent report by the Task Force on Paediatric BAL organised by the European Respiratory Society suggested standardisation of NB-BAL of ventilated newborn infants.2 An area of interest to both adults and children is the repeatability and reproducibility of the results obtained using BAL.
In order to assess the repeatability of this method lavages of multiple sites would be required, which is clearly not possible in sick infants requiring mechanical ventilation for severe respiratory failure as the underlying disease may be exacerbated. Extracorporeal membrane oxygenation (ECMO) is used to support infants with severe reversible respiratory failure who have failed on conventional management.15 Common conditions leading to severe respiratory failure in this age group include meconium aspiration syndrome, persistent pulmonary hypertension of the newborn, neonatal respiratory distress syndrome (RDS), infection, and congenital diaphragmatic hernia. During ECMO gas exchange occurs independently of the lungs. Infants receiving ECMO remain intubated and are ventilated mechanically with low airway pressures to prevent complete airway collapse and to permit recovery of the acute lung injury. Since gaseous exchange is independent of the lungs, ECMO provides a unique opportunity to perform NB-BAL of the right and left sides without compromising the infant. In this study we assessed the repeatability of NB-BAL by comparing cellular and non-cellular constituents in BAL fluid obtained by NB-BAL from each side in infants receiving ECMO for severe reversible respiratory failure.
Methods
PATIENTS
The parents of all infants less than 15 months of age with primary respiratory failure admitted to the Heartlink ECMO Centre, Glenfield Hospital, Leicester between October 1996 and January 1998 were invited to join the study. Those who required ECMO primarily for cardiac support after surgery for congenital heart disease were excluded. As is routine with ECMO, the oxygenation index (mean airway pressure × fraction inspired oxygen/arterial oxygen tension) on referral was used as a marker of severity of respiratory failure. The study was approved by the local ethics committee and informed consent was obtained from the parents to perform NB-BAL on the infants.
PROCEDURE
A single operator (RJM) carried out all lavage procedures and the subsequent sample analysis blindly. The infants underwent standardised NB-BAL of the lower lobes of both lungs as soon as possible after cannulation for ECMO. Thereafter, bilateral NB-BAL was carried out once daily at the time of routine endotracheal suction until decannulation from ECMO. The lavage procedure was deferred if clinically contraindicated due to cardiorespiratory instability, pulmonary haemorrhage, or temporary interruption of extracorporeal support. Standardised NB-BAL was performed according to the ERS Task Force guidelines and as previously described.2 ,5-7Briefly, with the infant positioned supine and the head turned to the left, a size 6–8 Fr straight suction catheter with two side holes was gently passed through the end porthole of the ventilatory circuit until it was wedged in the right lower lobe. An aliquot of 1 ml/kg bodyweight of normal saline at room temperature was instilled. This was retrieved after 2–3 ventilator breaths into a suction trap using a suction pressure of 5–15 kPa. Immediately thereafter a second aliquot of 1 ml/kg bodyweight of normal saline was instilled and sucked back. The two retrieved samples were pooled. The procedure was then repeated with the head turned to the right to lavage the left lower lobe. The BAL fluid samples from each side were processed separately. Macroscopically bloodstained samples were discarded. The most commonly encountered complication was transient bradycardia resulting from a vasovagal reaction to insertion of the suction catheter.
PROCESSING OF BAL FLUID SAMPLES
After the lavage procedure the volume of the recovered BAL fluid was recorded and the sample centrifuged within 10 minutes of collection at 1800 rpm for 10 minutes at room temperature. The supernatant was removed and stored at –70°C until further analysis. The cell pellet was resuspended in a known volume of saline. The total cell count was obtained with a haemocytometer, and the differential cell count was obtained by staining a cell cytospin with Diff-Quick stain (Merck & Dade AG, Duedingen, Switzerland) and counting at least 300 cells per slide. The cell counts were performed by RJM after randomly relabelling the slides to ensure blinding. The total cell counts for the various cell types were obtained from the total cell count and differential counts and expressed as cell number/ml BAL fluid.
CYTOKINE MEASUREMENTS
Concentrations of the cytokines interleukin (IL)-8, IL-6 and tumour necrosis factor TNF(α) in the BAL fluid supernatant were measured by an automated ELISA analyser (DPC Europe Ltd, UK) according to the manufacturer's instructions by an independent researcher (JRV). The lowest sensitivity of the analyser was 2 pg/ml for IL-8, 1 pg/ml for IL-6, and 1.7 pg/ml for TNFα. In accordance with ERS Task Force guidelines2 we did not attempt to correct for dilution and concentrations were expressed as pg cytokine/ml BAL fluid.
STATISTICAL ANALYSIS
The absolute and differential cell counts and cytokine concentrations for the left and right sides were firstly compared by linear regression, calculating the Pearson correlation coefficient (R value), p value, and 95% confidence interval. Statistical significance was assumed at p<0.05. Secondly, the Bland-Altman method16 was used. This consisted of plotting the difference between each pair of measurements against their mean value, then using the mean and standard deviation of the differences to calculate the 95% limits of agreement—that is, the range in which the difference may be expected to lie in 95% of the samples; 95% confidence intervals were calculated to indicate the precision of the limits of agreement.
Since the Bland-Altman plots of the absolute cell counts and cytokine concentrations demonstrated dependence of left-right variability on the overall magnitude (mean of left and right)—seen as “funnelling” on the graphs—the corresponding limits of agreement were calculated using a logarithmic scale and presented as the ratio between left and right. (Logarithmic transformation was not performed for percentage of cells since funnelling was not observed.)
It was hypothesised that the variability might be due to (a) the age of the child, (b) the underlying disease, (c) the experience of the operator (RJM), (d) time spent on ECMO, (e) volume of BAL fluid retrieved (volume retrieved from left side/volume retrieved from right side), or (f) survival. Linear regression with random effects due to the multiplicity of measurements on each child was used to examine the hypothesis separately for the various cellular and non-cellular constituents. Analysis was performed using a statistical package for microcomputers (spss Base 9.0, SPSS Inc, Chicago, IL, USA;stata Statistical software 6.0, Stata Corp, College Station, TX, USA).
Results
PATIENT CHARACTERISTICS
Twenty infants (14 male) with a median age of 2 days (range 1–402) and weight of 3.3 kg (2.0–10.0 kg) were recruited. Almost all infants were neonates with only three infants being older than 30 days of age. The median oxygenation index was 46 (range 19.6–97.1). One patient had an oxygenation index of 19.6 but, because of multiple organ involvement, he was placed on veno-arterial ECMO to support the circulation as well as the respiratory system. The diagnostic groups are shown in table 1. Median time on ECMO was 143 hours (range 71–406). Eleven patients received veno-venous ECMO and nine were placed on veno-arterial ECMO. Fourteen survived and there were six deaths (table 1).
Diagnostic groups of survivors and non-survivors
COMPARISON OF BAL FLUID CELL COUNTS ON LEFT AND RIGHT SIDES
Ninety five paired NB-BAL samples were obtained. Total white cell counts were obtained from all samples but only 77 pairs were suitable for differential cell counts. The predominant cell types were neutrophils and alveolar macrophages. Few lymphocytes, eosinophils, and epithelial cells were seen. Detailed data are therefore given in graphical form for neutrophils and alveolar macrophages only (figs 1and 2) and the results for all cell types are summarised in table 2.
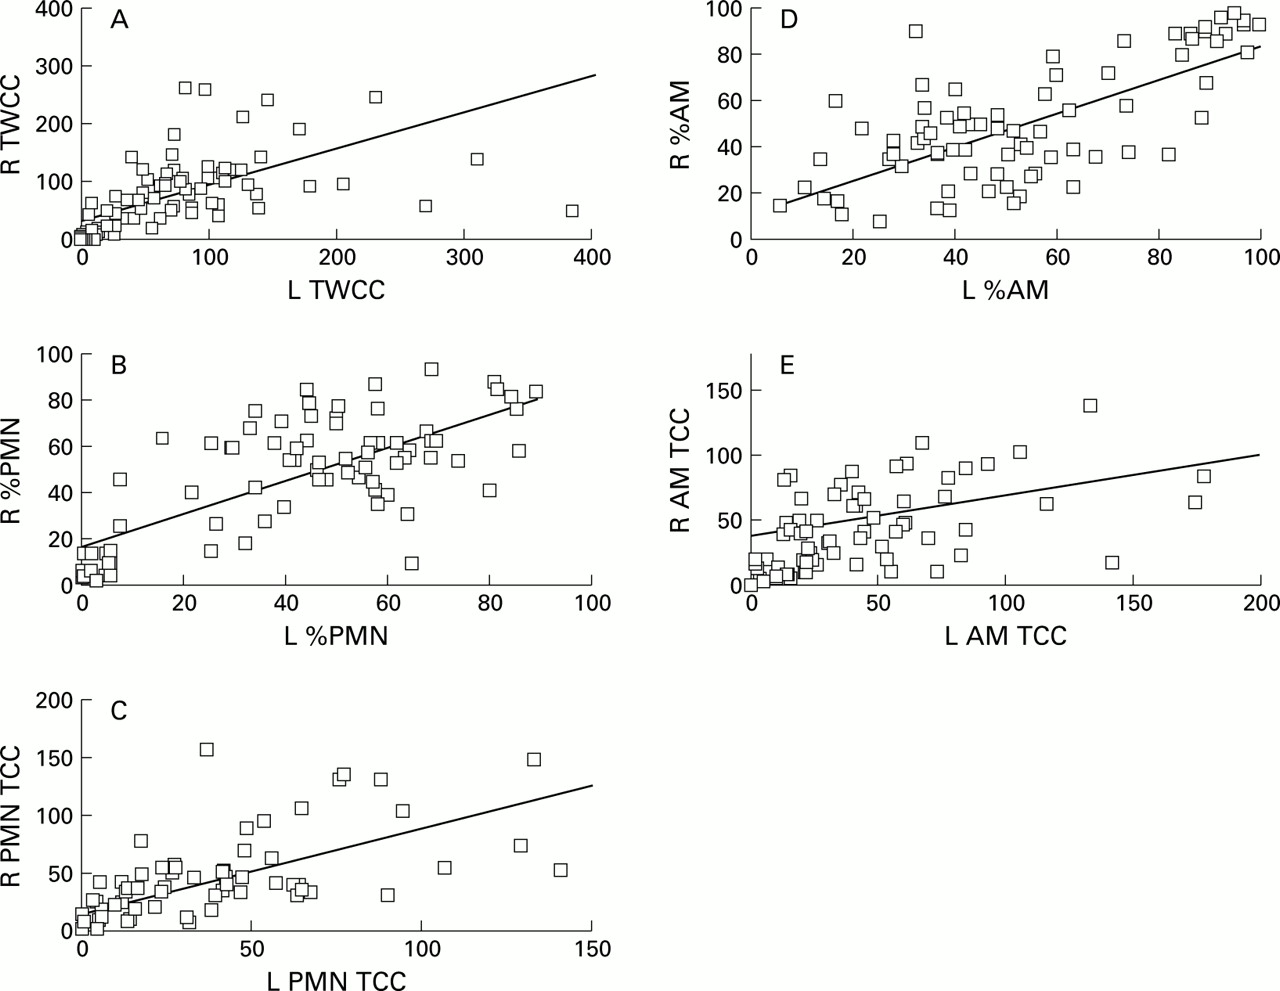
Correlation coefficients and linear regression lines for results between the right and left sides for (A) total white cell counts (TWCC, R=0.79, p<0.001), (B) percentage neutrophils (%PMN, R=0.72, p<0.001), (C) neutrophil total cell counts (PMN TCC, R=0.83, p<0.001), (D) percentage alveolar macrophages (%AM, R=0.70, p<0.001), and (E) alveolar macrophages total cell count (AM TCC, R=0.44, p<0.001). Cell counts are given in 104 cells/ml BAL fluid.

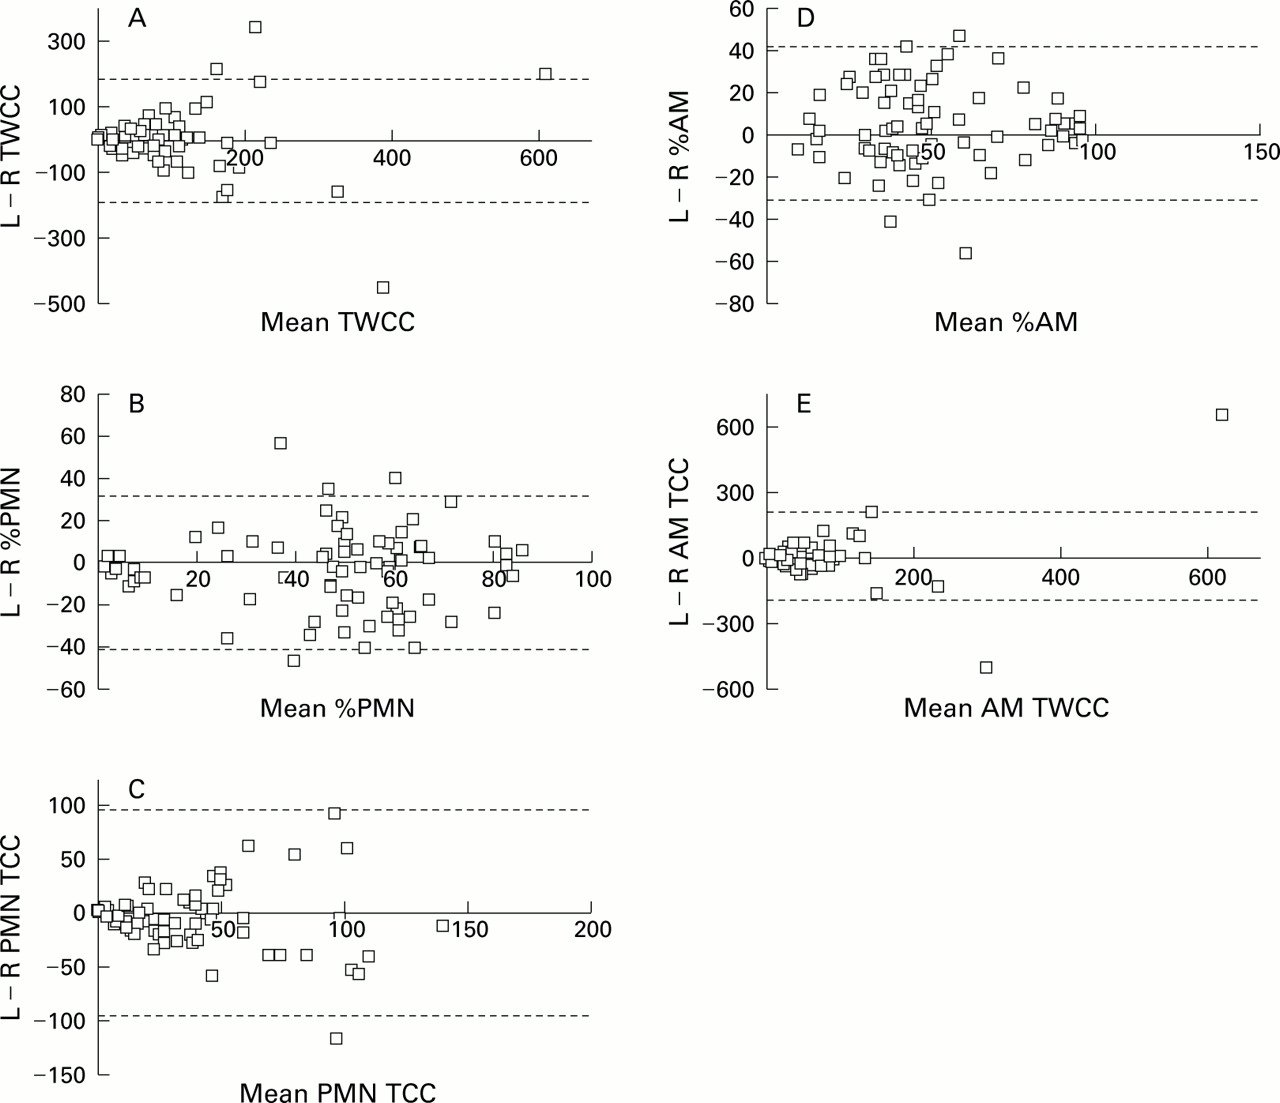
Bland-Altman plots showing mean difference between the right and left sides and limits of agreement for (A) total white cell counts (TWCC), (B) percentage neutrophils (%PMN), (C) neutrophil white cell counts (PMN TCC), (D) percentage alveolar macrophages (%AM), and (E) alveolar macrophages total cell counts (AM TCC). The horizontal line denotes the mean difference between the two sides and the dotted lines the limits of agreement. Cell counts are give in 104 cells/ml BAL fluid. Note the near zero mean difference between the two sides and the wide limits of agreement for each parameter studied.
Total white cell counts (TWCC), percentage and total cell counts (TCC) for neutrophils (PMN), alveolar macrophages (AM), lymphocytes, and epithelial cells
There was a strong positive correlation between the two sides for total white cell counts, percentage neutrophils, absolute number of neutrophils, percentage macrophages, and percentage epithelial cells with R values ranging from 0.70 to 0.84 (all p<0.001, fig 1, table 2). For absolute cell counts of macrophages, lymphocytes, and epithelial cells and for percentage lymphocytes the correlation between the two sides was weaker withR values of 0.44–0.56 (all p<0.001, fig 1, table 2).
When the results were compared by using the more appropriate Bland-Altman analysis the mean difference between the right and left sides approached zero for all cell types (table 2, fig 2A–E). In addition, the 95% confidence intervals always included zero. However, the limits of agreement for all cell types studied were wide ranging from –187.5 to +190.9 × 10⁴/ml BAL fluid for total white cell counts, –41.5% to +33.6% for percentage neutrophils, and –33.8% to +41.6% for percentage alveolar macrophages (table 2).
When the data were logarithmically transformed—that is, where “funnelling” was seen—the corresponding limits of agreement (now shown as proportions due to transformation) were 0.15 (95% CI 0.11 to 0.21) to 5.80 (95% CI 4.19 to 8.05) for total cell counts, 0.13 (95% CI 0.09 to 0.18) to 4.65 (95% CI 3.24 to 6.67) for total neutrophils, and 0.17 (95% CI 0.12 to 0.24) to 6.62 (95% CI 4.58 to 9.58) for total alveolar macrophages.
COMPARISON OF CYTOKINE CONCENTRATIONS
The concentration of IL-8 was estimated in 76 paired BAL samples, IL-6 in 74 pairs, and TNFα in 73 pairs due to the limited volume obtained for some samples. The mean concentrations were 4.96 pg/ml, 0.97 pg/ml and 0.18 pg/ml for IL-8, IL-6, and TNFα, respectively for the left side and 4.92 pg/ml, 1.21 pg/ml, and 0.14 pg/ml for the right side. Comparison between the left and right sides for IL-8 concentration showed a moderate positive correlation (R=0.66, p<0.001, table 3). For TNFα and IL-6 the correlation was weaker with Rvalues of 0.39 and 0.42, respectively (p=0.001, table 3). The results of the Bland-Altman plots showed that the difference between the two sides was close to zero but the limits of agreement were large for each cytokine studied (table 3). The limits of agreement were 3–5 times greater or lower than the mean for each cytokine studied, suggesting that the results from the two sides may vary up to several times.
Comparison of concentration of cytokines in BAL fluid obtained from left and right sides
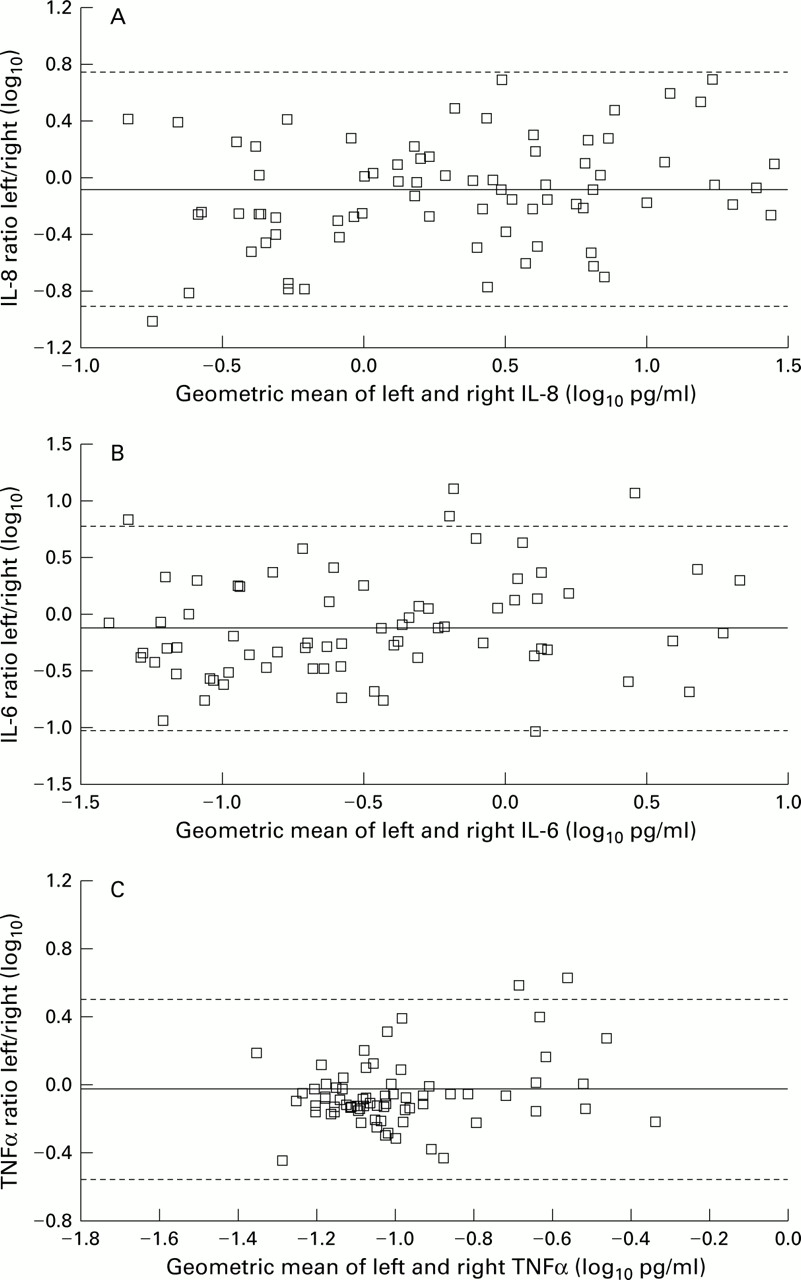
Since marked “funnelling”—that is, larger differences were noted as the magnitude of the measurements increased—was noted for all three cytokines studied, the analysis was repeated using logarithmically transformed data (figs 3 and 4, table 4). For all three agents studied there was moderate correlation between the two sides for the logarithmically transformed data with an Rvalue of 0.78 for IL-8, 0.75 for IL-6, and 0.64 for TNFα (all p<0.001). Bland-Altman analysis using logarithmically transformed data, thus shown as a ratio of left/right, were 0.82 (95% CI 0.66 to 1.02) for IL-8, 0.74 (0.58 to 0.94) for IL-6, and 0.93 (0.80 to 1.07) for TNFα. Similarly, the limits of agreement were wide: 0.12–5.45 for IL-8, 0.09–5.87 for IL-6, and 0.27–3.16 for TNFα, suggesting that the concentrations may vary by up to 10 times between the two sides.

Correlation between the values for (A) IL-8, (B) IL-6, and (C) TNFα concentrations for BAL fluid samples from the right and left sides. Pearson's correlation coefficient is given for each graph. P values for all graphs are <0.001.

Bland-Altman plots for the logarithmic transformed data for (A) IL-8, (B) IL-6, and (C) TNFα. Note that the mean difference between the two sides includes one for IL-8 and TNFα but not IL-6. Also note the wide upper and lower limits of agreement for all three cytokines studied.
Comparison of concentrations of cytokines in BAL fluid obtained from the left and right sides using logarithmic transformed data
POTENTIAL SOURCES OF VARIABILITY
To explain the large variability noted for each parameter studied we examined a number of factors that may have accounted for the variability including (a) the age of the child, (b) underlying disease process, (c) time spent on ECMO, (d) experience of the operator, (e) survival, and (f) volume retrieved. In the initial analysis the only significant factor for cellular constituents was age of the child on presentation (p<0.05 for total cell counts, absolute alveolar macrophages, and neutrophil counts but not for percentages of neutrophils or macrophages). However, no significant contribution to variability for any cell type was noted from time on ECMO, underlying disease type, experience of the operator, volume of fluid retrieved, or survival. The contribution of age to the variability was no longer noted when we restricted the analysis to infants aged under 3 months.
When random effects linear regression was applied to cytokine measurements, only the volume of fluid retrieved appeared to be significantly associated with the variability observed for IL-8 (p=0.003) and TNFα (p=0.008) but not IL-6 (p=NS). Furthermore, the results showed a negative coefficient suggesting that, the larger the volume of fluid recovered, the lower the concentration of IL-8 and TNFα (fig 5). We also reanalysed the data using the difference between the volume retrieved from the two sides instead of the proportion of left to right of volume retrieved and found the same results. Similar results were obtained for both untransformed and logarithmically transformed data.

Logarithmic transformed data for the ratio of left/right volume retrieved plotted against the logarithmic data for the ratio of left/right cytokine concentrations to determine whether the concentration of cytokine was related to the volume of BAL fluid recovered. The results show that for IL-8 and TNFα but not for IL-6 the concentration of cytokine is inversely related to the volume of BAL fluid recovered.
Discussion
NB-BAL is a commonly used technique to study respiratory diseases of infants receiving mechanical ventilation. Our results demonstrate a number of points: (1) great variability was noted for both cellular counts and cytokine concentrations when the left and right sides were compared; (2) the volume of fluid retrieved, but not age, influenced the variability observed for cytokine concentrations but, in contrast, age but not volume retrieved affected variability in cell counts; (3) neither the underlying disease process, time spent on ECMO, experience of the operator, nor survival affected the variability; (4) the cytokine concentrations tended to be higher on the right side than on the left.
We consider the Bland-Altman method to be the most appropriate way of analysing and presenting the agreement for the various measurements from the two sides.16 We have, however, also presented the correlation coefficients and linear regression as these are often reported in the literature. For the absolute cell counts and for cytokine measurements the variability between left and right sides seemed to be directly dependent on the overall magnitude of the measurement (“funnelling” noted in fig 2A, C and E). We therefore repeated the Bland-Altman analysis in these cases using logarithmically transformed data and presented the results in terms of the ratio between left and right values (rather than the absolute difference). The limits of agreement remained wide for both cellular and non-cellular constituents.
It will be noted that several measurements from each infant were used. Examination of the possible sources of variability was therefore carried out using random effects linear regression which accounts for the possible “clustering” of measurements made on the same child. To further ensure the validity of this approach, we randomly selected one measurement from each child and observed similar limits of agreement for each cell or cytokine studied (data not shown).
For each cell type studied there was no significant difference between the mean results for the left and right sides. Correlation between left and right results was good for total counts of white cells and neutrophils, as well as for percentages of neutrophils, alveolar macrophages, and epithelial cells. However, correlation does not provide accurate information regarding the nature of the relationship between the results for the two sides. Furthermore, good correlation may be expected as the results relate to samples taken simultaneously from the same patient. In this situation, assessment of agreement using the method described by Bland and Altman results is more appropriate.16 Our findings show that there is considerable variability between the left and right sides for individual cell measurements. This is reflected in the relatively wide 95% confidence intervals for mean differences between left and right results. Similarly, the limits of agreement between left and right cell results were relatively large. These data suggest that the application of NB-BAL in studies based on individual results or on small groups of patients needs to be interpreted with caution.
For cytokines there was a trend towards the results being greater on the right than on the left, as suggested by the ratios being less than one for all cytokines studied (fig 4). Since we had included patients with congenital diaphragmatic hernia (all children had left sided hernias), this observation may have been expected. However, we were unable to attribute this to the underlying disease process. Most of the infants requiring ECMO had received several days of mechanical ventilation with high pressures and >90% inspired oxygen. The acute lung injury therefore resulted not only from the underlying disease process but also from the injury induced by conventional treatment. Since the right main bronchus is more vertical than the left, it is tempting to speculate that greater barotrauma or volutrauma was transmitted to that side by mechanical ventilation, resulting in greater lung injury on the right side as implied by our results.
When factors that may have accounted for variability were examined, only age but not time on ECMO, experience of the operator, underlying disease process, volume of fluid retrieved, or survival were significantly associated with variability in cell counts. The effect of age was no longer significant when infants older than 3 months of age were removed from the analysis.
However, for cytokine measurements the volume of fluid retrieved studied either as a proportion of left/right sides or the difference between the left and right sides yielded very interesting results (fig5). The volume of fluid retrieved clearly appeared to be related to the variability observed for both IL-8 and TNFα but not for IL-6. The negative coefficient suggested that the concentration of the cytokine decreased as the proportion of the volume recovered increased. This implies a dilutional effect of the saline instilled to obtain epithelial lining fluid. Current recommendations from the European Respiratory Society for both children and neonates (for which one of the authors (SK) was a member) state that BAL fluid results should be expressed per ml of fluid, especially as currently there are no satisfactory methods for estimating epithelial lining fluid.2 Our data are in disagreement with this statement as the influence of the retrieved volume on the results clearly needs to be taken into account. As we had followed the ERS guidelines, we had unfortunately made no attempt to estimate the epithelial lining fluid with any of the methods presently available.
The methods for measuring the concentration of cytokines may also influence the results. In the current study we used an automated cytokine analyser with extensive quality controls to ensure accuracy of the results. Using the controls and repeated measurements of cytokines in BAL fluid wherever possible, the results were almost always within 5% of each other. This variation is unlikely to account for the wide variability we have noted for the two sides. Because of the limited volume of fluid obtained from infants receiving ECMO, it would be difficult to perform the measurements in triplicate or more.
In conventionally ventilated infants a repeatability study would be unethical and dangerous. Patients undergoing extracorporeal support offer a unique opportunity for a repeatability study of NB-BAL because they are not dependent on their lungs for gas exchange. The most commonly encountered complication was transient bradycardia. No major adverse events affecting patients occurred during the study. This is in agreement with other studies in conventionally ventilated infants.1 ,2 ,4 ,10
Patients presenting for ECMO are unique. On the one hand they form a heterogeneous population in terms of underlying diagnosis while, on the other, they invariably have been ventilated with high Fio 2 and high mean airway pressures for a significant period of time, leading to radiologically uniform lung disease. We were particularly interested to determine whether the underlying disease process contributed to the variability in both cellular and cytokine constituents observed from the two sides, but were unable to contribute the variability to the underlying disease process despite the infants receiving ECMO for various diseases including congenital diaphragmatic hernia in which differences between the two sides may be expected. There were apparent differences in white cell populations between the left and right lungs in patients with congenital diaphragmatic hernia, meconium aspiration syndrome, and persistent pulmonary hypertension of the newborn. Several studies in adults with sarcoidosis using fibreoptic bronchoscopy have shown good correlation for the percentage of lymphocytes between BAL fluid samples from left and right lungs.17-19 A small group of patients showed a significant interlobar difference in lymphocyte percentage which appeared to be related to focal infiltrates on chest radiographs in two studies.18 ,19 In other types of interstitial lung disease a higher degree of interlobar variability was found which was not related to the appearance of the chest radiograph.17 ,19 Infants who are placed on ECMO quickly develop similar radiological changes on both sides with an initial “white out” thought to be due to a transudative process followed by gradual resolution with time as pulmonary inflammation improves. Thus, one would expect similar findings for both cells and cytokines from both sides.
Previous studies have investigated fluid and cell recovery but not repeatability with NB-BAL of ventilated human infants. Grigget al found a significant difference in the percentage of macrophages between the first and second aliquot but not in volumes retrieved or in total cell counts.10 Using fibreoptic bronchoscopy in human adults, two studies have addressed the effect of instilled fluid on volume and cell recovery.20 ,21 Both showed differences in differential cell counts for the lower and higher volume of BAL fluid instilled. These studies suggest that, with small volume lavage, the returned cells originate mainly from the proximal airways while, with larger volumes, the distal airways including alveoli are sampled. This is supported by additional studies by Kelly et al who investigated the distribution of fluid during the BAL procedure.22 While aspirating the first aliquot of radio-opaque BAL fluid under radiographic imaging, fluid movement towards the bronchoscope was seen only in the proximal airways. Lavage fluid more distally actually moved away from the bronchoscope. With further aliquots BAL fluid was retrieved from the entire lung segment.
In healthy human volunteers Pingleton et alshowed that fluid volume and total cell recovery were highest when the right middle lobe was lavaged.23 There was no difference between lobes in cell count/ml BAL fluid. The pH and temperature of the instilled fluid did not affect cell or protein recovery. Similar observations were made by Laviolette and colleagues in normal dogs.24 They found a significant difference in the recovery of total number of cells between the left lower and right middle lobe, but not in percentage macrophages. In normal rats cell recovery was found to be dependent on the type of catheter and the use of bronchoscopic guidance.25 To minimise the effects of these variables we used a standardised method of NB-BAL and subsequent lavage fluid processing. Unlike BAL using fibreoptic bronchoscopy, NB-BAL is carried out blindly. Despite this, it is likely that the suction catheter reached the intended site on most occasions. Placzek and Silverman studied catheter placement in NB-BAL26 and showed that, by turning the head to the left, the suction catheter was passed into the right main bronchus in over 95% of cases. In a necroscopic study Grigg et al 10confirmed that, with the infant's head turned to the left, the right lower lobe is lavaged. In the present study four lavage procedures in two patients were carried out at the time of routine chest radiography and, on each occasion, the catheter was directed as anticipated to the contralateral lobe. A catheter was inserted into both the right and left sides simultaneously with the head turned towards the opposite side and on the chest radiograph the two catheters were seen to have entered the expected contralateral lobes (data not shown). We can therefore make a reasonable assumption that the catheter entered the expected lobe at the time of NB-BAL. Since we were unable to attribute the variability to the underlying disease process, experience of the operator, fluid retrieval, days on ECMO, survival, or age (in infants less than 3 months of age), it is likely that the variability is due to the technique itself. The placement of the catheter and distribution of the instilled fluid may contribute to the variability reported.
In conclusion, our results have shown a wide variation in both cell counts and cytokine concentrations between the left and rights sides for standardised NB-BAL of infants receiving ECMO. The wide variation in cell counts may be related to the age of the infant but, interestingly, the concentrations of cytokines appeared to be influenced by the volume of fluid returned by the procedure, suggesting that normalisation for dilutional effects of saline is essential for cytokines but not for cells. The small differences between the two sides, especially in cell counts, suggests that the technique may be useful for population studies but individual results must be interpreted with caution.
Acknowledgments
Dr Julian Vyas was supported by the British Lung Foundation. The authors would like to thank the staff and parents at the Heartlink ECMO Unit at Glenfield General Hospital. Part of the data was presented at the American Thoracic Society in May 2000 in Toronto, Canada.