Article Text

Abstract
BACKGROUND Asthma has been associated with eosinophil activation, measured in serum, sputum, bronchoalveolar lavage (BAL) fluid, and urine. A whole blood automated method was developed to assess eosinophil and neutrophil activity in terms of peroxidase content and cell morphology using the Bayer haematology analyser. The method was applied to an in vitro stimulation model when fMLP was added to whole blood and the samples were then analysed for changes in granularity and shape. In addition, cells stimulated with interleukin (IL)-8 were examined by electron microscopy.
METHODS A cross sectional analysis was performed on venous blood from non-atopic, non-asthmatic normal subjects (n = 37), mild (n = 46) and symptomatic (n = 22) asthmatic patients on inhaled β2 agonist only, and more severe asthmatic patients (n = 17) on inhaled and oral corticosteroid therapy. Samples were analysed by the haematology analyser and peroxidase leucograms gated using the WinMDI software program.
RESULTS There were significant differences in the amount of light scatter by the neutrophil populations in the symptomatic (p = 0.007) and severe asthmatic (p = 0.0001) groups compared with the control group. However, abnormalities in eosinophil populations were not observed. In vitro activation of whole blood with fMLP caused similar changes in neutrophil light scatter, suggesting that neutrophil activation is present in peripheral blood of symptomatic asthmatic patients. IL-8 caused a change in shape of the neutrophils seen using transmission electron microscopy.
CONCLUSIONS Evidence of neutrophil activation can be seen in whole blood from patients with asthma using a novel automated method. This may potentially be applied to other inflammatory diseases.
- asthma
- neutrophil activation
- automated method
Statistics from Altmetric.com
Asthma is recognised as a chronic inflammatory disease of the airways with infiltration of eosinophils and mononuclear cells into the bronchial mucosa and associated vasodilation, microvascular leakage, and epithelial disruption.1 Indeed, eosinophils have been proposed as the primary cell responsible for bronchial mucosal injury, and may contribute to the airway hyperresponsiveness (AHR) of asthma. This is suggested by increased numbers of activated eosinophils, as well as eosinophil derived inflammatory mediators and granule proteins in blood, induced sputum, bronchoalveolar lavage (BAL) fluid, and bronchial biopsy specimens from asthmatic subjects.2Furthermore, the increased number of peripheral blood eosinophils correlates with symptoms of disease activity, and raised blood eosinophil counts have been found during nocturnal asthma.3
The eosinophil has characteristic specific granules that contain eosinophil peroxidase (EPO), major basic protein (MBP), and eosinophil cationic protein (ECP).4 Serum levels of these granule proteins have been used as a tool for measuring eosinophil activation in asthma,5 and levels can be related to disease severity6 and the effects of treatment. There is some evidence to suggest that eosinophils undergo activation during their migration to the lung,7 and some drugs have been shown to block this activation. For example, salmeterol inhibits the rise in serum ECP following allergen challenge without significantly affecting the eosinophil count.8 However, measurement of ECP is laborious and relies on clotting taking place at 20–24°C for 60–120 minutes which limits the clinical usefulness of this measurement. Nevertheless, along with the number of blood eosinophils, serum ECP levels have been used in numerous studies to quantitate eosinophilic inflammation.
There is less evidence for the involvement of neutrophils in asthma than for eosinophils, but neutrophils may have greater importance in the pathogenesis of severe asthma. Persistent neutrophil inflammation is present in BAL fluid, biopsy specimens, and sputum9from patients with symptomatic severe asthma treated with high dose glucocorticoids.10 Neutrophils are prominent in BAL fluid samples from patients with status asthmaticus,11 and neutrophil infiltration of the lung parenchyma has been seen in the lungs of some patients with sudden onset fatal asthma.12Furthermore, asthmatic subjects have increased levels of the neutrophil chemoattractant interleukin (IL)-8 in blood and BAL fluid,13 and stimulated neutrophils can also cause AHR in vitro.14
The Bayer H1 automated haematology analyser stains leucocytes on the basis of peroxidase activity and employs a flow cytometric procedure to measure individual cell absorption and scatter of light. A leucocyte peroxidase dot plot (fig 1) is produced. This is routinely used to determine the total leucocyte count and differential count of lymphocytes, monocytes, basophils, eosinophils, and neutrophils. The Bayer H1 can also measure the myeloperoxidase intracellular index (MPXI), a parameter derived from the mean position on thex axis of an archetypal population of neutrophils. It has been shown that the MPXI is raised in patients with unstable angina and acute myocardial infarction,15following treatment with granulocyte colony stimulating factor (G-CSF),16 and in lymphoma transplant patients who develop bacteraemia.17 In addition, the MPXI has been used to study in vitro neutrophil activation18 and to detect the presence of myeloperoxidase deficiency.19

(A) Flow cell analysis: stained cells are passed through a light source and the amount of scatter and absorption of light is detected using two sensors. (B) Representative leucocyte dot plot showing defined (gated) populations of neutrophils and eosinophils. Leucocyte populations are plotted by the Bayer H1 haematology analyser on the basis of their absorption (x axis) and scatter (y axis) of light following flow cell analysis with a light source. Each population is then gated using WinMDI software version 2.7 which automatically performs statistical analysis of each population in terms of mean and standard deviations of the position on the x and y axes.
We have adapted the Bayer H1 analyser by using the WinMDI flow cytometry computer software package. This enables analysis of both absorption (x axis) and scatter (y axis) coordinates of gated populations of neutrophils and eosinophils on the peroxidase dot plot (fig 1). Neutrophil and eosinophil activation is measured in terms of peroxidase content, granularity, size and morphology of the cells. This automated whole blood method requires minimal sample processing and results are available within minutes of sample acquisition. We have used this validated method to assess blood eosinophil and neutrophil activation in patients with asthma and following in vitro stimulation, and have compared the technique with other methods of measuring granulocyte activation.
Methods
PATIENTS/SUBJECTS
Table 1 provides a summary of the clinical details of the participants in the study. All were non-smokers. Approval for the study was obtained from the ethics committee at the Royal Brompton Hospital and all patients gave written informed consent. All subjects had an MPXI of greater than –10 to ensure that no cases of myeloperoxidase deficiency were included (five subjects were excluded on this basis: one in the normal group, three patients with mild asthma, and one with symptomatic asthma).
Clinical characteristics of study subjects
HEALTHY CONTROLS
Thirty seven age and sex matched hospital staff were defined as normal on the basis of lack of clinical history of asthma, allergy or other significant medical disease, no upper respiratory tract infection (URTI) in the past two weeks, and lack of medication.
ASTHMATIC PATIENTS
Forty six patients with mild asthma with infrequent symptoms were defined according to American Thoracic Society (ATS) criteria20—namely, a clinical history of episodic shortness of breath and wheeze; forced expiratory volume in one second (FEV1) >70% predicted; reversibility >15% with salbutamol or concentration of histamine causing a 20% drop in FEV1 (PC20) of <8 mg/ml histamine. The patients were receiving inhaled short acting β2 agonist (salbutamol or terbutaline) on an “as required” basis. Patients had not received inhaled or systemic corticosteroids, theophyllines, leukotriene antagonists, or other prescribed medications in the previous four weeks and had no URTI within the previous two weeks.
Twenty two patients with symptomatic asthma were defined by additional symptoms of cough, wheeze, chest tightness, and shortness of breath on a daily basis over the previous seven days. In most cases subjects used inhaled salbutamol to relieve symptoms.
Seventeen moderate to severe asthmatics were defined by FEV1 <80% predicted; reversibility >15% with salbutamol or PC20 <8 mg/ml histamine; all currently on either inhaled (>800 μg daily) or oral steroids, and no URTI within the preceding two weeks. These patients also had symptoms on a daily basis but were not age matched to the other groups.
BLOOD COLLECTION AND INITIAL PROCESSING
EDTA-blood
Venous blood (4 ml) was taken with a needle and Vacutainer system into a tube containing ethylene diaminetetraacetic acid (EDTA) and stored at room temperature for up to two hours prior to analysis on the Bayer H1 haematology analyser (Bayer Diagnostics, Tarrytown, New York, USA).
Serum
Venous blood (6 ml) was left to clot for 1–2 hours at 20–24°C and centrifuged for 10 minutes at 1000g. Serum was aspirated, aliquoted into Eppendorf tubes, and stored frozen at –20°C.
ADAPTATION OF SOFTWARE FOR THE BAYER H1 ANALYSER
Data from the analyser were stored on a 5¼ inch floppy disc and later converted to DOS format using Dataget software (Bayer, Dublin, Ireland). The WinMDI (version 2.7) software program was then applied to the data to permit gating and statistical analysis of individual leucocytes presented on the peroxidase dot plot. Following gating of the neutrophil and eosinophil populations, the mean positions of the cluster on the x andy axes, along with the standard deviation of these positions, was calculated automatically. The mean of the cluster position on the x axis of the peroxidase leucogram reflects the amount of light absorption, while they axis corresponds to the light scatter (fig1).
MEASUREMENT OF NEUTROPHIL AND EOSINOPHIL PARAMETERS
Whole blood (200 μl) was introduced into the analyser within two hours of sampling. Following continuous flow analysis of 500–2000 cells in a second,21 the analyser automatically creates a peroxidase leucogram consisting of a dot plot of individual cells. Neutrophil and eosinophil populations were gated on the basis of their position, gates being applied around clusters, aiming to include at least 95% of cells in a given gate. This gating was independently performed by two operators.
IN VITRO ACTIVATION OF WHOLE BLOOD
Blood was taken from six normal subjects and incubated at 37°C. A concentration of 10–6 M ofN-formyl-methionyl-leucyl-phenylalanine (fMLP, 100 μl; Sigma, Poole, UK) was added to whole venous blood (900 μl) and incubated at 37°C for 2–10 minutes. Samples were analysed using the Advia 120 analyser after different time intervals and the mean position of the neutrophil cluster was calculated automatically by this analyser. (The Advia 120 is the upgraded version of the Bayer H1 from which neutrophil coordinates are automatically determined.)
LIGHT MICROSCOPY AND ELECTRON MICROSCOPY
Light microscopy
A blood film was prepared before and after stimulation of whole blood (2 ml) with IL-8 (200 μl, 10–8 M; Sigma, Poole, UK) and 20 neutrophils were counted at random per slide in four normal subjects. The diameter of each cell was measured at ×100 objective using a graticule in both the horizontal and vertical planes and the average of the two parameters was noted. Cell dimensions were measured by two independent blinded observers.
Electron microscopy
For the electron microscopy study, a buffy coat was prepared using erythrocyte sedimentation with a starch solution. Half of the buffy coat volume (2 ml) was activated with 200 μl IL-8 (10–7 M) and the remaining half was left unstimulated. These samples were then processed for transmission electron microscopy. Each of the buffy coat solutions was resuspended in 20 ml glutaraldehyde solution for four hours to fix. The cells were then washed in buffer, resuspended, and secondarily fixed in osmium tetroxide in cacodylate buffer for two hours. After a distilled water rinse, the pellet was mixed well with 2% liquid agar (50 μl) and allowed to cool and set. Finally, the samples were dehydrated through a series of methanol followed by propylene oxide, and embedded in Araldite. Semi-thin (1 μm) sections for light microscopy were stained with 1% toluidine blue in 1% borax. For electron microscopy, ultrathin (60–70 nm) sections were contrasted with uranyl acetate and lead citrate before examination under the electron microscope. The size, shape, and granularity of the neutrophils was assessed before and after stimulation.
SERUM PROTEIN ASSAYS
Stored serum was used for two assays: (1) ECP was measured using a radioimmunoassay kit (Pharmacia CAP system, Pharmacia, Uppsala, Sweden) according to the manufacturer's instructions; and (2) myeloperoxidase (MPO) was measured using an enzyme immunoassay (Bioxytech, Oxis International, Portland, Oregon, USA).
STATISTICAL ANALYSIS
Cross sectional data were analysed using non-parametric unpaired Mann-Whitney tests. For the in vitro activation data a Wilcoxon matched pairs test was used to compare groups of subjects at two and 10 minutes, both with and without stimulation. Data are expressed as median (range) and mean (SE).
Results
VALIDATION
Storage time and temperature, venepuncture technique and dilution factors, intrasubject reproducibility, sample repeatability, and gating operator were assessed. These have shown that samples can be left at 15–25°C for up to eight hours before there is distortion of results. The method of venepuncture is irrelevant and 2–4 ml are required in each EDTA tube. On repeated daily sampling of one subject over the course of seven days, and on repeatedly analysing the same sample 20 times, all parameters (neutrophil and eosinophil light scatter and absorption) were stable within 2%. The analyser was calibrated daily for neutrophil light absorption and scatter using Testpoint calibrant (Bayer, Newbury, UK)
CROSS SECTIONAL STUDY
Eosinophils
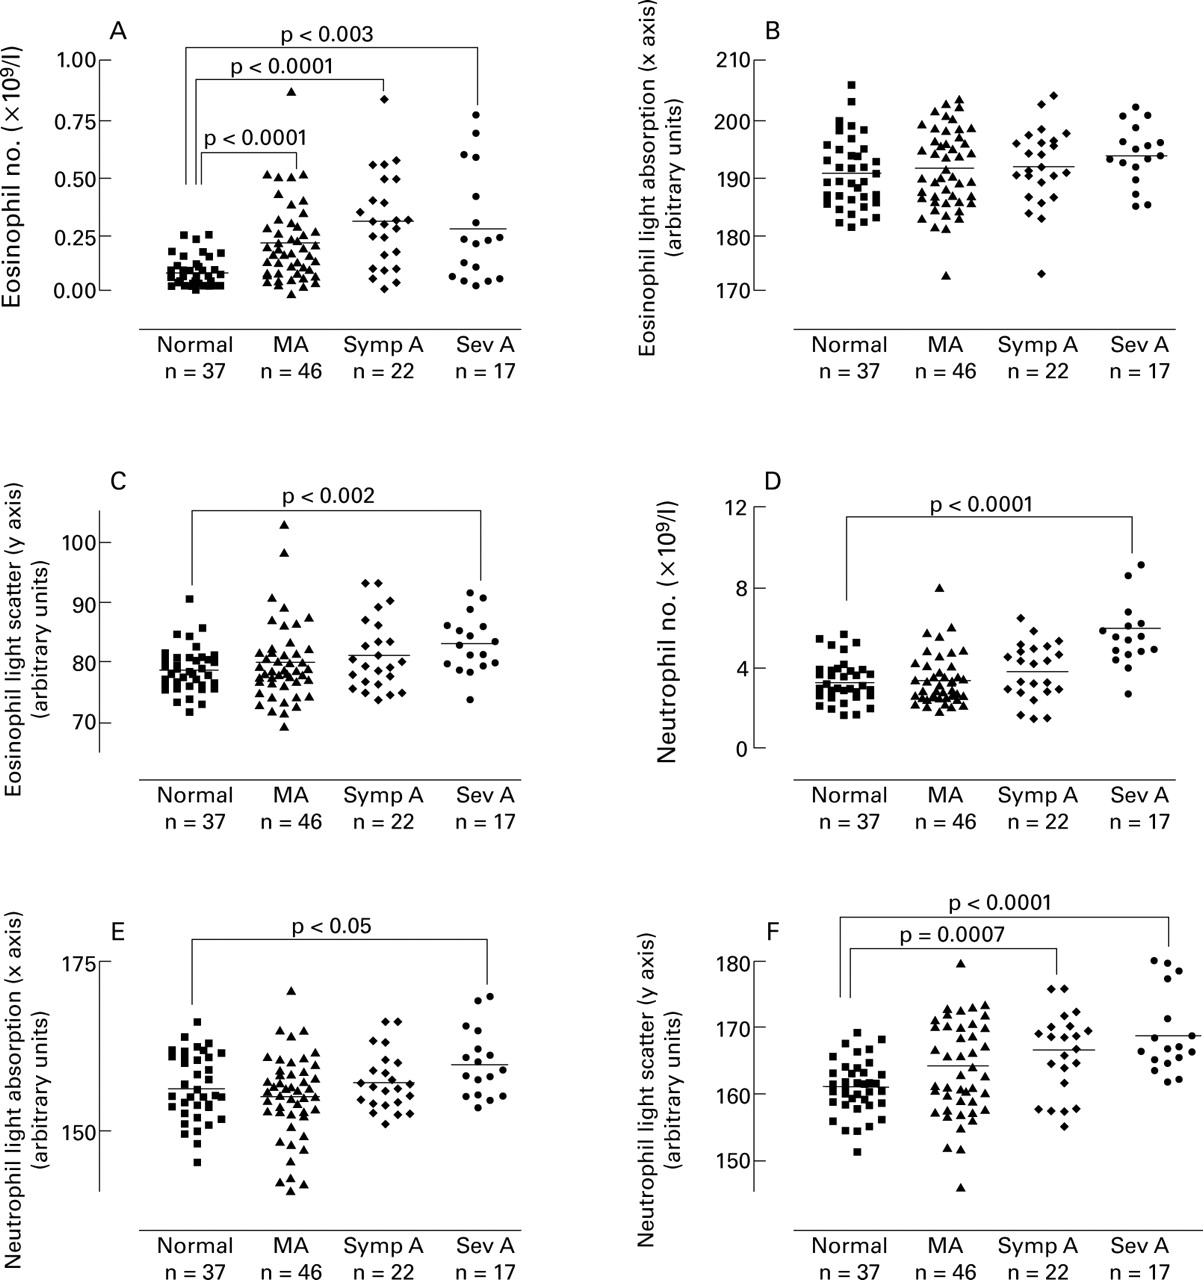
Each group of asthmatic subjects had a higher eosinophil count than the normal group, with higher values in symptomatic and more severe asthmatic subjects (0.32 (0.04) and 0.29 (0.06) × 109/l, respectively) than in normal subjects (0.1 (0.01) × 109/l) and those with mild asthma (0.23 (0.02) × 109/l); p<0.0001 for normal subjects compared with mild and symptomatic asthmatic subjects and p<0.003 for normal subjects compared with those with severe asthma. However, the eosinophilx and y axes did not vary significantly in asthmatic subjects compared with age and sex matched healthy controls, apart from in the severe asthmatic group where there was a significant increase in scatter of light by eosinophils compared with normal subjects (p<0.002; fig2).

(A) Eosinophil number, (B) light absorption, and (C) light scatter, and (D) neutrophil number, (E) light absorption, and (F) light scatter in a cross sectional study. Normal subjects = healthy non-atopic volunteers (n = 37); MA = patients on β2agonist only with few symptoms and FEV1 >70% predicted (n = 46); Symp A = patients on β2 agonist only with symptoms on a daily basis over preceding 7 days (n = 22); Sev A = patients with moderate to severe asthma, defined by symptoms and FEV1, on inhaled or oral corticosteroids (n = 17).
Neutrophils
There were significantly more neutrophils in the severe asthmatic group (5.98 (0.55) × 109/l) than in normal subjects (3.31 (0.17) × 109/l; p<0.001), and the amount of light scatter was significantly higher in the symptomatic (167.46 (1.52) × 109/l) and severe asthmatic (168.83 (1.46) × 109/l) groups than in normal subjects (160.88 (0.66) × 109/l) (p = 0.0007 and p<0.0001, respectively). The amount of neutrophil light scatter did not correlate with the neutrophil count. There was a small increase in the amount of light absorption by the neutrophils in the severe asthmatic group compared with the normal group (fig 2).
NEUTROPHIL LIGHT SCATTER
Relationship with eosinophil counts, ECP, MPO and lung function
Serum ECP levels were significantly higher in all asthmatic groups than in the normal group (normal mean (range) 4.5 (0–7.7) μg/l; mild asthma 10.6 (2.7–37.4) μg/l; symptomatic asthma 17.9 (3.1–60.3) μg/l; moderate to severe asthma 15.2 (3.0–41.6) μg/l; p<0.001 in all asthmatic groups compared with normal subjects). There was no significant correlation between neutrophil light scatter and either eosinophil number, light scatter or absorption, ECP or MPO. In addition, there was no correlation between neutrophil light scatter and FEV1.
In vitro activation
When added to whole blood in vitro, fMLP (10–6 M) caused an increase in the amount of light scatter by neutrophils within two minutes (p<0.05) which was maintained at 10 minutes (p<0.03); fig3. There was no increase in neutrophil light absorption.

Neutrophil light scatter in whole blood of six normal subjects following in vitro stimulation with fMLP. Whole blood was incubated at 37°C for 30 minutes followed by the addition of fMLP (10–6 M). Samples were then analysed using the Advia 120 analyser at 2, 5, 7 and 10 minutes. Neutrophil populations on the dot plot were gated automatically by the Advia 120 analyser. There were significant increases in the mean position on the y axis within two minutes following the addition of fMLP (p<0.05) which was maintained at 10 minutes. *p<0.03 at 10 minutes following stimulation with fMLP vs control.
Light microscopy and electron microscopy
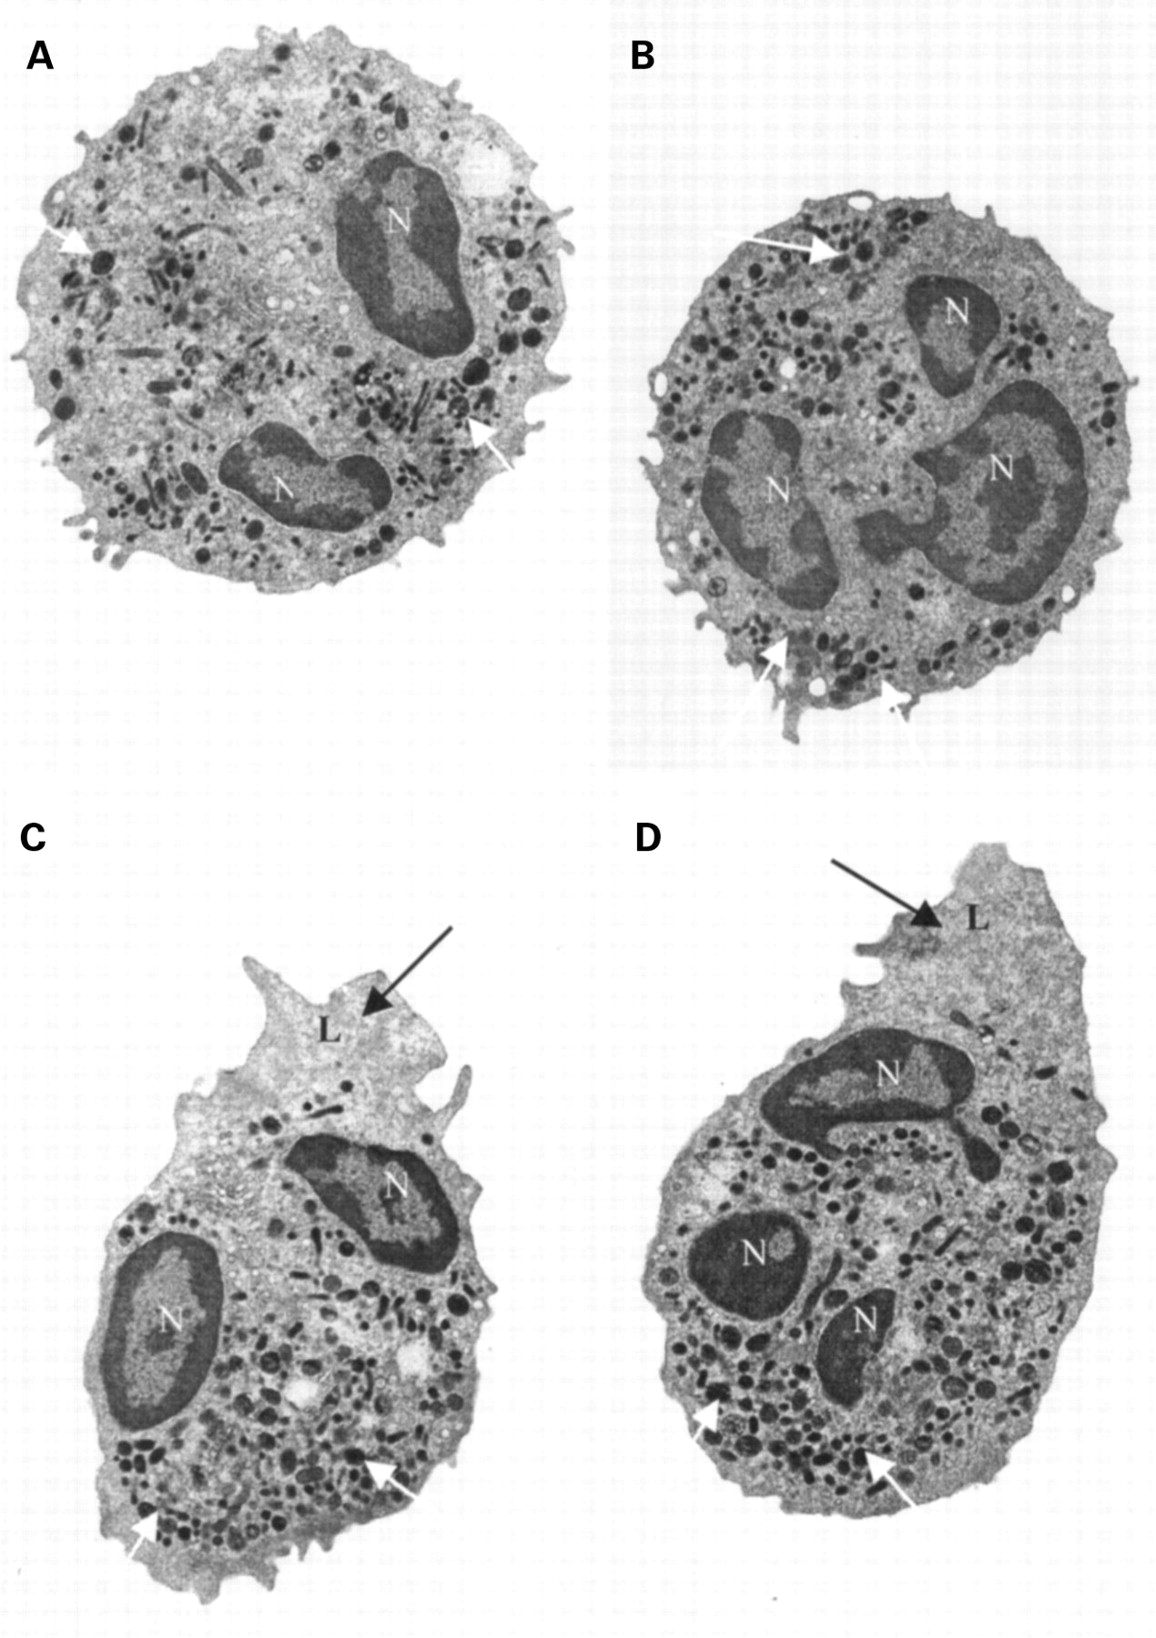
Neutrophils were significantly larger in diameter after stimulation with IL-8 (7.37 (0.41) μm) than before stimulation (6.34 (1.01) μm; p<0.0001) on the basis of light microscopy. Electron microscopy revealed that the stimulated neutrophils had changed shape and developed lamellipodia (fig 4). These changes in shape could account for the increased light scatter seen in the cross sectional study.

Transmission electron micrographs of representative neutrophils before (A and B) and after (C and D) stimulation with IL-8 (10–8 M). There is elongation of the cell and lamellipodium development. Despite the development of the lamellipodium, there were no striking differences in the granule number or density. N = nucleus; L = lamellipodium; black arrows = lack of granules in lamellipodia; white arrows = granules. Scale: 48mm = 3 μm.
Discussion
The Bayer H1 haematology analyser automatically counts leucocyte populations on the basis of their differential peroxidase staining.22 By incorporating additional software we have adapted this analyser to accurately determine both eosinophil and neutrophil position on a peroxidase dot plot. This software allows gating of stained neutrophil and eosinophil populations, and determination of the amount of absorption (plotted on thex axis) and scatter (plotted on they axis) of light produced by individual leucocytes.
In this study experiments were performed to validate the methodology, with the quantitation of neutrophil and eosinophil absorption and scatter co-ordinates being shown to be repeatable and reproducible. The method has the benefits of using whole blood, it is rapid, and does not require sample processing. Furthermore, neutrophil and eosinophil assays can be performed on blood stored at room temperature for up to eight hours, and do not depend on the venepuncture method or amount of blood drawn into the EDTA tube.
Eosinophil and neutrophil activity measured as a function of absorption and scatter of light was assessed in asthma because of the considerable evidence for eosinophil activation in this disease. However, in a cross sectional analysis of different groups of asthmatic patients, despite increases in the number of blood eosinophils, there were no significant differences in either the absorption or scatter of light by eosinophils. Surprisingly, significant increases were seen in the amount of scatter of light by neutrophils in mild asthmatics with daily symptoms, and also in moderate to severe asthmatics treated with inhaled and/or oral corticosteroids.
The interpretation of the increase in light scatter by neutrophils in the peroxidase dot plot was investigated by in vitro experiments. Whole blood was incubated with the bacterial peptide stimulant fMLP. This stimulant caused an increase in the amount of light scatter by blood neutrophils of a magnitude similar to that seen in the cross sectional study. This lends support to the hypothesis that increased neutrophil light scatter is attributable to neutrophil activation.
Having found an increase in the neutrophil yaxis both in subjects with symptomatic asthma and following neutrophil stimulation in vitro, we studied the activated neutrophils by microscopic examination to assess their size and morphology. Following stimulation of blood granulocytes with the neutrophil chemoattractant, IL-8, it was demonstrated by light microscopy that the neutrophils were enlarged. Furthermore, on electron microscopy it was convincingly shown that there are significant shape changes in stimulated neutrophils, with the majority of neutrophils developing lamellipodia, but without identifiable changes in granule number or morphology.
Flow cytometry has been used as a method to measure shape changes in isolated eosinophils and neutrophils after stimulation with various stimulants including eotaxin, fMLP, IL-8 and leukotriene B4.23-25 In the presence of changes in cell shape, granulocytes have been shown to have an activated respiratory burst26 and upregulation of markers of activation such as CD11b. In addition, following stimulation with fMLP, CD11b expression in peripheral blood granulocytes from patients with moderate to severe asthma correlated with airway hyperresponsiveness.27
As a result of neutrophil activation in asthma, it is possible that there will also be raised levels of neutrophil granule proteins in serum or plasma. In a study on asthmatic patients it was noted that plasma lactoferrin levels were raised, although MPO levels remained normal.28 In our study serum MPO levels were similar in the normal group and in the various groups of asthmatic subjects in the cross sectional study, suggesting that degranulation of neutrophils does not occur in whole blood from patients with asthma. Furthermore, degranulation is unlikely to have taken place after venepuncture since this is a calcium-dependent phenomenon.22
A chemokine such as IL-8 may cause the observed neutrophil activation in asthma. Levels of IL-8 are known to be higher in BAL fluid from asthmatic subjects than in normal subjects29 and IL-8 is detected in the serum and bronchial tissue of patients with severe atopic asthma, but not mild atopic asthma.30 It may be that circulating IL-8 causes peripheral activation of neutrophils, increasing their ability to marginate and adhere in the pulmonary microvasculature prior to migration into the bronchial wall and sputum. The neutrophil is primarily a short lived blood borne cell and it is possible that large numbers of neutrophils enter the bronchial tissue, with rapid death being reflected in relatively low numbers being seen on microscopy. Indeed, eosinophil activation may be the predominant event early in the natural history of asthma, with a greater role for neutrophils in more chronic and severe disease.10
In order to monitor inflammation in asthma, measurement of blood eosinophils and serum ECP levels has been performed. Assay of serum ECP has the drawback of requiring clotting under carefully controlled conditions, since during clotting ECP is released to an increased extent by activated eosinophils. In the present study ECP levels were increased in both the symptomatic and moderate to severe asthma patients, and the ECP levels correlated with the eosinophil count. However, neutrophil activation was not related to peripheral blood eosinophilia and raised ECP levels. In addition, we did not demonstrate eosinophil activation in terms of the peroxidase dot plot. This may be consistent with activated eosinophils being present mainly in the airways, since the activation process may occur in bronchial tissue. This could reflect the eosinophil being mainly a tissue cell, causing damage through its cytoplasmic granules and inflammatory mediators within the airway. Because of the highly toxic nature of the eosinophil granule proteins, excessive eosinophil activation in the circulation could be harmful. In addition, our assay is a measure of cell shape rather than granule protein release, and this may account for the discrepancy between our findings and those of others measuring activation in terms of release of granule proteins. Activated eosinophils marginate at the endothelium prior to migration through the tissues. Peripheral blood sampling would not allow assessment of eosinophils which have marginated. The lack of correlation between neutrophil shape changes and eosinophil activation markers suggests that neutrophilic and eosinophilic inflammation occur independently, implying different roles in pathogenesis and therapeutic targets in asthma.
The Bayer automated analyser also quantitates the MPXI, a parameter that has been used as a measure of neutrophil activation in several disease states.15 ,16 However, it is a reflection only of the neutrophil population in terms of the position on thex axis and does not quantitate they axis. In this study we found no significant differences in MPXI in any of the groups of asthmatic patients, nor in the in vitro activation experiment. In contrast, our method allows determination of both the xand y parameters to provide an indication of size/shape (y axis) and granularity (x axis) of both eosinophils and neutrophils.
There are several advantages of using this technique to measure neutrophil activation. It is less laborious than other methods of determining granulocyte activation, including measurement of granule proteins, surface markers, and superoxide generation. It may be adapted to analyse rodent and monkey blood and can be used as a screening method for drug development. The technique can also be used with small volumes of blood (>200 μl) which would be particularly useful in the context of clinical paediatrics. Although the changes described in this study are small, the technique may be of use in monitoring asthma and in identifying subgroups with neutrophilic inflammation, and further studies are ongoing to assess this.
We have described an automated method of measuring blood neutrophil and eosinophil activation. The Bayer H1 and Advia 120 analysers routinely count large numbers of leucocytes per sample, and provide a simple and reliable method of monitoring activation of granulocytes within minutes. We have shown clear evidence of neutrophilic activation in the peripheral blood of mild but symptomatic asthmatics, which is a novel finding and has implications for the role of neutrophils in the pathophysiology of asthma. Further studies are required to determine the usefulness of this technique in monitoring inflammation in asthma, and also the application of quantitation of neutrophil and eosinophil activation in other inflammatory diseases.