Article Text

Abstract
BACKGROUND The relationship between current concentrations of ambient air pollution and adverse health effects is controversial. We report a meteorological index of air stagnation that is associated with daily visits to the emergency department for asthma in two urban areas.
METHODS Data on daily values of a stagnation persistence index and visits to the emergency department for asthma were collected for approximately two years in Spokane, Washington, USA and for 15 months in Seattle, Washington, USA. The stagnation persistence index represents the number of hours during the 24 hour day when surface wind speeds are less than the annual hourly median value, an index readily available for most urban areas. Associations between the daily stagnation persistence index and daily emergency department visits for asthma were tested using a generalised additive Poisson regression model. A factor analysis of particulate matter (PM2.5) composition was performed to identify the pollutants associated with increased asthma visits.
RESULTS The relative rate of the association between a visit to the emergency department for asthma and the stagnation persistence index was 1. 12 (95% CI 1.05 to 1.19) in Spokane and 1.21 (95% CI 1.09 to 1.35) in Seattle for an increase of 11 and 10 hours, respectively, of low wind speed in a given day. The stagnation persistence index was only correlated with one set of factor loadings; that cluster included the stagnation persistence index, carbon monoxide, and organic/elemental carbon.
CONCLUSION Increased air stagnation was shown to be a surrogate for accumulation of the products of incomplete combustion, including carbon monoxide and fine particulate levels of organic and elemental carbon, and was more strongly associated with asthma aggravation than any one of the measured pollutants.
- asthma
- air stagnation
- wind speed
- air pollution
Statistics from Altmetric.com
Previous studies have shown that certain meteorological conditions are useful for identifying sources of particulate matter which are responsible for outbreaks of asthma.1 ,2 Point sources of particulate matter from grain3 and soybean dusts4 ,5 have been identified as being responsible for asthma outbreaks. These studies demonstrate the usefulness of combining meteorology with a knowledge of specific air pollution point sources.
Other studies have combined meteorology with chemical composition of particulate matter. For instance, factor analysis with a varimax rotation of the particulate matter composition collected from 1957 to 1961 from 30 cities across the USA found seven factors representing heavy industry or steel production, internal combustion engines, coal combustion, possible gas production, a zinc-tin factor, plating, and copper.6 Gatz7 included meteorological variables (mean wind speed, maximum wind speed, ventilation rate, wind direction, rain) along with the composition of particulate matter in a factor analysis to help identify sources. In that study wind direction was the only meteorological variable that was correlated with particulate matter concentration. Thurston and Spengler8used factor analysis with a varimax rotation separately on particulate matter composition and meteorological parameters. The sources representing the motor vehicle factor (lead, bromine) were significantly correlated with the meteorological component representing poor dispersion. Lewis and coworkers9 used carbon monoxide in place of lead as a tracer of motor vehicles in a study of particulate matter composition in Denver. They found a high correlation between carbon monoxide and lead (R 2 = 0.91). Similar motor vehicle apportionment results were seen when either carbon monoxide or lead were used in a multiple linear regression receptor model.10
Recent studies have focused on the association between general levels of air pollution in urban areas and visits to the emergency department for asthma. A number of studies have found a significant association between increased levels of particulate matter (PM) and increased visits to the emergency department for asthma.11-15 The identity of the specific components of PM responsible for the observed association remains unclear. In the present study we have used our ability to quantify the relevant meteorology associated with increased pollution events to identify more specifically those air pollutants associated with emergency department visits for asthma in Spokane and Seattle, Washington, USA.
Methods
SPOKANE
The study was conducted in Spokane, Washington, a city located in a river valley in an arid agricultural region. According to a 1990 census the population of the study area including the city of Spokane and surrounding areas is 300 000. In Spokane the major sources of particulate matter are varied and include wood burning, grass field burning, automobiles, heavy duty diesel vehicles, resuspended road dust, and dust storms from nearby arid regions of central Washington.
Measurements of atmospheric pollutants and meteorological variables were obtained from an ongoing Spokane PM health effects study, Washington State Department of Ecology, and the National Climatic Data Center. A preliminary examination of the meteorology indicated that an increased occurrence of low wind speeds was associated with increases in the concentrations of combustion related pollutants. To quantify this association we used a simple variable named the “stagnation persistence index”16 defined as the number of hours in the 24 hour day in which the wind speed is less than the 50th percentile of the hourly wind speed at that location. The 50th percentile was chosen to provide sufficient variation in this index to span the entire observed range of values between 0 and 23. We averaged this index over three sites. The stagnation persistence index may reflect relative changes in urban pollution exposure levels better than traditional air pollutant measures at a given site because meteorology is a more regional variable. The correlation between the daily stagnation persistence index at any one site and the daily average value for all sites in the urban area was high (R varied between 0.90 and 0.94 for three Spokane sites).
Data on emergency department visits for asthma were obtained from four participating hospitals in Spokane. Approval for the use of anonymous hospital data for both cities was given by the University of Washington Human Subjects Office and the participating hospitals. The association between daily emergency department visits for asthma and the stagnation persistence index were examined.
SEATTLE
The results found in Spokane were then tested for comparison on data collected in previous research in Seattle, a coastal city located on Puget Sound. The population of the Seattle study area contributing cases to the emergency department data was approximately one million. In Seattle the major sources of particulate matter are wood burning, automobiles, heavy duty diesel vehicles, and resuspended road dust, but not grass field burning or dust storms. The Seattle study used data collected from September 1995 to December 1996 and was confined to asthma cases below the age of 18 years. Meteorological and air pollution data for Seattle were obtained from the Puget Sound Air Pollution Control Agency (now Puget Sound Clean Air Agency), Washington State Department of Ecology, and the National Climatic Data Center. Wind speed was averaged over four sites and emergency department visits for asthma were obtained from six participating hospitals. Data for factor analysis were available from a previous study conducted between July 1993 and June 1994 in Seattle.
STATISTICS
The daily emergency department visits for asthma were regressed on predictor and confounding variables using a semi-parametric Poisson regression model. As the daily emergency department asthma visits are count data and are also rare events, it is reasonable to assume (conditional on the covariates) that the counts have a Poisson distribution. The effect of air pollution on the increased number of visits to the emergency department for asthma is small and confounders such as season either obscure or inflate the small effect estimates. In order to evaluate the association between emergency department visits for asthma and air pollution, base models were created to control for potential systematic effects such as day of week, and confounding by seasonal trends, temperature, and dew point temperature. Separate base models were created for Spokane (subjects <65 years of age) and Seattle (subjects <18 years of age). Base models were constructed to adjust for potential confounding factors using day of week indicator variables, smooth functions for time trends, temperature, and dew point temperature (on previous day11). We chose a one day lag in both temperature and dew point temperature because they had the best combined fit. Using either a zero or one day lag in both of these variables did not affect the results. The degrees of freedom for the smoothing splines17 for temperature and dew point temperature were selected based on minimising the degrees of freedom adjusted deviance or Akaike Information Criteria (AIC).18AIC was used to help determine the appropriate degrees of freedom for a smooth function where the smallest AIC is desired.19 The AIC worked well with the temperature and dew point temperature smoothing splines in these analyses, but tended to overfit the time trends which caused autocorrelation in the residuals. The degrees of freedom (df) for the time trends were selected to reduce the autocorrelation in the residuals. The Spokane base model used a smoothing spline of 32 df to adjust for time trends for the 27 month data set. The temperature and dew point temperature smoothing splines had a minimum AIC at 3 and 4 df, respectively. The Seattle base model used a smoothing spline with 5 df to adjust for time trends and the temperature and dew point temperature had a minimum AIC at 3 and 2 df, respectively. The difference in the degrees of freedom for time trends for the Spokane and Seattle data is caused by differences in the number of seasons which the analyses covered and the lower seasonal variability in the Seattle data set.
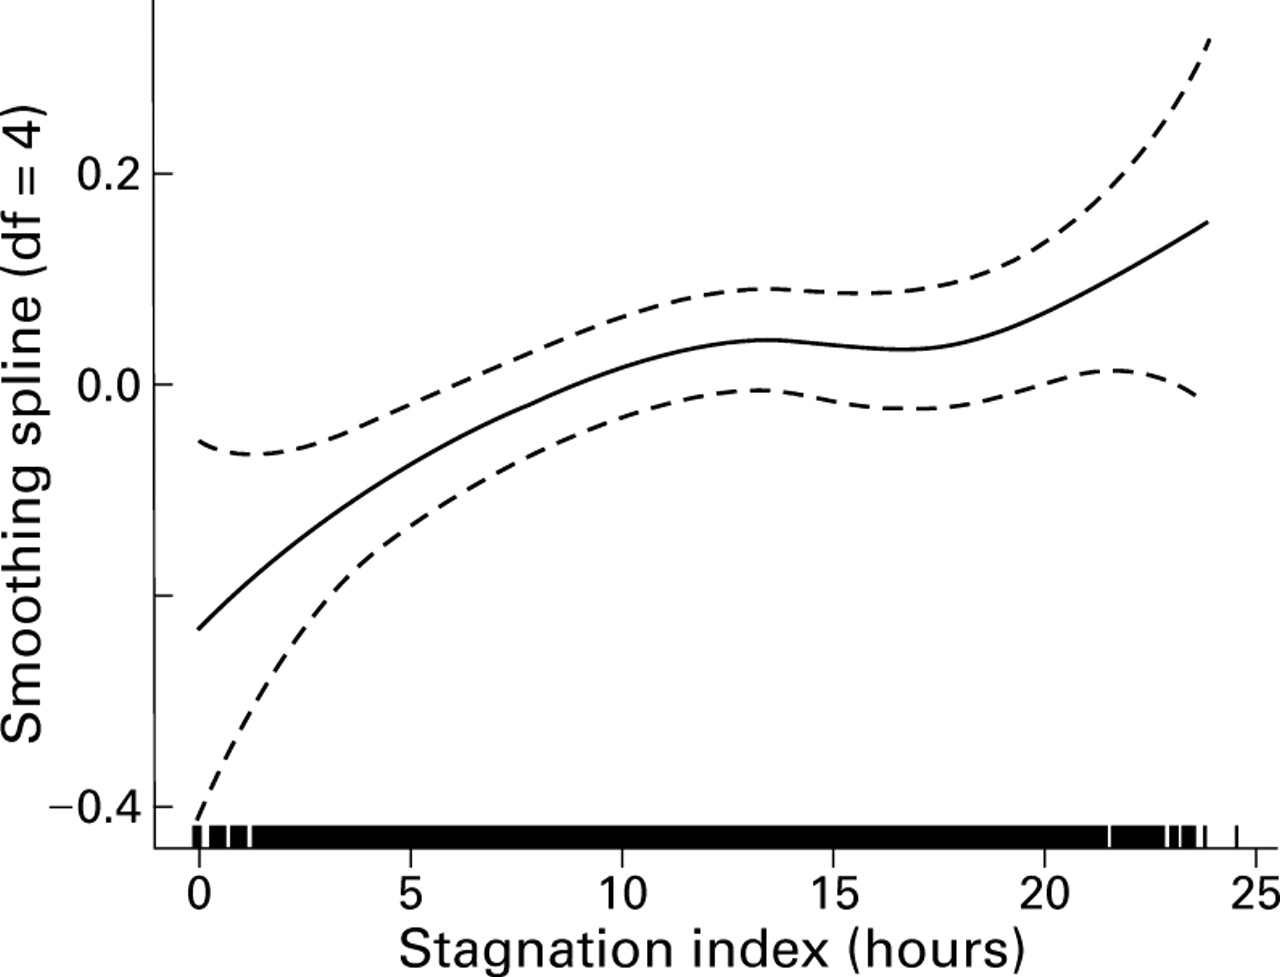
After the base models were created, the air pollution exposure variables were evaluated by adding them individually into the model. Models were also evaluated which had multiple exposure variables. Final models were adjusted for overdispersion or for the variance exceeding the mean. The Spokane and Seattle residuals had overdispersion parameters of 1.08 and 1.12, respectively. In addition, the assumption of a linear dose-response relationship was evaluated using a smooth function. Linearity was assumed if a straight line could be fit within the 95% confidence limits of the smooth function (see, for example, the linear effect of stagnation shown in fig 1). All analyses were conducted with the S-plus statistical package20 using a generalised additive model.
Smooth function of the stagnation index regressed on visits to the emergency department for asthma by non-elderly subjects after adjustment for day of week, time trends, temperature, and dew point temperature. (The ordinate is the contribution to the additive predictor in units of (loge(visits/day)).
Results
Table 1 shows the distribution of the variables used in the analysis and table 2 summarises the pairwise correlation coefficients for the measured pollutant variables (including stagnation) in both Spokane and Seattle. Table 3 summarises the major features of the atmospheric variability common to both cities as quantified by factor analysis: (1) products of incomplete combustion including fine particulate elemental carbon (EC), organic carbon (OC), and gaseous carbon monoxide (CO); (2) soil derived components; and (3) fine particle sulphate and ammonium compounds. The factor loadings were also examined as a function of wind direction. There is no obvious variation in the combustion-stagnation factor with wind direction.
Distribution of health outcomes and selected atmospheric variables
Pearson correlations among pollutant variables in Spokane2-159 and Seattle, and among PM10, SO2 and O3 in Spokane
Factor loadings from 24 hour averages
The stagnation persistence index was positively associated with increased numbers of visits to the emergency department for asthma in both single and multi-pollutant models (tables 4 and 5). These models were evaluated to determine if the relative rate of emergency department visits per increment of stagnation persistence index decreased with the addition of the traditional air pollutant measures. An interquartile increase in the exposure variable was used in the calculation of the relative rate to allow for a comparison of the different exposure measures in the same air shed. The multi-pollutant models used exposure variables that are moderately correlated (shown in table 2). The use of correlated exposure variables complicates the interpretation of the relative rate, but the multi-pollutant models show the robustness of the stagnation persistence index. No statistically significant associations were found between the stagnation persistence index and a control diagnosis (gastroenteritis). An analysis by season was performed and the association between asthma and the stagnation persistence index was found to be strongest in the spring and autumn.
Association between exposure variables and emergency department asthma visits for Spokane
Association between exposure variables and emergency department asthma visits for Seattle5-159
Several different adjustments for temperature and dew point temperature were evaluated to determine whether the meteorological adjustments were causing the association between the stagnation persistence index and emergency department visits for asthma but no effect was found.
The stagnation persistence index and the maximum one hour daily sulphur dioxide concentration were associated with emergency department visits for asthma by non-elderly subjects in Spokane (table 4). When the traditional pollutant measures were combined one at a time with the stagnation persistence index in various two-pollutant models (table 4) this index remained significant while PM10, carbon monoxide, and sulphur dioxide were not significant.
In Seattle the stagnation persistence index, PM10, and carbon monoxide were significantly associated with visits by adolescents to the emergency department for asthma (table 5). The stagnation persistence index remained significant in various two-pollutant models (table 5) while carbon monoxide, PM10, and sulphur dioxide were not significant.
Discussion
The stagnation persistence index used in this study was strongly associated with emergency department visits for asthma in two cities. We do not suggest that low wind speed per se is a trigger for asthma aggravation. However, based on the factor analysis, we suggest that the associated build up of airborne irritants under increasingly stagnant air is a logical trigger. Our results show that the products of incomplete combustion are the air pollutants associated with increases in emergency department visits for asthma. Our study also shows similar associations between the stagnation persistence index and emergency department visits for asthma in two dissimilar cities, one in a semi-arid region and one in a coastal area. Exactly which combustion related pollutants are responsible would be difficult to discern from these data, given that the associated meteorology is a strong predictor of asthma aggravation. It could be that the triggering agent or agents were not even measured in this study—for example, combustion derived organic vapours or aeroallergens—but are strongly correlated with the occurrence of stagnant air and the measured concentrations of combustion products. However, based on our factor analysis, it is also clear that the two other independent chemical features—soil-derived particles and sulphate compounds—are not driving the observed association.
The relative strength of the association with the stagnation persistence index may result in part from the high degree of spatial correlation of this index across the urban area, implying a better predictor of increased air pollution exposure to the urban population as a whole. This categorical index is precisely measured and also has an upper limit (all hours of the 24 hour day have wind speeds lower than the 50% annual value). In the worst case a stagnant day with an average of 24 hours for the stagnation persistence index predicts an increase in visits to the emergency department for asthma of 28% and 63% for Spokane and Seattle, respectively. This implies that a consecutive multi-day index also needs to be explored in this regard. However, the high correlation between the stagnation persistence index and the air pollutant measures in our study areas (including carbon monoxide, organic carbon, and elemental carbon) complicates the interpretation of this index in a multi-pollutant model of health outcomes.
Pope and Kalkstein1 used synoptic weather categories to control for meteorological confounders and produced a small, non-significant change in the association between PM10 and mortality relative to a model that did not include these weather categories. In contrast, our stagnation persistence index is highly correlated with certain air pollutant levels and, because of its uniformity over the urban area, is a useful urban air pollution index. However, it should not be used alone as a predictor of health effects. We use it as part of a set of multivariate exposure parameters that include both pollutant levels and meteorological factors. Using the stagnation persistence index as part of a multivariate parameter allows us to acknowledge the correlation between meteorology and pollution level and to interpret the association between stagnation and asthma. In this case, the multivariate feature that is highly correlated with the stagnation persistence index is a combustion related feature. The fact that stagnation was correlated with only one of the three observed multivariate features is also important. Had it been correlated with two or more features, it would have been more difficult to interpret the source mix associated with the observed effect.
Interestingly, mean daily wind speed is not a good predictor of the levels of any air pollutants in Spokane so we did not include mean daily wind speed in our final models. Our stagnation persistence index is a surrogate measure of air pollution and therefore lacks chemical specificity (and is therefore also difficult to link to prevention measures). However, use of this index in conjunction with air pollution measurements allows us to define and interpret multivariate exposure features that are specifically related to certain source categories—for example, ground level sources of combustion.
A major limitation to the use of a stagnation persistence index in the epidemiology of air pollution is that it does not identify specific pollutants. This limitation is balanced somewhat by the fact that the index is readily available in all major urban areas. It would be interesting to know whether the stagnation persistence index in other cities is also associated with emergency department visits for asthma. Although most urban areas in the USA have routine air pollution monitoring at a minimum of one site, all urban areas have a number of routine wind speed monitors with a large historical record. If associations with health outcomes are discovered in a given urban area, special studies of limited duration could be conducted to identify the associations of this index with specific chemical components of the complex air pollution mixture. The stagnation persistence index, along with particulate composition data, points to components of combustion derived air pollution as sources exacerbating asthma. It is likely that the stagnation persistence index is a surrogate for a complex mixture (pollutant cocktail) of combustion derived pollutants. On the other hand, it is possible that stagnation is a surrogate for an unmeasured and unidentified pollutant that functions as a trigger for asthma aggravation.
Acknowledgments
This research was funded by the Washington State Department of Ecology, the US Environmental Protection Agency, the American Lung Association of Washington, and the EPA Northwest Center for Particulate Matter and Health. The results discussed here do not necessarily reflect the policies of these agencies. The authors thank Wendy Sullivan for assistance with data analysis and Natalie Young Pong for asthma ED data from Seattle.