Article Text

Abstract
BACKGROUND Several studies have linked air pollution by nitrogen dioxide (NO2) with increased hospital admissions for asthma in children. Exacerbations of asthma in children are often precipitated by upper respiratory infections. It is therefore possible that NO2increases the risk of airways obstruction when asthmatic children develop upper respiratory infections.
METHODS To test this hypothesis a sample of 114 asthmatic children aged 7–12 years were followed for a total of up to 13 months. Probable upper respiratory infections were identified by consensus review of daily symptom diaries, and episodes of airways obstruction from serial records of peak expiratory flow (PEF). Personal exposures to NO2 were measured with Palmes tubes that were changed weekly. Generalised estimating equations were used to assess the relative risk (RR) of an asthmatic exacerbation starting within seven days of an upper respiratory infection according to estimated NO2 exposure during the one week period from two days before to four days after the onset of the infection.
RESULTS The children were followed for an average of 34 weeks during which 318 upper respiratory infections and 224 episodes of reduced PEF were diagnosed. PEF episodes were much more likely to occur in the seven days following the onset of an upper respiratory infection than at other times. Estimated exposures to NO2 at the time of infections were generally low (geometric mean 10.6 μg/m3). Compared with exposures of ⩽8 μg/m3, exposures of >28 μg/m3 were associated with a RR of 1.9 (95% confidence interval 1.1 to 3.4) for the development of an asthmatic episode within seven days of an infection.
CONCLUSIONS The findings give some support to the hypothesis that NO2increases the risk of asthmatic exacerbations following respiratory infections, even at relatively low levels of exposure. Further studies in populations with higher exposures would be useful.
- asthma
- children
- nitrogen dioxide
- respiratory infections
Statistics from Altmetric.com
Nitrogen dioxide (NO2) occurs as an air pollutant both outdoors and inside buildings. The main source in outdoor air is motor vehicle exhaust, while indoors its presence is attributable partly to ingress of air from outside and partly to indoor sources such as gas burning appliances, paraffin heaters, and environmental tobacco smoke. Several studies have suggested that exposure to NO2is associated with an increased incidence of respiratory illness in children.1-7 Although the finding has not been entirely consistent,8-11 and any excess risk has generally been small, it is possible that children with pre-existing asthma are more vulnerable. In Los Angeles a positive temporal correlation has been observed between outdoor NO2 concentrations and emergency room attendances and hospital admissions for asthma by children,12 and in the Netherlands higher levels of outdoor NO2 have been associated with an increased prevalence of lower respiratory symptoms among school children with bronchial hyperresponsiveness and a serum total IgE level of more than 60 kU/l.13 A Canadian case-control study also found a dose response relationship between personal exposure to NO2and the incidence of asthma in preschool children.14
Episodes of airflow obstruction in asthmatic children are often precipitated by viral infections of the upper respiratory tract.15 Thus, one way in which exposure to NO2 might aggravate asthma is by increasing the chance of an asthmatic episode when an upper respiratory infection occurs. To test this hypothesis we carried out a panel study of asthmatic children.
Methods
The study sample comprised 63 boys and 51 girls aged 7–12 years (mean 10.1 years) whom we identified from asthma registers kept by general practitioners in the Southampton area. All of the children came from non-smoking households, and in the year before recruitment all had suffered from wheezing or from coughing in the absence of obvious respiratory infection. Further details of their symptoms and treatment at baseline are given in table 1.
Characteristics of participating children at entry to the study
After an initial training period each child was asked to maintain a daily record of upper respiratory symptoms and also of his or her peak expiratory flow (PEF) in the morning on waking and before use of any medication. The symptom diary was similar to that used in two earlier studies.15 ,16 A score (0 = absent, 1 = mild, 2 = moderate, 3 = severe) was assigned to each of six symptoms (runny nose or sneezing; blocked or stuffy nose; sore throat or hoarse voice; fever; headaches; aches and pains elsewhere) and the values were summarised to give an aggregate symptom score. PEF measurements were made with a mini-Wright peak flow meter (Clement Clarke International, London, UK) and recorded as the best of three successive readings. The children remained under study for a total of up to 13 months, broken by a two month intermission during the summer holiday. Throughout the follow up period they attended a clinic every four weeks, at which symptom and PEF diaries were collected.
The records were entered into a computer and graphs of symptom scores and PEF measurements over the study period were plotted as a time series for each child. These were examined independently by two clinicians (JC and LJ) with experience in asthma research, who marked the start and finish of possible upper respiratory infections and asthmatic episodes. The examination of symptom records was carried out without access to PEF measurements and vice versa. An upper respiratory or PEF episode was deemed to have been present on days on which both clinicians had indicated the diagnosis.
As well as recording information about their health, subjects were supplied with Palmes diffusion tubes for the measurement of personal exposures to NO2.17 The tubes were fitted with a badge pin so that they could be clipped to the child's outer clothing during the day. At night they were placed in the child's bedroom. Instructions were given orally and in a booklet about how to wear the tubes, and how to prevent them becoming wet or dirty. The tubes were issued and collected in sets of four when the child came to the clinic. The family were asked to change the tube every week, and to keep a record of when each tube was uncapped and recapped. When not being worn, the tubes were stored in a refrigerator. When used tubes were returned to the clinic they were inspected for evidence that they had been worn. Those with no bending of the badge pin or fading or scratching of the label were discarded at this stage. The remainder were stored at 4°C before being sent in batches for analysis.
The tubes were supplied and analysed by Greater Manchester Scientific Services (GMSS), a laboratory registered with UK Accreditation Service and participating in an ongoing programme of NO2 quality control trials. Analysis was by a colorimetric method and levels were corrected for values recorded in unexposed blank tubes. The mean NO2 exposure during the time that a tube was uncapped was calculated from its NO2 content and the duration of exposure.
Statistical analysis was carried out with the Stata package (Release 6.0; Stata Corporation, Texas, USA) and focused on the risk of asthmatic exacerbations associated with episodes of upper respiratory symptoms indicative of probable infections. Generalised estimating equations were used to allow for the repeated observations within children and the model used a logarithmic link and a binomial error structure. Relative risks were calculated according to personal exposures to NO2 during the seven day period starting two days before the onset of an upper respiratory episode. The exposure was estimated as a weighted average of the two one-week exposure measurements that overlapped this seven day period. The exposures were partitioned into four categories with divisions approximately at the 33rd, 67th, and 90th centiles of the distribution of exposures around the onset of upper respiratory episodes.
Results
The 114 children who took part in the study were each followed for at least 16 weeks. During the follow up period all but two participants recorded symptom scores on at least 70% of days, and all but six provided morning PEF measurements that were at least 70% complete. The mean number of days on which symptom scores and PEF measurements were recorded was 240 (range 24–345). Where symptom scores or PEF measurements were missing it was usually only for an isolated day, but occasionally longer gaps occurred.
The two clinicians agreed well in their assessment of upper respiratory and PEF episodes from the daily records. Thus, 300 (93%) of the upper respiratory episodes and 216 (94%) of the PEF episodes diagnosed by one clinician overlapped at least one corresponding episode diagnosed by the other. Furthermore, when diagnosed episodes overlapped in this way, there was exact agreement on the date of onset for 261 (82%) of the upper respiratory episodes and 150 (67%) of the PEF episodes. For a further 31 (41%) PEF episodes the agreement was to within two days.
With episodes defined as being present on days for which both clinicians indicated the diagnosis, there were a total of 318 upper respiratory episodes and 224 PEF episodes over the course of the study. However, eight upper respiratory episodes and four PEF episodes were excluded from further analysis because they were present on the first day of follow up and it was unclear when they had started. Table 2summarises the distribution of the remaining episodes by frequency and duration. On three occasions an upper respiratory episode began within seven days of the start of an earlier episode, but PEF episodes were more widely separated in their onset.
Frequency and duration of upper respiratory and PEF episodes
Figure 1 shows the incidence of upper respiratory and PEF episodes, averaged across all children, for each month of the study. Upper respiratory episodes tended to be most common in the autumn, while the highest rates of PEF episodes were recorded in December.
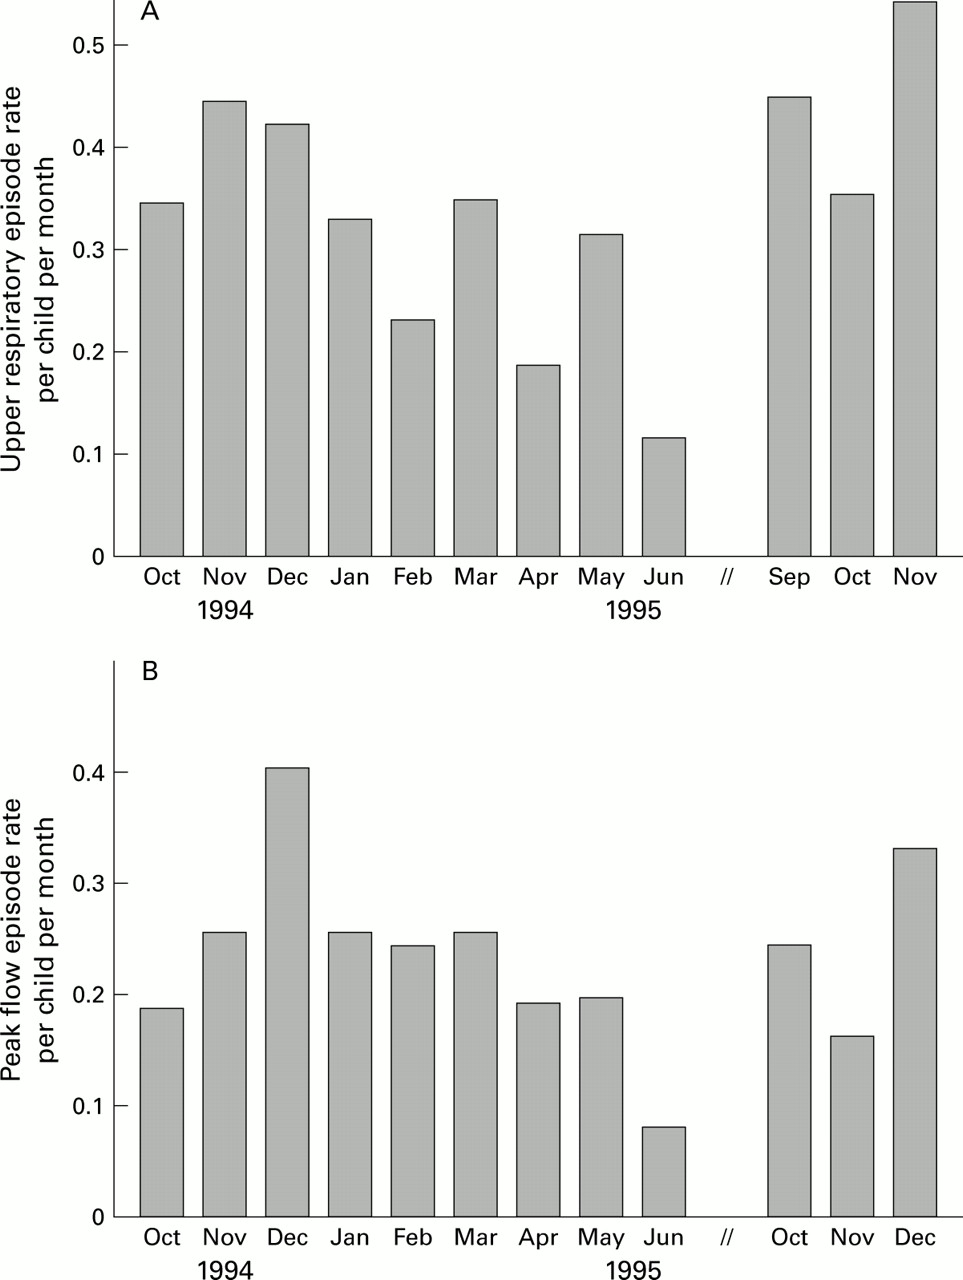
Monthly episodes of (A) upper respiratory episodes and (B) PEF episodes over the study period.
Table 3 shows the numbers of PEF episodes starting within 14 days of the onset of an upper respiratory episode. If the two events were unrelated, an average of approximately 2.5 new PEF episodes would have been expected on each day. The observed numbers were clearly in excess of this, particularly on the day that an upper respiratory episode began, but also over the next six days.
Peak flow episodes starting within 14 days of the onset of an upper respiratory episode
Upper respiratory episodes were excluded from further analysis if information on NO2 exposure was missing for four or more days in the critical period from two days before to four days after the onset of the episode. This led to the loss of 37 episodes. During the critical periods around the start of the remaining 273 episodes, estimated personal exposures to NO2 ranged from 1.4 to 93.7 μg/m3 with a geometric mean of 10.6 μg/m3. Table 4 shows the risk of a PEF episode starting within seven days of an upper respiratory episode according to estimated NO2 exposure during the critical period. Risk was significantly increased in the highest exposure category (relative risk (RR) 1.9, 95% confidence interval (CI) 1.1 to 3.4). When this analysis was repeated with adjustment for season (October–March versus April–September) and use of anti-inflammatory medication, the risk estimates were similar but their statistical significance reduced.
Risk of a PEF episode starting within seven days of an upper respiratory tract infection according to personal exposure to NO2
Discussion
This study gives some support to the hypothesis that exposure to NO2 increases the risk that asthma in children will be exacerbated following upper respiratory infections, even at relatively low levels of exposure. The observed association did not appear to be explained by a confounding effect of season or use of anti-inflammatory medication.
In a longitudinal study such as this there is no completely satisfactory method for the identification of upper respiratory infections. Like several other investigators we based our case definition on symptoms recorded in a diary.15 ,18 We did also ask the families of participants to report any suspected coughs or colds to the study team as soon as possible after they developed and, where this was done, a member of the study team visited the child and collected a nasal aspirate that was screened for viruses by a polymerase chain reaction method. The results of this screening will be reported separately, but because symptoms suggestive of infections were not always reported, and not all viruses were covered by the testing, it cannot provide complete ascertainment of all upper respiratory infections that occurred during follow up.
Various algorithms have been used previously to define infectious episodes from patterns of symptoms recorded in diaries, but we found this approach unsatisfactory. Instead, therefore, we diagnosed upper respiratory infections through consensus between two clinicians who examined each child's records independently. We also used a similar method to classify episodes of reduced PEF. Originally our intention had been to employ an algorithm for this purpose, as in an earlier study.16 ,18 However, this proved unsatisfactory. One problem was the need to allow for variable patterns of missing data, and another was the duration of the study (up to 13 months) which made it difficult to define a satisfactory mean PEF to use as a baseline against which to assess fluctuations. Over this period some of the children grew significantly, a factor not taken into account in the previous algorithm. We therefore made a decision before any of the data on NO2 had been analysed to explore a classification based on clinical assessment of PEF records. This had the disadvantage that episodes were simply classed as present or absent with no quantification of their severity. Importantly, however, the clinicians classified the symptom records blind to PEF measurements and vice versa. Thus, the observation of a marked excess of episodes of reduced peak flow on the days immediately following the onset of upper respiratory infections (table 3) provides strong support for the validity of both sets of diagnoses.
Exposures to NO2 were assessed by Palmes tubes that were changed weekly. There was no practical method of measuring exposures over shorter periods, and this meant that exposures at the time of infections had to be estimated as a weighted average of two consecutive weekly average measurements. This may have resulted in some misclassification of exposures, which if anything would be expected to obscure relationships with health effects. Furthermore, we cannot exclude the possibility that short term peaks in exposure—for example, from being in a kitchen when a gas cooker was in use—might have a greater influence on asthmatic exacerbations than longer term average exposures.
When exploring the relation between NO2 and PEF, we focused on exposure during the week starting two days before the onset of each upper respiratory infection. This period was chosen because the tendency to reduced PEF associated with infections was observed over the first seven days from their onset (table 3), and a previous study had indicated that hospital admissions for asthma rise within two days of an increase in ambient NO2concentrations.12 Although we cannot be certain that it represents the most relevant time window, we think it is unlikely to be very inaccurate.
It is important to note that the exposures to NO2 that we recorded were relatively low, with a geometric mean of only 10.6 μg/m3. Thus, although our findings suggest a small influence on the response to infections, we cannot exclude the possibility that higher exposures have a greater impact. Nor can we rule out a larger effect in relation to a subset of infections caused by one or more specific viruses. Further studies in populations with higher exposures would be useful.
Acknowledgments
We are grateful to the children and parents who participated in the study, and also to the general practitioners and reception staff for their willing cooperation throughout the project. We thank Sandy Smith and Jackie Schreiber for their assistance with data collection. GMSS performed the laboratory analyses of the diffusion tubes. Sue McIntosh prepared the manuscript. CHL held a Department of Health (UK) studentship. AJC held an MRC Clinical Training Fellowship and was supported by Children Nationwide.