Article Text

Abstract
BACKGROUND The purpose of this study was to describe findings on sequential high resolution computed tomographic (CT) scans of nine patients with non-specific interstitial pneumonia.
METHODS Thin section CT scans of nine patients with pathologically proven non-specific interstitial pneumonia were evaluated retrospectively. All patients underwent sequential CT scanning (mean follow up 3.1 years (range 1–8)).
RESULTS The predominant finding on the initial CT scans in seven patients was patchy areas of ground glass opacity in both the central and peripheral lung, with (n = 5) or without (n = 2) irregular areas of consolidation. In another two patients areas of consolidation in both the central and peripheral lung were seen as the predominant abnormality. The initial parenchymal abnormalities had resolved completely in four patients with predominant ground glass opacity without bronchiolectasis. Some of the bronchiectasis and bronchiolectasis resolved. In two patients bronchiectasis and bronchiolectasis occurred at one year and two years of follow up, respectively. In two patients with predominant consolidation the consolidation decreased but persisted, and in one patient the consolidation evolved into honeycombing. In the other patient bronchiectasis progressed over the course of seven years, forming varicoid bronchiectasis.
CONCLUSION Patients with non-specific interstitial pneumonia may recover completely after treatment with corticosteroids, but as many as half of these patients will have persistent pulmonary abnormalities on CT scans including bronchiectasis and honeycomb lung.
- pneumonia
- non-specific interstitial pneumonia
- computed tomography
Statistics from Altmetric.com
Idiopathic interstitial pneumonias comprise four distinct clinicopathological entities: usual interstitial pneumonia (UIP), desquamative interstitial pneumonia (DIP), acute interstitial pneumonia (AIP), and non-specific interstitial pneumonia (NSIP).1 ,2Although first described by Katzenstein and Fiorelli in 1994,1 NSIP is not a new entity.2 It represents cases of idiopathic interstitial pneumonias that cannot be classified into one of the other subtypes. Histologically, NSIP is characterised by temporal uniformity of the disease process with varying degrees of interstitial inflammation or fibrosis.1 ,2 Non-specific interstitial pneumonia includes cases with cellular interstitial pneumonia and relatively little fibrosis, cases with cellular interstitial pneumonia and a significant amount of admixed fibrosis, and a relatively small proportion of cases with predominant fibrosis. It is important to distinguish NSIP from UIP because the latter has a poor prognosis.
The computed tomographic (CT) appearance of the disease has been described elsewhere.3-6 However, to our knowledge little has been reported about long term follow up by CT scanning. This study was undertaken to determine the long term CT findings in nine patients with NSIP.
Methods
Clinical records and CT scans of the lungs in nine patients with pathologically proven NSIP who underwent serial CT examinations during a follow up period of more than one year were reviewed retrospectively. The patients underwent examination between February 1987 and April 1999. The study group consisted of five men and four women aged 19–68 years (mean age 52 years) at the time of the initial examination. Five patients had never smoked and four patients had a history of smoking. Six patients had dyspnoea for 1–5 months (mean 2.2 months); three of the six also had cough and one of the six had fever. Another three patients had cough for 1–3 months (mean 2 months). In all patients the diagnosis was made by means of open lung biopsy (n = 4) or video assisted thoracoscopic surgery (n = 5). All pathological specimens were analysed by a lung pathologist (SY) and the findings were confirmed by outside consultation with experienced pulmonary pathologists. They also subcategorised the diagnoses into the following groups as suggested by Katzenstein and Fiorelli1: group 1, inflammation that was predominantly interstitial with little or no fibrosis; group 2, an equal mixture of inflammation and fibrosis; and group 3, interstitial collagen deposition with minimal inflammation. Two patients had group 1 disease and seven had group 2 disease. These nine patients had no history of connective tissue diseases, exposure to toxic fumes or dust, or specific drug intake. All patients underwent a mean of five sequential CT examinations (range 3–9) during a mean follow up period of 3.1 years (range 1–9 years). After the initial CT scan all nine patients received corticosteroids. In four patients corticosteroid (methylprednisolone sodium succinate) treatment was introduced with an initial dose of 1000 mg/day intravenously for three days, followed by a daily dose of 60 mg prednisone orally. Five patients were initially treated with a daily dose of 60 mg prednisone orally for six weeks. In all nine patients the daily dose was decreased progressively (maintenance dose 15 mg/day). Two patients subsequently received immunosuppressive agents because of incomplete clinical recovery with corticosteroid alone. The immunosuppressive agents used included azathioprine (n = 2) and cyclophosphamide (n = 1).
Thin section CT scanning was performed with a Quantex Plus CT unit (Yokogawa Medical System, Hino, Japan). All CT scans were obtained at maximal inspiration with the patient in the supine position using 2 mm collimation at 20 mm intervals. Scanning extended from the lung apices to below the costophrenic angles. Images were reconstructed with a high spatial frequency algorithm. The window settings used were appropriate for lung parenchyma (window width 1500 HU; level –700 HU) and mediastinum (window width 300 HU; level 10 HU).
The CT scans were evaluated independently and in random order by two observers, and the final assessment was achieved by consensus if there were disagreements in interpretation. The CT images were assessed specifically for patterns, distribution, and extent of the following pulmonary abnormalities: (a) ground glass opacity, defined as an area of slightly increased attenuation in which the bronchial walls and vessels remain visible; (b) consolidation, defined as an area of increased attenuation in which the adjacent bronchial walls and vessels are obscured; (c) irregular linear opacity, which included interlobular and intralobular lines and parenchymal bands (intralobular lines are defined as thickenings of the intralobular interstitium that result in a fine “web like” or “net like” appearance to the lobular parenchyma7); (d) bronchiectasis and bronchiolectasis which were identified on the basis of dilatation and an abnormal depiction of the airways in the peripheral portion of the lung (bronchiectasis was present if the bronchial diameter was greater than that of the accompanying artery or there was a lack of tapering of the bronchi and the signet ring sign was seen); and (e) honeycombing, defined as an accumulation of cystic spaces with thickened walls. The distribution of each finding was classified as being predominantly in the upper, middle, or lower lung zone; predominantly central, peripheral, bronchovascular, or random; and patchy, diffuse, or random. The terms “patchy, diffuse, or random” were used arbitrarily. “Patchy” areas of ground glass attenuation mean incomplete ground glass opacity distributed in pieces. The extent of involvement of each abnormality was assessed independently for each of the three zones of each lung. The CT score in the upper, middle, and lower lung zones was determined by visually estimating the extent of disease in each zone. The score was based on the percentage of lung parenchyma that showed evidence of abnormality and was estimated to the nearest 5% of parenchymal involvement. The overall percentage of involvement was calculated by averaging the scores from each of the six lung zones. Each of the patterns was also scored by using a semiquantitative system: grade 0, none; grade 1 (+), less than 5%; grade 2 (++), 5–24%; grade 3 (+++), 25–49%; grade 4 (++++), 50–74%; grade 5 (+++++), ⩾75 % of the lung parenchyma involved. The anatomical extent of bronchial dilatation was scored on the number of bronchopulmonary segments involved: grade 1 = 1 segment; grade 2 = 2–5 segments; grade 3 = 6–9 segments; grade 4 = 10–14 segments; and grade 5 = >14 segments.
To assess changes that occurred over time, the CT scans in each patient were examined in sequence. The pattern, extent, and distribution of abnormal CT findings were compared with findings in the same region on previous and subsequent CT scans.
Pulmonary function tests were performed within one month of the CT scans. Forced vital capacity (FVC) and forced expiratory volume in one second (FEV1) were determined with an Autospirometer (Minato, Osaka, Japan). The data were expressed as percentages of the predicted values. A change in FVC and FEV1 was defined as an increase or decrease of 15% of the values at initial measurement.
Results
INITIAL CT FINDINGS
The parenchymal abnormalities were bilateral in all patients. They were seen predominantly in the lower lung zones in six patients, the upper lung zone in one, and in two patients there was diffuse involvement. Parenchymal abnormalities were found in both the central and peripheral lung in all patients. Subpleural predominance was noted in three patients and central predominance in two. The HRCT grade of each parenchymal abnormality on the initial CT scans is presented in table 1. The overall extent of parenchymal abnormalities revealed by CT scanning ranged from 15% to 65% (median 40%).
HRCT grade of each parenchymal abnormality
On the initial CT scans patchy areas of ground glass attenuation were present in all nine patients. Areas of ground glass attenuation were seen as the predominant CT abnormality in six of the nine patients (fig1). Irregular areas of consolidation were present in seven patients, mainly associated with bronchovascular bundles (figs 2A and 3A). In two of the seven patients, areas of consolidation were seen as the predominant abnormality (fig 4A and 5A). In these two patients the areas of consolidation were found in both the central and peripheral lung.

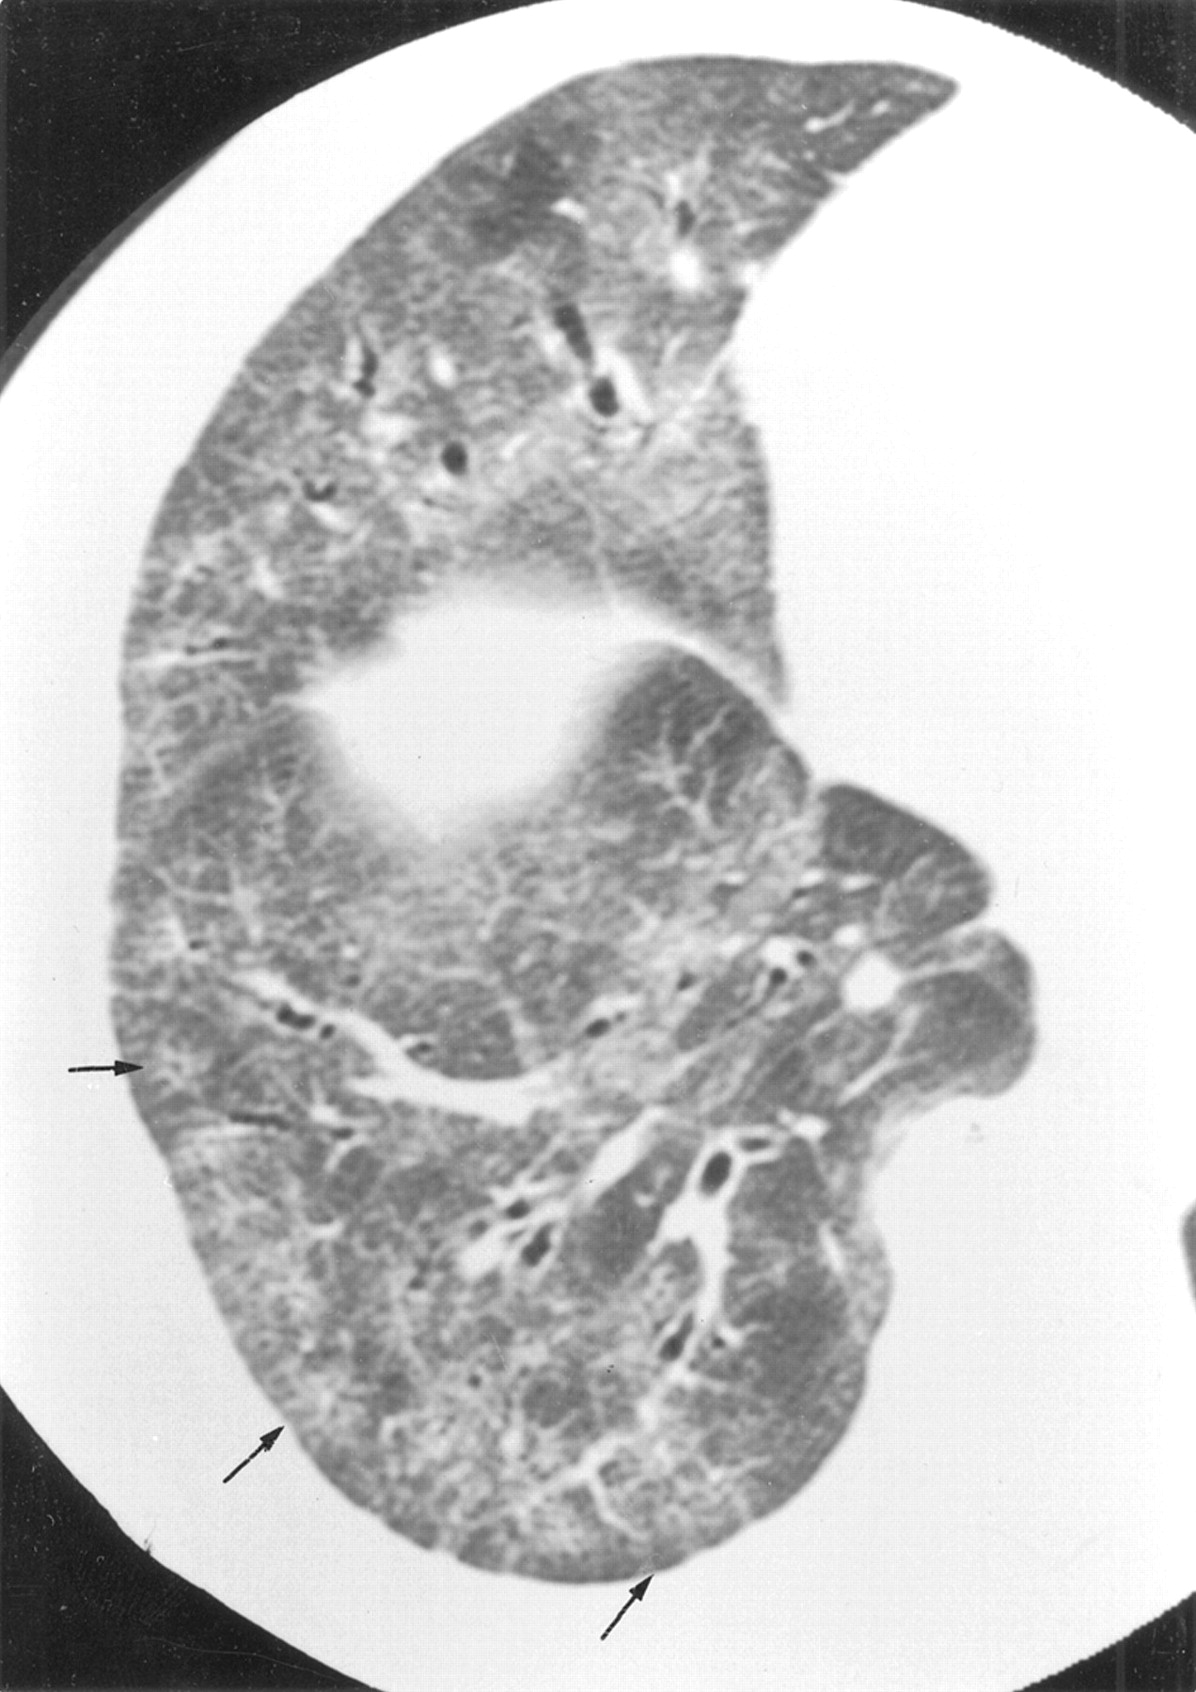
CT scan of non-specific interstitial pneumonia in a 60 year old woman (patient 5) showing ground glass opacity with superimposed intralobular lines (arrows).

Non-specific interstitial pneumonia in a 48 year old woman (patient 2). (A) Initial CT scan showing irregular areas of consolidation with bronchovascular bundle thickening and patchy areas of ground glass attenuation. (B) CT scan obtained at one year follow up showing improvement of lesions. Slight areas of ground glass attenuation and parenchymal bands are seen.

Non-specific interstitial pneumonia in a 19 year old man (patient 7). (A) Initial CT scan showing irregular areas of consolidation in peribronchovascular distribution. (B) CT scan obtained at two year follow up showing that irregular areas of consolidation evolve into bronchiectasis and bronchiolectasis (arrows).

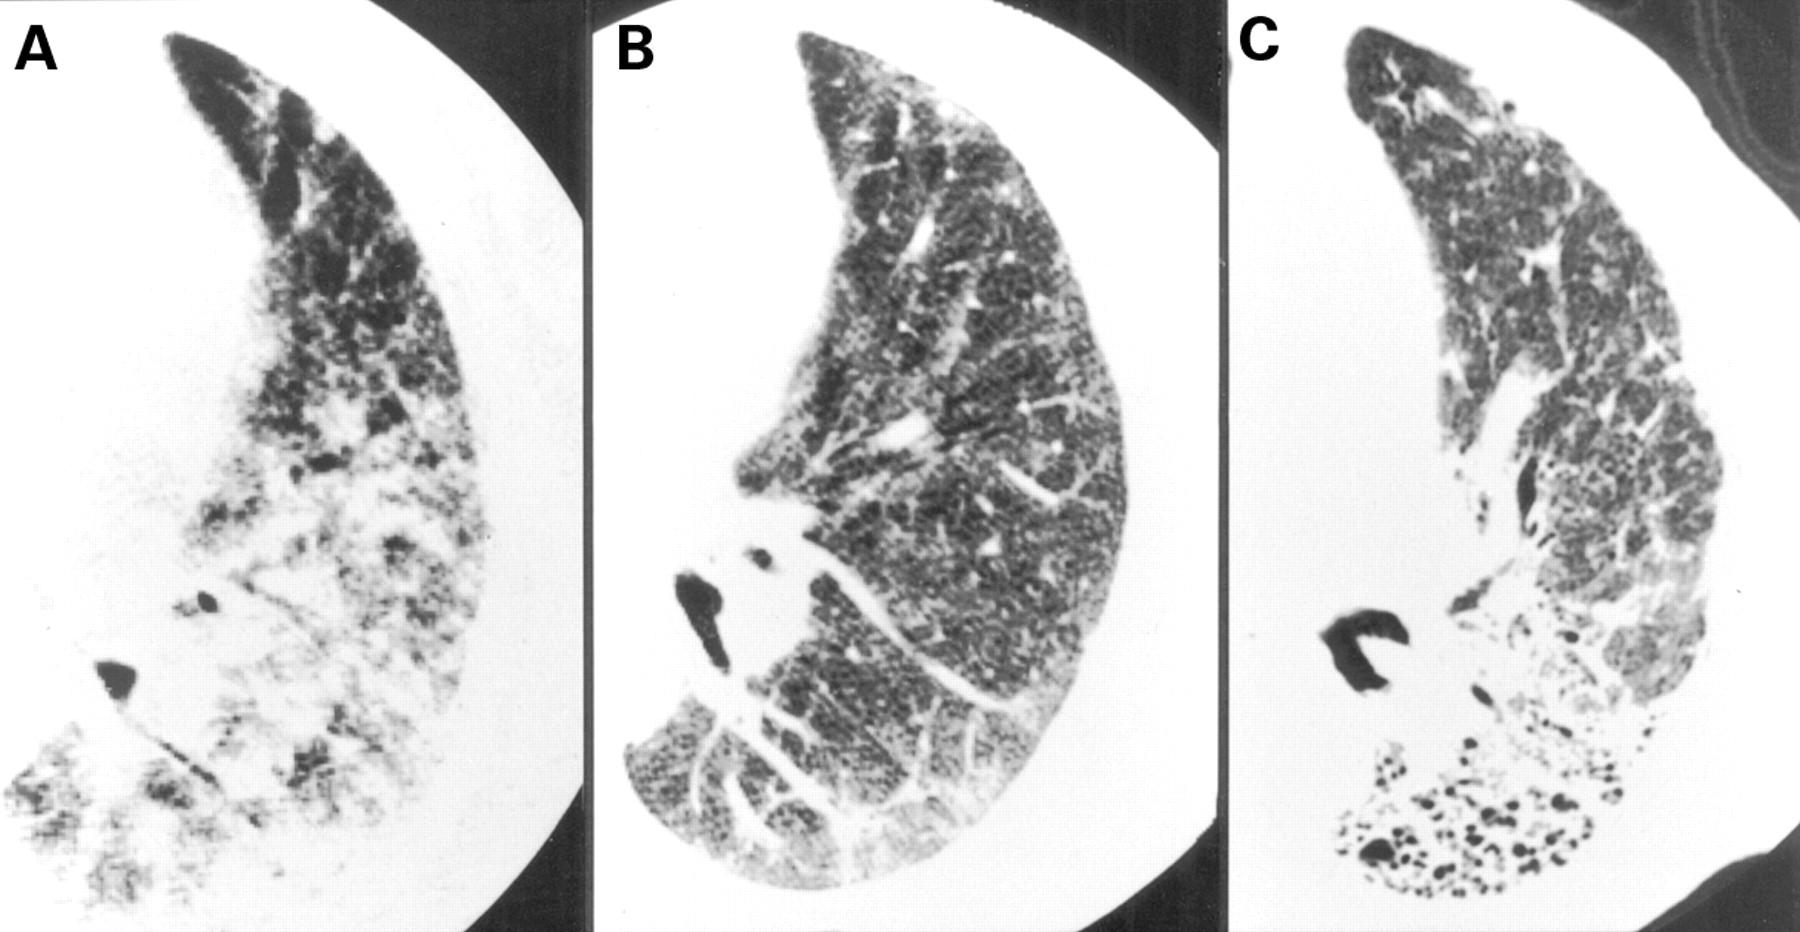
Non-specific interstitial pneumonia in a 60 year old man (patient 8). (A) Initial CT scan showing areas of consolidation with bronchiectasis and bronchiolectasis in both the central and peripheral lung. (B) CT scan obtained at one year follow up showing decrease of consolidation. (C) CT scan obtained at seven year follow up showing that bronchiectasis progressed, forming varicoid bronchiectasis (arrows). Note the decrease in bronchiolectasis.
Non-specific interstitial pneumonia in 43 year old woman (patient 9). (A) Initial CT scan showing areas of consolidation in the central and peripheral lung. (B) CT scan obtained at two year follow up showing decrease of consolidation. (C ) CT scan obtained at nine year follow up showing honeycombing. She was treated with corticosteroid alone and showed transient improvement in pulmonary function between (A) and (B) (forced vital capacity (FVC) from 53% predicted to 86% predicted; forced expiratory volume in one second (FEV1) from 60% predicted to 87% predicted). She was treated with a maintenance dose of 15 mg prednisone daily between (B) and (C) and pulmonary function deteriorated (FVC from 86% predicted to 44% predicted; FEV1 from 87% predicted to 81% predicted).
Intralobular lines were present within areas of ground glass attenuation in all patients, interlobular lines were found in seven patients, and parenchymal bands were seen on the initial scan in four patients. Bronchiectasis was observed in six patients and bronchiolectasis within areas of consolidation was seen in four patients. Honeycombing was not noted in any patient on initial CT scans.
FOLLOW UP CT FINDINGS
Figure 6 shows the changes in the extent of the disease on the CT scan. At follow up CT scanning the pulmonary abnormalities observed on the initial scans had resolved completely after treatment with corticosteroids in four patients with predominantly ground glass opacity without bronchiolectasis. In another patient with both ground glass opacity and consolidation the parenchymal abnormalities had improved but some residual areas of ground glass attenuation and parenchymal bands persisted for one year (fig 2). Grade 3 bronchiectasis changed to grade 0 bronchiectasis in one patient, grade 2 to grade 0 in one, grade 1 to grade 0 in one, and grade 3 to grade 2 in one. Grade 3 bronchiolectasis changed to grade 1 bronchiolectasis in one patient and grade 1 bronchiolectasis changed to grade 0 in one.

Changes in extent of disease on CT scan during the follow up period.
In anther two patients with irregular areas of consolidation in peribronchovascular distribution, consolidation evolved into bronchiectasis and bronchiolectasis at one year and two years follow up, respectively (fig 3).
In two patients with predominant consolidation the consolidation decreased with corticosteroid treatment, but persisted for a long time. In one of these patients bronchiectasis had progressed over a course of seven years, forming varicoid bronchiectasis with shrinkage in the central portion (fig 4), and in the other the consolidation evolved into honeycombing after nine years of follow up (fig 5). The latter patient died and a necropsy was performed which showed fibrosis with honeycombing. A summary of the cases that progressed to honeycombing/irreversible bronchiectasis is given in table2.
Summary of cases that progressed to honeycombing/irreversible bronchiectasis
Initial lung function tests showed abnormal FVC in seven patients and abnormal FEV1 in one patient. Figure 7 shows the changes in FVC. In three patients the FVC improved significantly during the follow up period but in five patients there was no change in FVC. One patient showed transient improvement in FVC but then deteriorated during the follow up period. One patient had a significant decline in FEV1.

Changes in FVC during the follow up period.
There was good interobserver agreement on the visual CT scores. Consensus was necessary for nine of 72 scores because of disagreement about the CT grading system.
Discussion
Non-specific interstitial pneumonia is characterised by varying proportions of interstitial inflammation and fibrosis that appears to occur over a single time span. The pathological lesions are temporally uniform. This temporal uniformity contrasts sharply with the temporal heterogeneity characteristic of UIP.1 ,2
The prognosis in NSIP is generally good. Only 11% of 48 patients followed up by Katzenstein and Fiorelli died of the disease, while nearly half (45%) recovered completely and 42% remained stable or improved.1 Bjoraker et al 8 also found that patients with NSIP had a better prognosis than those with UIP. In their study the median survival for patients with NSIP was more than 13 years whereas the median survival for patients with UIP was 2.8 years. Cottin et al 6 retrospectively studied 12 consecutive patients with NSIP and all were alive at the last follow up 50 (40) months after diagnosis. Ten patients (83%) were clinically improved or stabilised while in two patients the disease had progressed, leading to radiological features compatible with end stage IPF in one case but without honeycombing.6 Daniil et al 9 recently confirmed that survival was significantly greater in patients with NSIP than in those with UIP. In addition, they found different patterns of abnormalities on the HRCT scan that increased the likelihood of predicting the pathological subset preoperatively.
Park et al 3 described the CT findings in seven patients with NSIP. The most common finding observed on the initial CT scans was bilateral patchy areas of ground glass attenuation present alone or with areas of consolidation or irregular lines. On the follow up CT scan the initial parenchymal abnormalities had resolved completely in three patients, improved in another three, and persisted in one. There were no deaths among the seven patients, but the mean duration of the follow up period was only 7.5 months. They also reported that, in three of the seven patients, the overall extent of parenchymal abnormalities had improved but that bronchial dilatation observed on the initial scans persisted or had progressed and new irregular lines were noted within 15 months.3 Kimet al 4 described the CT findings in 23 patients with NSIP. Their study included five of seven patients reported by Park and associates.3 The predominant CT findings, seen in their 23 patients, were bilateral patchy areas of ground glass opacity with (35%) or without (65%) areas of consolidation. Irregular linear opacities (87%) and thickening of bronchovascular bundles (65%) were frequently seen. They reported that the areas of ground glass opacity, with or without irregular opacities or bronchial dilatation on the CT scan, corresponded pathologically to areas of interstitial thickening caused by varying degrees of interstitial inflammation and fibrosis showing temporal uniformity. The areas of consolidation represented the areas of bronchiolitis obliterans organising pneumonia (BOOP), foamy cell collections in alveolar spaces, or microscopic honeycombing with mucin stasis.4 Kim et al 5 have recently assessed the serial CT findings in 13 patients with NSIP and reported that the areas of ground glass opacity had decreased on the follow up CT scan after treatment, and that the extent of the disease correlated significantly with the functional improvement. The mean duration of follow up was 11 months.
In our patients the predominant HRCT findings were bilateral patchy areas of ground glass attenuation with intralobular lines in both the central and peripheral lung, often with irregular areas of consolidation and bronchovascular bundles. This appearance is different from that of UIP and rather similar to that of cryptogenic organising pneumonia (COP). Daniil et al 9also considered that the HRCT scans were atypical of cryptogenic fibrosing alveolitis in 13 of 15 patients with NSIP compared with four of 12 patients with UIP. In NSIP areas of honeycombing are rarely observed on the initial CT scans.5 ,6 However, bronchiolectasis is frequently found within the consolidation. The frequency of bronchiolectasis in NSIP is considered to be different from that in COP. Bronchial dilatation is found in COP but bronchiolectasis is rare.10 ,11 In 43 patients with COP studied by Lee et al 11bronchial dilatation was present in 24 (56%) but tortuous bronchial dilatation was not described in their study. In our patients a transbronchial lung biopsy specimen taken in eight patients showed cellular alveolitis in three patients (cases 3, 4, and 7), cellular alveolitis with organising pneumonia in two (cases 1 and 6), organising pneumonia in two (cases 8 and 9), and UIP in one (case 2). NSIP may be mistaken for COP diagnosed by a transbronchial lung biopsy specimen.
The pathophysiological basis of the intralobular lines in NSIP is unclear, but they are considered to reflect thickening of the distal peribronchovascular interstitial tissues or of the intralobular interstitium which consists of a fine network of fibres in alveolar walls.7 These are non-specific findings seen in a variety of diseases including UIP, asbestosis, chronic hypersensitivity pneumonia, and alveolar proteinosis. Ground glass opacity with interlobular and intralobular lines superimposed on the CT is called “crazy paving appearance”. The crazy paving appearance has been considered to be highly suggestive of alveolar proteinosis. However, this appearance can also be caused by several other diseases.12 In NSIP superimposed interlobular lines are less prominent, whereas in alveolar proteinosis both interlobular lines and intralobular lines are prominent to the same degree.
In our nine patients with NSIP the four patients with a predominantly ground glass opacity without bronchiolectasis recovered completely. Some of the bronchiolectasis and bronchiectasis were reversible. In two patients bronchiectasis and bronchiolectasis appeared on the follow up CT scan. In one patient with predominant consolidation the consolidation decreased with corticosteroid treatment, but the parenchymal abnormalities persisted and evolved into honeycombing. The same observation is found in BOOP with collagen vascular disease. Akira et al 13 reported that consolidation which corresponded to BOOP, with or without coexistent chronic eosinophilic pneumonia, evolved into honeycombing on sequential CT scans in polymyositis-dermatomyositis.
In one of our patients the bronchiectasis had progressed to form varicoid bronchiectasis. The tortuous bronchial dilatation within the consolidated lung on the initial CT scan suggested that the consolidation was fibrotic. The decrease in consolidation seen on the follow up scan in this patient may be related to progression of fibrosis with cicatrisation and further traction on the bronchi. NSIP may be one of the causes of varicoid bronchiectasis. The progression of NSIP on the HRCT scan was different from that of UIP in which progression of honeycombing is found on serial CT scans.14
Although scout views provided anatomical references to ensure that similar planes were obtained in sequential CT studies, there were some paired sections that were not truly anatomically comparable in our study. However, in most patients similar levels of CT scans were available for anatomical comparison.
In conclusion, patients with NSIP may recover completely after treatment with corticosteroids, but as many as half of these patients will have some persistent pulmonary abnormalities on the CT scan including bronchiectasis and end stage honeycomb lung.