Article Text

Abstract
BACKGROUND Nitric oxide (NO) may have a role in the pathophysiology of tissue injury in response to inhaled ozone in animals.
METHODS A double blind, randomised, placebo controlled, crossover study was undertaken to investigate the effects of inhaled ozone in 10 normal and 10 atopic asthmatic volunteers. Subjects were exposed to 200 ppb ozone or clean air for four hours with intermittent exercise, followed by hourly measurement of spirometric parameters and exhaled NO for four hours. Nasal NO and methacholine reactivity were measured and exhaled breath condensate and induced sputum samples were collected four and 24 hours after exposure.
RESULTS Exposure to ozone caused a fall in forced expiratory volume in one second (FEV1) of 7% in normal subjects (p<0.05) and 9% in asthmatic subjects (p<0.005). There was a 39% increase in sputum neutrophils at four hours in normal subjects (p<0.05) and a 35% increase at four hours in asthmatic subjects, remaining high at 24 hours (p<0.005 and p<0.05, respectively). There were no differences between normal and asthmatic subjects. There were no changes in methacholine reactivity, exhaled or nasal NO, nitrite levels in exhaled breath condensate, or sputum supernatant concentrations of interleukin 8, tumour necrosis factor α, or granulocyte-macrophage colony stimulating factor in either group.
CONCLUSIONS Exposure to 200 ppb ozone leads to a neutrophil inflammatory response in normal and asthmatic subjects but no changes in exhaled NO or nitrite levels.
- ozone
- exhaled nitric oxide
- nitrite
Statistics from Altmetric.com
Nitric oxide (NO) is a short lived effector molecule derived from the amino acid l-arginine which takes part in a number of physiological processes including bronchial relaxation and airway reactivity.1-4 Recent evidence suggests that NO may also have a role in the pathophysiology of tissue injury associated with inflammation as a cytotoxic mediator produced by host defence cells.5
Acute inhalation of the irritant gas ozone causes impaired lung function and tissue damage. Production of NO is increased in animals following exposure to ozone.6-8 This is associated with increased expression of inducible nitric oxide synthase (iNOS) protein.6-9
NO is an unstable molecule and reacts rapidly with metals and reductants to yield other reactive species, including peroxynitrite anion (ONOO–) and the more stable oxidation product nitrite (NO2 –).10 The nitrite concentration in exhaled breath condensate has been shown to be higher in asthmatic subjects than in normal subjects,11 which may reflect oxidant stress within the lung.
Previous exposure studies in humans have consistently shown decreases in lung function in response to ozone in both normal and asthmatic subjects12 ,13 accompanied by a neutrophilic inflammatory response14-16 and increases in pro-inflammatory cytokines including interleukin (IL)-8 and granulocyte-macrophage colony stimulating factor (GM-CSF),15 ,17 ,18 both of which are considered important inflammatory mediators in the pathophysiology of asthma.19However, the effect of ozone exposure on NO production in humans has not yet been reported. To investigate a possible role for NO in the inflammatory response to inhaled ozone we measured exhaled and nasal NO levels and the concentration of nitrite in exhaled breath condensate in normal and asthmatic subjects following exposure to ozone.
Methods
SUBJECTS
Ten healthy volunteers (four women) of mean age 27.3 (1.4) years were studied. All had normal bronchial reactivity (screening PC20 methacholine >64 mg/ml) and were non-atopic on skin prick testing to common aeroallergens (cat,Aspergillus fumigatus, grass pollen, andDermatophagoides pteronyssinus). They reported no history of respiratory or allergic disease and were on no medications. There were also 10 mild atopic asthmatic volunteers (six women) of mean age 26.6 (2.3) years, as defined by American Thoracic Society criteria,20 with a forced expiratory volume in one second (FEV1) of >70% predicted. All asthmatic subjects had a screening PC20 to methacholine of <4 mg/ml and were controlled with inhaled β2 agonists only. No subjects were taking inhaled or oral corticosteroids at the time of the study or in the eight weeks prior to it (table 1). All subjects were non-smokers or ex-smokers of more than five years. None had suffered an upper respiratory tract infection in the eight weeks prior to or during the study.
Characteristics of asthmatic subjects
Written informed consent was obtained from all volunteers. The study was approved by the ethics committee of The Royal Brompton Hospital and National Heart & Lung Institute.
STUDY PROTOCOL
Subjects attended an initial screening visit for baseline spirometric tests (FEV1 and forced vital capacity (FVC)), skin prick testing, and methacholine challenge. On study days subjects arrived at 08.00 hours and pre-exposure measurements were made in the following order: spirometric tests, exhaled and nasal NO levels, collection of exhaled air condensate, methacholine challenge, and sputum induction. Subjects were then randomised to exposure to clean air or ozone 200 parts per billion (ppb) for four hours. The subjects and the person responsible for taking the clinical measurements were blinded as to the nature of the challenge. Spirometric parameters and exhaled NO concentrations were measured immediately after exposure and then hourly for four hours. Nasal NO concentrations, exhaled air condensate, methacholine challenge, and sputum induction were repeated four hours after exposure. The subjects returned 24 hours after exposure for measurement of spirometric parameters, exhaled and nasal NO concentrations, collection of exhaled air condensate, and measurement of bronchial reactivity and sputum induction. Subjects underwent each of the treatment arms with a four week washout between exposures.
OZONE EXPOSURE
Subjects were exposed to ozone for four hours in a chamber (1.4 × 1.7 × 2.3 m) exercising on a cycle ergometer (Tunturi Ergometer W1, Tunturi, Piispanristi, Finland) for 20 minutes of each 30 minute period. Work loads were 50 W to simulate mild to moderate work. Ozone was generated by passing compressed air through an ozonator (Wallace & Tiernan Laboratory Ozonator type BA.023, Wallace & Tiernan Ltd, Tonbridge, UK). Mean (SD) concentrations were maintained at 0.2 (0.01) ppm measured using a Dasibi 1008-AH ozone monitor (Quantitech Ltd, Milton Keynes, UK).
LUNG FUNCTION MEASUREMENTS
FEV1 and FVC were measured using a dry wedge spirometer (Vitalograph, Buckingham, UK). Values are expressed as percentage predicted. Baseline values were measured after 15 minutes rest and taken as the highest of three readings. Single readings only were taken at other times. The level of bronchial reactivity was assessed by methacholine challenge performed according to a standardised technique.21 The dose required to cause a 20% drop in FEV1 (PC20) was determined by linear interpolation of the concentration-FEV1 response curve.
EXHALED AND NASAL NITRIC OXIDE (NO) LEVELS
Concentrations of NO in exhaled breath were measured by a chemiluminescence analyser (Model LR2000; Logan Research, Rochester, UK).22 The analyser is sensitive to NO in concentrations of 1–500 ppb by volume with a resolution of 0.3 ppb. The analyser was calibrated using certified NO mixtures (90 ppb and 436 ppb) in nitrogen (BOC Special Gases, Guildford, UK). In addition to NO, the analyser measures CO2 (resolution 0.1% CO2; response time 200 ms) and sample pressure and volume in real time. Measurements were made by slow exhalation (5–6 l/min) from total lung capacity for 15–20 seconds against a low resistance (5 cm H2O) to exclude nasal contamination. The value corresponding to the plateau of the end exhaled CO2 reading was taken as representative of an alveolar sample. Pressure during expiration is kept constant (3 (0.4) mm Hg) by using a visual display of expiratory flow measured by pressure and volume sensors within the analyser. Values were taken as the mean of three readings. Nasal NO concentrations were measured using the same analyser with a scale of 0–5000 ppb. The measurement was made by inserting a probe into one of the nares and asking the subject to inhale and hold their breath. The breath-holding closes the soft palate and prevents mixing of nasal NO with NO from the lower airways.
EXHALED BREATH CONDENSATE AND NITRITE ASSAY
Breath condensate was collected using a glass condensing device which contained ice and water and was suspended in a second glass chamber, as previously described.23 Condensate formed on the outer surface of the inner glass chamber separated from ambient air. After mouth rinsing, subjects wearing a nose clip breathed tidally through a mouthpiece and a system of one way valves, which allowed inhalation of room air and exhalation into the condensing apparatus through a non-returnable valve. During the first three minutes no ice and water were present to allow room air within the apparatus to be expelled. Ice and water were then added and the subject continued to breathe into the apparatus for a further 12 minutes. If the subjects felt saliva in their mouths they were instructed to rinse their mouths again. The mouthpiece was used as a saliva trap. Approximately 1 ml of condensate was collected and stored at –70°C for further analysis.
Nitrite was measured using a modification of the method of Miskoet al.24 100 μl samples and standards were added in duplicate to a clear bottomed 96 well plate (Costar UK Ltd, High Wycombe, UK). These were mixed with 10 μl 2,3-diaminonaphthalene (DAN), 0.05 mg/ml in 0.62 M hydrochloric acid (Alexis Corporation, Nottingham, UK). The plates were incubated in the dark at room temperature for 10 minutes. The reaction was then stopped by the addition of 10 μl 1.4 M NaOH. The reaction product was measured immediately in a fluorescent plate reader (Biolite F1, Labtech, Uckfield, UK) with excitation at 360 nm and emission read at 460 nm. Standard curves for nitrite were made in distilled water. The limit of sensitivity of the assay is 0.1 μM. The reproducibility of exhaled breath nitrite concentrations performed on paired samples from 34 normal subjects showed an intraclass correlation coefficient of 0.71.
SPUTUM INDUCTION AND PROCESSING
Induced sputum samples were collected and processed as previously described.25 Subjects inhaled 3.5% saline for 15 minutes in total via an ultrasonic nebuliser (DeVilbiss 2000; DeVilbiss Co, Heston, UK) with a calibrated mass median aerodynamic diameter of 4.5 μm and output of 4.5 ml/min. The aerosol was inhaled through a tube 110 cm long with an internal diameter of 22 mm equipped with a mouthpiece, with the subject's nose clipped. Subjects discarded saliva into a bowl and mouth washed before each expectoration. Secretions collected during the first five minutes were discarded to minimise squamous epithelial cell contamination. Subjects were encouraged to cough deeply at five minute intervals and any other time they felt the need. Secretions expectorated over the final 10 minutes were kept at 4°C for not more than two hours before processing.
The whole sputum sample was processed as described previously.25 Sputum was diluted with Hank's balanced salt solution (HBSS) containing dithiothreitol (DTT) (Sigma Chemicals, Poole, UK) and vortexed at room temperature. When homogeneous, the volume was recorded and the sample was diluted further with HBSS to a final concentration of 0.2% DTT and centrifuged at 300g for 10 minutes. The supernatant was separated and frozen at –70ºC until further analysis. The cell pellet was resuspended in HBSS. Total cell counts were determined on a haemocytometer slide using Kimura stain and slides were prepared using a cytospin (Shandon, Runcorn, UK) and stained with May-Grunwald-Giemsa stain. Differential cell counts were performed by a blinded observer; 300 non-squamous cells were counted on two slides for each sample. Samples with >50% squamous cells were considered unsatisfactory and discarded. Differential cell counts were expressed as a percentage of lower airway cells—that is, excluding squamous epithelial cells.
SPUTUM SUPERNATANT ASSAYS
Concentrations of interleukin (IL)-8, tumour necrosis factor (TNF)-α, and granulocyte-macrophage colony stimulating factor (GM-CSF) in the sputum supernatant were measured using an amplified sandwich ELISA, as described previously.26 All samples were assayed in duplicate and standards were made up in 0.2% DTT.
ANALYSIS OF DATA
Exhaled NO measurements have previously been shown to be normally distributed in normal and asthmatic subjects.27Consequently, exhaled and nasal NO levels and spirometric results were analysed using repeated measures analysis of variance (ANOVA). Where differences were found, the peak value following exposure was taken as a summary measurement. Comparisons between placebo and ozone exposure were then made at this point using a pairedt test. PC20 values were log transformed for analysis and the geometric means calculated and the results compared using a paired t test to examine differences between exposures at four and 24 hours. PC20 values of >64 mg/ml were included as censored data (log value 1.81). Results of parametric data are expressed as mean (SE) unless stated otherwise. Cell count and sputum supernatant data are not normally distributed and are expressed as medians throughout. The Wilcoxon signed rank test was used for comparisons between placebo and ozone exposure at four and 24 hours for normal and asthmatic subjects. Because there were changes in neutrophil counts following exposure to air in normal subjects, changes in neutrophil counts after exposure to ozone are expressed as a ratio between the change in neutrophils after ozone compared with the change after air. Differences between normal and asthmatic subjects were analysed using the Kruskal-Wallis test. If this was significant, pairwise comparisons were made using the Mann-Whitney rank sum test. Assuming a standard deviation of 3 ppb in normal subjects and 20 ppb in asthmatic subjects for exhaled NO, the study had 80% power to detect a 50% increase in exhaled NO in normal subjects and a doubling of exhaled NO in asthmatic subjects at the 95% confidence level. A p value of <0.05 was considered significant throughout.
Results
ADVERSE EVENTS
All volunteers completed the trial successfully. One normal subject reported feeling hot and generally unwell with a sore throat for 24 hours following exposure to ozone.
LUNG FUNCTION
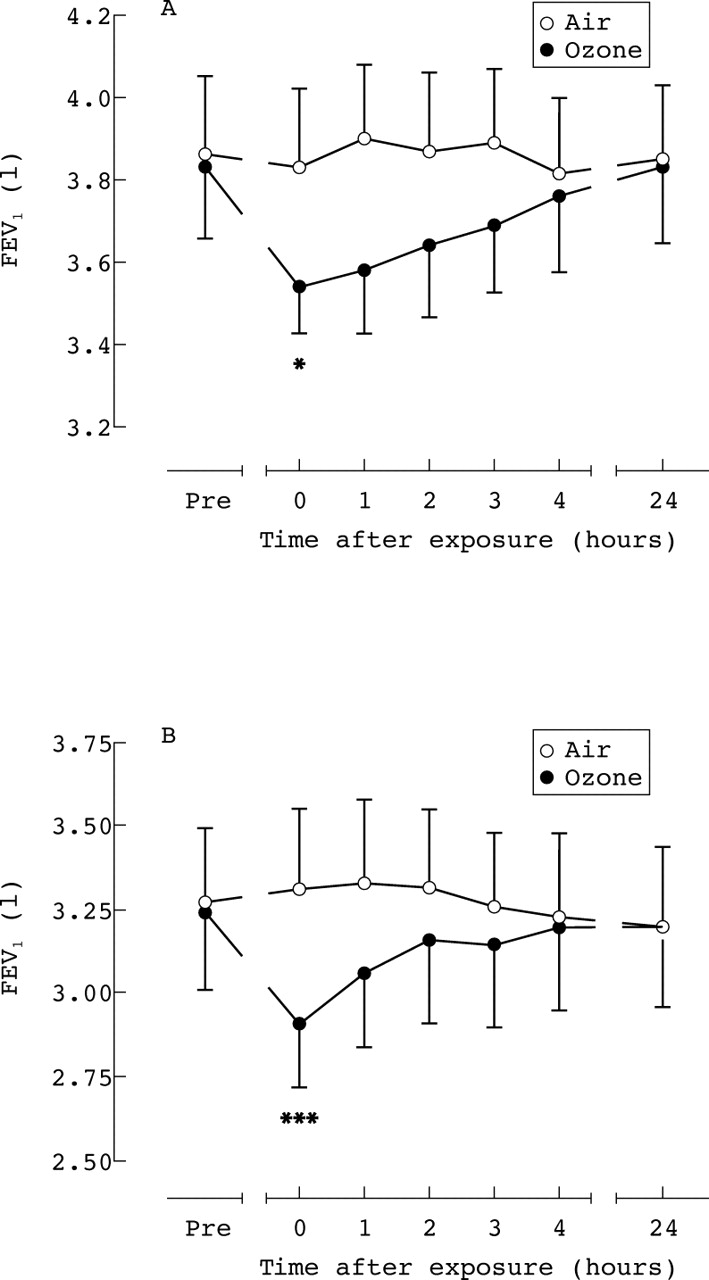
Baseline FEV1 values did not differ between the two exposure days for either normal or asthmatic subjects or between the two groups (normal subjects 97.9 (2.6)% predicted; asthmatic subjects 90.6 (3.8)%). There was a significant fall in FEV1 following exposure to ozone compared with placebo exposure in both normal subjects (mean fall 6.7 (2.2)%, fig 1) and asthmatic subjects (mean fall 9.3 (2.3)%, fig 1), which was maximal immediately after exposure to ozone. There was no difference between the two groups in the maximal fall in FEV1 from baseline following ozone exposure (normal subjects 0.28 (0.11) l; asthmatic subjects 0.32 (0.08) l). Bronchial reactivity at screening was significantly higher in the asthmatic subjects than in the normal subjects (normal subjects all >64 mg/ml; asthmatic subjects mean PC20 0.5 mg/ml, p<0.0001). There was no change in bronchial reactivity to methacholine following ozone exposure in either the normal or asthmatic subjects (table 2).

Effect of ozone exposure on FEV1 in (A) normal and (B) asthmatic subjects following exposure to air (○) and ozone 200 ppb (•). Values are shown as mean and 1 SE. *p<0.05, ***p<0.005 compared with exposure to placebo.
Mean (SE) methacholine reactivity in normal and asthmatic subjects following inhalation of ozone (200 ppb) or air
EXHALED AND NASAL NITRIC OXIDE
The baseline values for exhaled NO were higher in the asthmatic subjects (24.0 (6.5) ppb) than in the normal subjects (7.8 (1.0) ppb; p<0.05). There were no changes in exhaled NO in normal or asthmatic subjects following either exposure (fig 2). There were no differences in baseline nasal NO values between the two groups and no changes within either group following either exposure.

Effect of ozone exposure on exhaled nitric oxide (NO) levels in (A) normal and (B) asthmatic subjects following exposure to air (○) and ozone 200 ppb (•). Values are shown as mean (SE).
EXHALED BREATH NITRITE LEVELS
There was no difference in the baseline concentration of nitrite in exhaled breath condensate between normal and asthmatic subjects (table 3). Baseline values did not change between study days and there were no changes in nitrite levels following ozone exposure in normal or asthmatic subjects (table 3).
Mean (SE) concentrations (pmol) of nitrite in exhaled breath in normal and asthmatic subjects following inhalation of ozone (200 ppb) or air
SPUTUM CELL COUNTS
One normal and one asthmatic subject were consistently unable to produce adequate sputum samples; sputum results for these two subjects have been excluded from analysis. All other samples were adequate except five normal samples and three asthmatic samples. Where one sample of a pair at any particular time point was inadequate, results from both samples for that time point for that subject were excluded from the analysis.
There was a significantly greater differential eosinophil count in the pre-exposure sputum samples of asthmatic subjects than normal subjects (median 1.4% (range 0–10.8) versus median 0% (range 0–0.4); p<0.001) but no differences in the differential counts of other cell types. There was no difference in the pre-exposure total cell counts between asthmatic and normal volunteers (median 1.2 million cells/ml (range 0.5–5.6) versus 1.0 million cells/ml (range 0.1–3.8), p = 0.2).
In normal subjects there was a significant increase in differential neutrophil counts following exposure to air at both four and 24 hours after exposure compared with baseline but no change in absolute neutrophil counts (fig 3). However, there was a significantly greater increase in neutrophils four hours after exposure to ozone (fig 3). The mean ratio between the change in neutrophils after ozone compared with the change after air was 4.2. The differential neutrophil count following ozone remained higher than that following air at 24 hours, although not significantly (mean ratio 1.5). There was also a significant increase in absolute neutrophil counts four hours after exposure to ozone compared with exposure to air (4.4 versus 0.5 million cells/ml, fig 3) with a mean ratio of 14.0 for the change after ozone compared with the change after air. There was a similar significant increase in the differential neutrophil count in asthmatic subjects four hours after exposure to ozone (mean ratio 2.2) and this remained significantly raised at 24 hours (fig 3) with a mean ratio of 3.0. The absolute neutrophil count at four hours after ozone exposure was significantly higher than following air exposure (1.9 versus 0.4 million cells/ml, fig 3) with a mean ratio of 4.3 for the change after ozone compared with the change after air. There was no difference in the magnitude of the neutrophil response between normal and asthmatic subjects.

Effect of inhaled ozone on sputum neutrophils. Differential counts in (A) normal and (B) asthmatic subjects and absolute counts in (C) normal and (D) asthmatic subjects following exposure to ozone 200 ppb (•) and air (○). Values are shown as individual data points with medians. Absolute counts are shown on a logarithmic scale. *p<0.05, **p<0.005 compared with placebo.
The rise in the proportion of neutrophils was accompanied by a significant fall in macrophages. In normal subjects differential macrophage counts were significantly lower four hours after exposure to ozone compared with air exposure (fig 4) but there was no change in absolute macrophage counts (fig 4). In asthmatic subjects the differential macrophage count four hours after exposure to ozone was significantly lower than after air and remained significantly lower at 24 hours after exposure (fig 4). However, there were no changes in absolute macrophage counts in the asthmatic subjects (fig 4).

Effect of inhaled ozone on sputum macrophages. Differential counts in (A) normal and (B) asthmatic subjects and absolute counts in (C) normal and (D) asthmatic subjects following exposure to ozone 200 ppb (•) and air (○). Values are shown as individual data points with medians. Absolute counts are shown on a logarithmic scale. *p<0.05, **p<0.005 compared with placebo.
There were no changes in the differential or absolute counts of epithelial cells, eosinophils, or lymphocytes in either normal or asthmatic subjects at any time.
SPUTUM SUPERNATANT CONCENTRATIONS
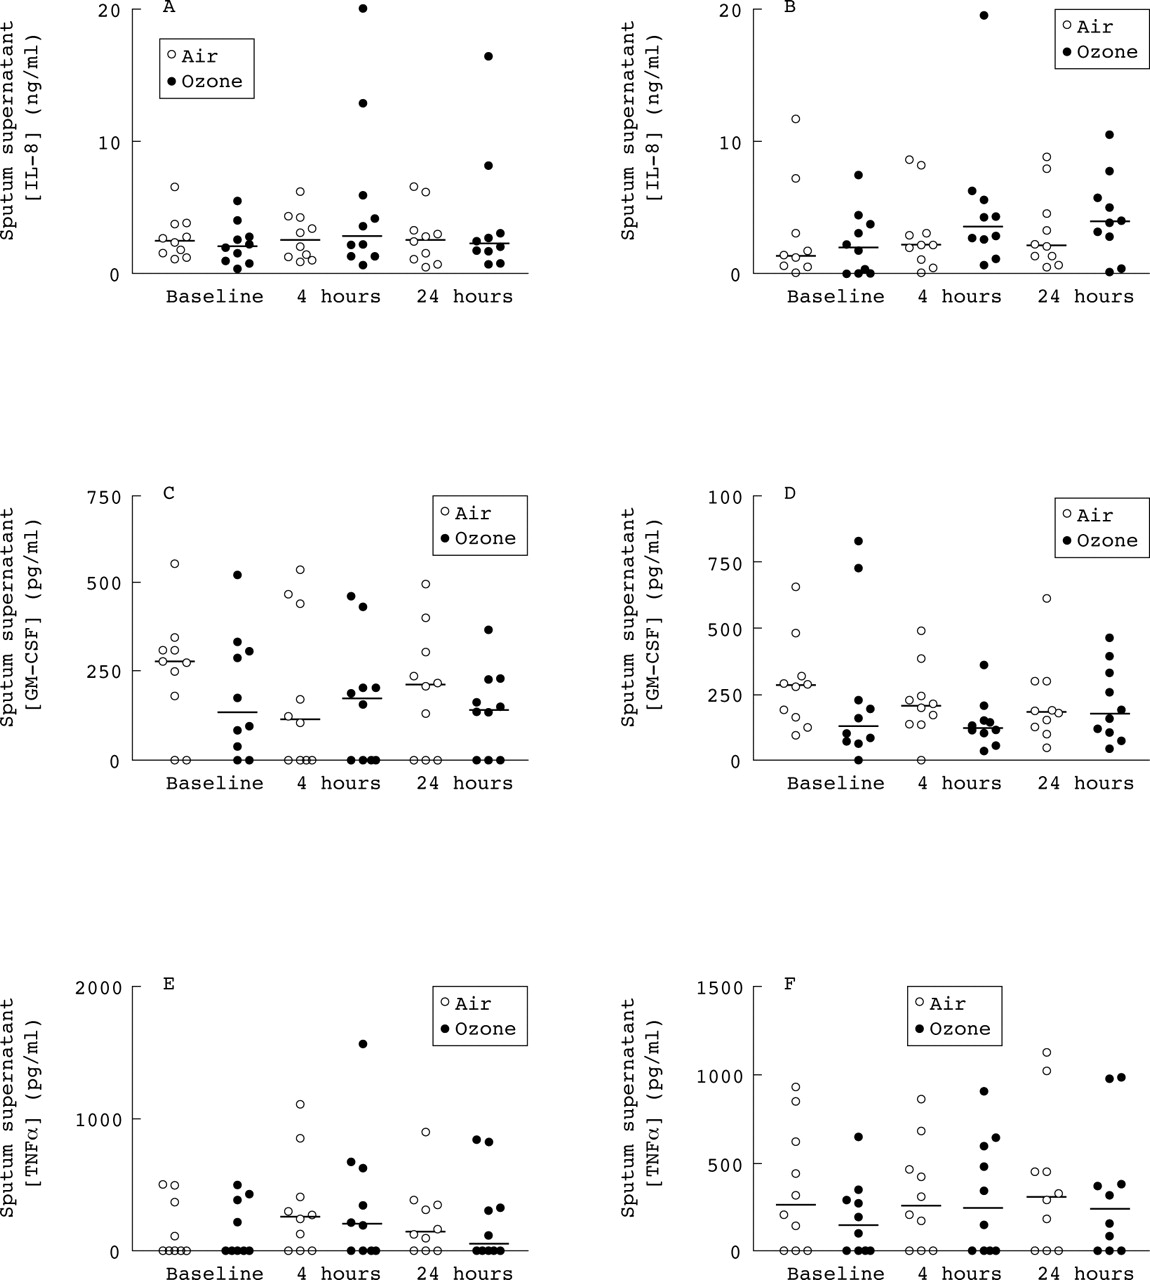
There was a tendency for IL-8 levels to be increased four hours after exposure to ozone in both normal and asthmatic subjects (fig 5) but this failed to reach statistical significance. There were no changes in the concentrations of TNF-α or GM-CSF in either normal or asthmatic subjects (fig 5).

Effect of inhaled ozone on sputum supernatant inflammatory markers. Sputum supernatant interleukin (IL)-8, granulocyte macrophage-colony stimulating factor (GM-CSF), and tumour necrosis factor (TNF)-α concentrations in normal subjects (A, C, E) and subjects with asthma (B, D, F) following exposure to ozone 200 ppb (•) and air (○). Values are shown as individual data points with medians.
Discussion
This study found no increase in NO production in normal and asthmatic subjects following inhalation of 200 ppb ozone, despite clear falls in FEV1 and increases in induced sputum neutrophils in both groups. The dose of 200 ppb ozone was chosen as an environmentally relevant dose. During the summer ground concentrations of ozone may increase to 100 ppb and sometimes above 200 ppb in the UK and Europe.28
Increased exhaled NO is an index of inflammation in a number of inflammatory lung diseases including asthma and bronchiectasis.29 We have shown that basal levels of exhaled NO are higher in asthmatic subjects than in normal subjects, confirming the results of previous studies.30 ,31 There was no change in the levels of exhaled or nasal NO following exposure to ozone in normal or asthmatic subjects. Previous work in animals has shown that exposure of rats to ozone leads to increases in spontaneous and stimulated production of NO from alveolar macrophages6and type II epithelial cells.7 This increase in NO production is due to upregulation of nitric oxide synthase,6 ,7 ,9 is dependent on the presence ofl-arginine in the culture medium, is inhibited byl-NMMA (a NOS inhibitor), and is accompanied by increases in iNOS mRNA expression. NO is also produced in vivo in rat lung following ozone exposure.32 The lack of increased NO production in response to ozone in the present study may simply reflect species differences between rats and humans. Alternatively, differences may be due to the dose of ozone used. Our subjects were exposed to 0.2 ppm ozone whilst the rats were exposed to 1–3 ppm. Exposure to lower doses of 0.12 or 0.5 ppm had no effect on spontaneous or stimulated NO production in rat macrophages.6 The lack of increase in exhaled NO following ozone may be related to the neutrophil inflammatory response seen herein. Activated neutrophils produce a number of oxidant species, including superoxide anion, during the respiratory burst.33 Superoxide interacts with NO to produce peroxynitrite.34 In the present study it may be that inhalation of ozone leads to an increase in production of NO within the lung, but the NO then reacts with neutrophil derived superoxide, masking any increase in exhaled NO.
NO is an unstable molecule and reacts rapidly to yield other reactive species such as peroxynitrite anion (ONOO–) and also the more stable end product nitrite (NO2 –).10 It is possible to measure the concentration of nitrite in samples of exhaled breath condensate,11 and increased levels may reflect increased production of NO within the lung. The concentration of nitrite in exhaled breath condensate has previously been shown to be higher in asthmatic than normal subjects.11 This is in contrast to the present study which found no difference in nitrite levels between the two groups. We did, however, demonstrate a difference between asthmatic and normal subjects in exhaled NO, suggesting that exhaled NO is a more sensitive marker of asthma than exhaled breath nitrite. This suggestion could be tested by analysing the data using cut off points in exhaled NO and nitrite levels to decide who was asthmatic, to allow formal testing of sensitivity. However, this analysis would need to be performed in a larger study group than the present study. There were also large variations in breath nitrite levels at baseline in the asthmatic group. This, taken together with no significant differences being observed between groups after ozone exposure, calls into question the validity of nitrite as a marker for airway inflammation.
Our lung function results show significant falls in FEV1 in both normal and asthmatic subjects which were maximal immediately after exposure and recovered over 4–24 hours. These results are in agreement with previous studies which found falls in FEV1 in both normal and asthmatic subjects exposed to the same dose of ozone as used herein, maximal at the end of the period of exposure.14 ,17 ,35
Previous studies have found increases in methacholine reactivity following exposure to ozone in normal36 ,37 and asthmatic subjects.13 ,38 We saw no such changes in the present study in either group of subjects. This discrepancy is likely to be due to the higher doses of ozone used in the above studies compared with our study. A previous study using 200 ppb ozone for four hours, as used here, found no significant change in methacholine reactivity in normal subjects.35
Our study has demonstrated an increase in differential and absolute neutrophil counts in induced sputum following ozone exposure. This finding confirms previous results showing a neutrophil influx in the lung in response to ozone in bronchoalveolar lavage fluid,15 ,17 ,18 ,37 proximal airway lavage,14 and induced sputum samples.16 ,38We also found a decrease in differential macrophage counts, but with no change in absolute numbers. This fall in the proportion of macrophages is accounted for by the increase in absolute numbers of neutrophils.
Cell count data from a number of inadequate sputum samples were excluded from analysis in the present study. Collection of occasional inadequate sputum samples is characteristic of induced sputum studies using the whole sputum processing method, and such samples have been excluded from analysis in previous studies.39 Exclusion is based on the observation that excess squamous cell contamination reduces the accuracy of sputum differential cell counts.40
The present study found an increase in differential neutrophil counts in normal subjects following exposure to air but no effect on absolute neutrophil counts. This effect may be due to the effect of repeated sputum induction, which we have found previously to increase sputum neutrophil differential cell counts.25 ,41 Although the placebo controlled nature of the study helps to counteract this effect, results for neutrophil counts were additionally assessed as the ratio between the change in neutrophils after ozone compared with the change after air to account for any interaction between ozone exposure and sputum induction.
Previous bronchoscopic studies have found increases in a number of inflammatory mediators following exposure to ozone including IL-8,15 ,17-18 ,42 and GM-CSF14 ,17 ,18 in both normal and asthmatic subjects but no change in TNF-α concentrations.15 ,43 We found no increase in GM-CSF or TNF-α following ozone exposure and a non-significant increase in IL-8. Our IL-8 results are in agreement with another induced sputum study which also detected non-significant increases in IL-8 following ozone despite exposure to a higher dose.16 The reason for the discrepancy in GM-CSF results is not clear but may represent methodological differences between bronchoscopy measures and induced sputum.
We found no differences between normal and asthmatic subjects in either their lung function changes or the magnitude of the neutrophil inflammatory response to inhaled ozone. Results from previous studies comparing the responses of asthmatic and non-asthmatic subjects exposed to ozone are conflicting. One study showed greater lung function decrements in asthmatic subjects,13 although several other studies found no differences.15 ,17 ,38 However, the study with a greater lung function response in asthmatics used a higher dose of ozone (400 ppb for two hours) than the dose used here.13 Previous bronchoscopy studies have found a greater neutrophil response in asthmatic subjects than in normal subjects,15 ,17 even with the same exposure protocol as ours.17 However, a previous study using induced sputum to monitor inflammatory cells found no differences between normal and asthmatic subjects, despite using a higher dose of ozone (400 ppb for two hours).38 Whether these differences in neutrophil responses reflect methodological differences between bronchoscopy and induced sputum studies is not clear.
In conclusion, we have shown that exposure to 200 ppb ozone leads to decreases in lung function and a neutrophilic inflammatory response in normal and asthmatic subjects. However, there was no evidence of increased NO production in response to inhaled ozone. Furthermore, we have found higher exhaled levels of NO in asthmatic subjects than in normal subjects but no difference in nitrite concentrations in exhaled breath condensate, which suggests that exhaled NO is a more sensitive marker of asthma.