Article Text

Abstract
BACKGROUND Particulate air pollution has been associated with excess deaths from, and increases in hospital admissions for, cardiovascular disease among older people. A study was undertaken to determine whether this may be a consequence of alterations in the blood, secondary to pulmonary inflammation caused by the action of fine particles on alveolar cells, by repeatedly measuring haematological factors in older people and relating them to measurements of exposure to airborne particles.
METHODS One hundred and twelve individuals aged 60+ years in two UK cities provided repeated blood samples over 18 months, 108 providing the maximum of 12 samples. Estimates of individual exposure to particles of less than 10 μm diameter (PM10), derived from a mathematical model based on activity diaries and comparative measurements of PM10 at multiple sites and during a variety of activities, were made for each three day period prior to blood sampling. The relationships between blood values and estimates of both personal exposure and city centre measurements of PM10 were investigated by analysis of covariance, adjusting for city, season, temperature, and repeated individual measurements.
RESULTS Estimated personal exposure to PM10 over the previous three days showed negative correlations with haemoglobin concentration, packed cell volume (PCV), and red blood cell count (p<0.001), and with platelets and factor VII levels (p<0.05). The changes in red cell indices persisted after adjustment for plasma albumin in a sample of 60 of the subjects. City centre PM10 measurements over three days also showed negative correlations with haemoglobin and red cell count (p<0.001) and with PCV and fibrinogen (p<0.05), the relationship with haemoglobin persisting after adjustment for albumin. C reactive protein levels showed a positive association with city centre measurements of PM10 (p<0.01). Based on a linear relationship, the estimated change in haemoglobin associated with an alteration in particle concentration of 100 μg/m3 is estimated to have been 0.44 g/dl (95% CI 0.62 to 0.26) for personal PM10 and 0.73 g/dl (95% CI 1.11 to 0.36) for city centre PM10 measurements.
CONCLUSIONS This investigation is the first to estimate personal exposures to PM10 and to demonstrate associations between haematological indices and air pollution. The changes in haemoglobin adjusted for albumin suggest that inhalation of some component of PM10may cause sequestration of red cells in the circulation. We propose that an action of such particles either on lung endothelial cells or on erythrocytes themselves may be responsible for changing red cell adhesiveness. Peripheral sequestration of red cells offers an explanation for the observed cardiovascular effects of particulate air pollution.
- air pollution
- erythrocytes
- haemoglobin
- blood coagulation
- geriatrics
- cardiovascular disease
Statistics from Altmetric.com
Since the London smogs of the 1950s it has been recognised that episodes of air pollution are associated with excess numbers of deaths among older people. Recent investigations in the USA and Europe have shown that these associations persist even at the lower concentrations of air pollution occurring in Western cities today.1-3The greatest increase in risk appears to be of death from respiratory disease, but the largest numbers of deaths occur from heart disease4 and it has been shown that admission to hospital for cardiovascular disease also relates to air pollution.5Our recent study in Edinburgh, a city with relatively low levels of pollution, has shown an increment of 10 μg/m3 in particles of less than 10 μm diameter (PM10) to have been associated with an increase in emergency cardiovascular admissions in the elderly of 4.8% (95% CI 0.9 to 8.9).6
Although these associations are consistent across many studies, there has been much debate about their biological plausibility with suggestions that the effect is a consequence of some confounding factor such as change in temperature. However, the statistical models used have generally adjusted appropriately for this.1 There is a consensus that those who die in such episodes are likely to be individuals already at risk because of serious heart or lung disease, but the mechanisms triggering the final episode have not been apparent. We have suggested that the basis of the observed associations may be pulmonary inflammation caused by ultrafine (<100 nm) particles deposited in the alveoli leading to increased blood coagulability, possibly by causing activation of the clotting cascade and thus promoting myocardial infarction in those at risk.7 This hypothesis was based on observations that blood fibrinogen and factor VII levels show seasonal variations in older people which are related to temperature but are otherwise unexplained,8 ,9 and that nanometer sized particles cause pulmonary inflammation in rats whereas larger particles of the same materials do not.10
Support for parts of this hypothesis has come from experimental studies which have shown urban PM10 to release free radicals and ultrafine carbon particles to be capable of causing lung inflammation at low concentrations.11 ,12 In addition, blood viscosity was shown to be higher in individuals during an air pollution episode in central Europe than at other times,13 although it is not certain that this study adjusted adequately for the considerable fall in temperature at the time. We have now tested the hypothesis by measuring exposures to particles in older individuals over time and relating these to haematological and coagulation factors.
Methods
SUBJECTS
After full explanation and with the approval of the relevant ethical committees, 112 subjects aged over 60 years in Belfast and Edinburgh volunteered to participate. The cities were chosen because of contrasting pollution patterns and well established systems for measuring particles. Subjects were chosen from general practice lists on the basis of a representative distribution around the cities. None was a current smoker and all were fully mobile. Other than those on treatment for cardiac disease, no exclusions on the basis of specific illness were made.
STUDY PROTOCOL
A morning blood sample was taken every 4–6 weeks for 12–18 months between 1 November 1996 and 30 April 1998. Each subject completed a detailed activity diary for three days prior to the blood sampling; this also included information on intercurrent illness and passive exposure to cigarette smoke.
AIR POLLUTION MEASUREMENT
The measurement metric used to characterise exposure in this study was the mass of particles less than 10 μm aerodynamic diameter (PM10). We used PM10 levels obtained from the UK Department of the Environment, Transport and the Regions’ fixed site samplers in each city, measured by tapered element oscillating microbalance (TEOM), assuming these to represent the exposures of all individuals in the study in that city over the relevant period. In addition, for each individual we calculated a personal index of exposure to PM10 over the three days prior to each blood sampling. The method is outlined below. In order to validate the personal exposure indices a direct 24 hour average measurement of personal exposure was made using a personal PM10 sampler developed by the Edinburgh Institute of Occupational Medicine (IOM) in each individual on at least one occasion. The performance of the IOM personal sampler was in turn validated against the TEOM in each city by multiple side-by-side measurements.14 Personal exposure indices were estimated from a mathematical model based upon activity diaries kept by the subjects over the three days prior to blood sampling. The model was defined as:
E = Eout + Ein home + Etransp + Eother in
where E = personal exposure (μg/m3 over 24 hours), Eout = exposure out of doors, Ein home= exposure in the subject’s own home, Etransp = exposure while in transport, and Eother in = exposure in an indoor environment other than the home. Each of these exposures was partly based on the average TEOM PM10 measurement and the proportion of time spent in the microenvironment, and was itself built up from formulae taking account of, for example, fraction of time in various activities, distance from sources, and likely particle penetration factors into buildings. Weightings were allocated to different parts of the city, to different activities, and to different forms and times of transport. Records of TEOM PM10measurements, the individual’s presence in or out of doors, proximity to local sources of particles such as traffic and cigarette smoke, and type of activity formed important components of the model. Multiple measurements of specific microenvironments, such as in homes, public transport and different parts of the cities, were made with a Model 8520 Dustrak aerosol monitor (TSI Inc, St Paul, Minnesota, USA) in order to assess the relative contributions of these environments to total exposure. Full details of this model, in a report to the UK Department of Health, are available from the authors upon request. As indicated above, the model was validated by comparison with direct 24 hour personal measurements in each individual.
BLOOD MEASUREMENTS
Haemoglobin concentration, packed cell volume (PCV), and blood counts were measured within a day of sampling using a Coulter STKS haemocytometer in Belfast and a Sysmex NE8000 analyser in Edinburgh. Levels of fibrinogen (Clauss method), factor VII (one stage clotting assay), and interleukin (IL)-6 (immunoassay, R&D Systems, UK) were measured in Belfast in a large batch at the end of the study (to avoid assay drift) on plasma which had been stored at –70°C. All 12 measurements on each individual subject were always analysed on the same day. Levels of C reactive protein (CRP) were measured in Belfast by rate nephelometry and in Edinburgh (from May 1997 to April 1998) by a fluorescence competitive binding immunoassay. Adjustment for these different methods was made in the statistical analysis. In a sample of all 12 blood specimens from each of 60 subjects drawn equally from both cities, plasma albumin was measured in one batch in Belfast.
STATISTICAL METHODS
The relationships between each of the blood measurements and both estimated personal and ambient three day PM10 exposures were investigated using a general mixed model analysis of covariance by the BMDP procedure 3V. Seasonal variation was assumed to follow a sinusoidal curve with a period of one year. The model, expressed as: measurement value = a + b1.sin (2πt/365) + b2.cos (2πt/365) + b3.min temp + b4.min temp2 + b5.PM10+ b6.city + random effect for subject + error factor, where t = day after start of study, took account of the fact that there were repeated measurements on each subject and also adjusted for minimum temperature and individual city effects. Logarithmic transformations were applied to white cell count, fibrinogen, IL-6, factor VII, and CRP prior to analysis since these were highly skewed. The significance of any associations observed was tested by the χ2 test. To investigate the shape of the relationships between PM10 and blood measurements exploratory quadratic regressions were carried out for TEOM PM10 measurements over the previous three days, but no evidence of significant non-linearity was found. We therefore report the results of linear regressions.
Results
One hundred and twelve subjects provided detailed diary information and at least seven blood samples, but four withdrew because of serious intercurrent illness leaving 108 (51 in Belfast and 57 in Edinburgh) to complete 12 samples. All results from the original 112 were used in the analyses. Their mean (SD) ages were 70.4 (6.45) in Belfast and 68.2 (5.5) in Edinburgh. Typically, subjects spent 90% of their time indoors, over 70% in their own homes.
In 45 side-by-side studies the IOM personal sampler showed a good relationship with TEOM measurements of PM10(PM10 = 1.5 × TEOM + 5.9,r 2 = 0.88, p<0.001).14 However, the direct measurements of individual exposures to PM10 correlated only weakly and not significantly with the TEOM measurements, personal PM10measurements showing a wide range of exposures with geometric mean (SD) values of 42 (2.0) μg/m3 (range 8–288) in Belfast and 57 (1.78) μg/m3 (range 23–418) in Edinburgh. They were heavily influenced by individual activity patterns such as the time spent indoors and carrying out housework and gardening.
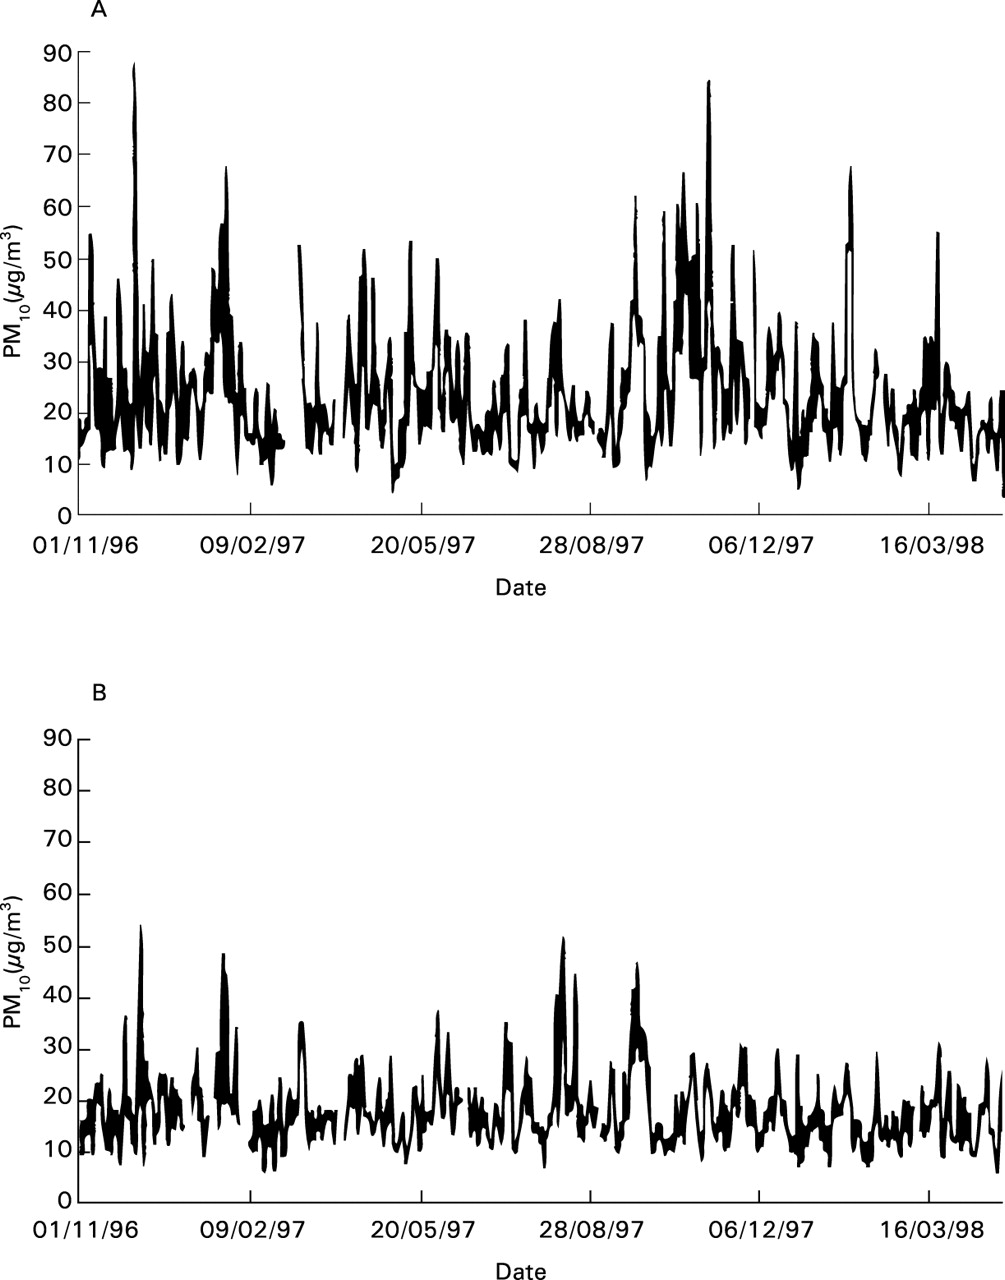
Over the study period TEOM measurements of PM10 averaged 24 μg/m3 from October to March and 21 μg/m3 from April to September in Belfast and 16 μg/m3 and 18 μg/m3, respectively, in Edinburgh. The variations in TEOM measurements in the cities are shown in fig 1. The personal exposure estimates derived from the model were validated against measured personal PM10 exposures by 111 parallel measurements in 109 individuals. The correlation between the two was 0.40 (Spearman’s rank, p<0.001).
Continuous recordings of PM10 in (A) Belfast and (B) Edinburgh over the period of the study.
The results of the analysis of relationships between PM10and blood measurements are shown in table 1. Highly significant negative relationships between three day mean personal exposure estimates and haemoglobin, PCV, and red cell count are apparent, as also are significant negative relationships with platelets and factor VII. TEOM measurements of PM10 also showed significant negative relationships with haemoglobin, PCV, red cell count and fibrinogen, and a positive relationship with CRP. No relationships with IL-6 or white cell count were found. Very similar relationships with blood counts were found using one and two day lags (data not shown). No significant associations occurred between concentrations of fibrinogen and factor VII and TEOM measurements of PM10 when a longer time lag of 7–10 days was investigated. No comparable personal PM10 estimates were, of course, available for this analysis.
Results of mixed model analysis of covariance relating blood measurements to estimated individual exposures and city centre measurements on previous three days expressed as change per 100 μg/m3rise in mean daily PM10
Further analyses were carried out on a sample of 60 subjects drawn equally from the two cities, adjusting the haematological variables for plasma albumin concentrations (table 2). Overall, the same relationships between the blood variables and PM10 were found in this smaller subgroup as in the whole population. The adjustment for albumin did not alter the relationships, albumin itself showing a weakly significant negative association with personal exposure (p = 0.047) but none with TEOM measurements.
Change in blood variables (with 95% CI) in relation to a 100 μg/m3 increase in mean daily PM10 over three days in a sample of 60 subjects, before and after adjusting for plasma albumin
All the above analyses were repeated for each city independently. The associations were present and in the same direction in both Belfast and Edinburgh, but at a lower level of statistical significance owing to smaller numbers of observations.
Discussion
This study was designed specifically to investigate the hypothesis that particulate air pollution leads to changes in blood coagulability as a consequence of alterations in clotting factors such as fibrinogen.7 It is the first epidemiological study both to have made estimates of individual exposures to PM10 and also to have used them to investigate possible links between air pollution and changes in the blood in vulnerable people that might explain increased cardiovascular mortality. Our original observations, which were unexpected, merit some discussion.
Previous epidemiological studies of the effects of air pollution on populations have relied upon measurements of pollution made at a central point to represent the exposures of all individuals in the study. It is, of course, inherently unlikely in the case of particles that exposures are in fact evenly distributed, and we have shown this to be the case, finding that personal measurements of PM10bore little relationship to those made concurrently at the TEOM site. It seems likely that this is so because individuals in their daily activity resuspend larger particles (in the range 1–10 μm, the personal cloud) which are disproportionately influential when particles are measured by mass as PM10. Thus, we believe that direct personal measurement of PM10 is unlikely to be a useful metric in environmental epidemiology, unless these larger particles are themselves toxic.
Nevertheless, many studies have shown relationships between TEOM measurements of PM10 and adverse health outcomes, and we have found convincing associations between our estimates of personal PM10 exposure and blood measurements. Why should this be? With respect to TEOM measurements, these are likely to be uninfluenced by any personal cloud since they measure background concentrations of particles. Our personal exposure estimates may similarly underestimate the personal cloud effect and it is interesting that, while they themselves were not highly correlated, both personal exposure estimates and TEOM measurements independently correlated with the blood measurements. Further studies of personal exposure to smaller gravimetric fractions such as PM2.5 and PM1 and to particle numbers will be of considerable help in understanding where the toxic fraction of particles lies.
An association between haemoglobin and air pollution had neither been demonstrated previously nor, indeed, been anticipated. Previous small studies have shown very variable associations between red blood cell measurements and season.15-17 One study of 18 elderly people has suggested that haemoconcentration may occur in the winter months,18 but other studies have shown inconsistent changes. There is no reason to suppose that season itself rather than something such as temperature or pollution associated with it is responsible. Vigorous physical exercise may also be associated with changes in blood volume, depending upon the posture in which exercise takes place. Experimental studies have shown that the interrelations of exercise, ambient temperature, and blood volume are complex and depend on the change in temperature, the absolute level, and the time from start of exposure.19 In our study careful adjustment for temperature in the relatively small range encountered makes this a very unlikely explanation for the association we observed, while the degree of exercise engaged in by our elderly subjects would in no case have been regarded as intensive. Exercise could not, of course, be responsible for the associations between city centre TEOM measurements of PM10 and blood count.
Our study took place over an 18 month period of unusually stable weather in the two cities during which no central 24 hour measurements of PM10 exceeded 90 μg/m3. This makes it the more remarkable that such changes in measurements of red blood cells in relation to air pollution were demonstrable. We suggest that the effects that we have observed are most likely to be due to particulate air pollution or some confounding factor very closely associated with it. With respect to this, we have been unable to find significant relationships between personal PM10 exposures, city centre carbon monoxide concentrations, and the blood carboxyhaemoglobin concentrations which we measured in 85 of our subjects over six months of the study.
If this association is indeed causal, an explanation is required. Two plausible alternatives are haemodilution due to influx of fluid into the circulation or sequestration of red cells in peripheral vessels. In order to differentiate the two we have been able to correct for albumin concentrations in over half of our subjects on the assumption that albumin would have fallen similarly if haemodilution were responsible. Our findings thus suggest that sequestration is the more likely explanation.
Our original hypothesis relating particulate air pollution to cardiovascular illness and death invoked pulmonary inflammation as a cause of increases in fibrinogen concentrations leading to increases in coagulability of the blood.7 Our results do not support the concept of increased fibrinogen concentrations, at least at pollution levels as low as those we experienced. It does remain possible that much higher concentrations such as those experienced in central Europe may have had such an effect,13 and further studies supporting the one that has suggested this are awaited. There may, however, be an analogous explanation for the cardiovascular effects of particulate pollution which is consistent with our findings. The rise in CRP levels in association with TEOM PM10measurements suggests an inflammatory process (although apparently one not involving a rise in white cell count), and we have been able to exclude the possibility of clinical infection as a cause of this from our subjects’ diaries. The falls in haemoglobin (which, on the assumption that the relationship is linear, would represent about 3% of the circulating haemoglobin in a 100 μg/m3 pollution episode) and in platelet count probably indicate sequestration of red cells in capillaries.
A possible explanation suggests itself. It has recently been recognised that adherence of red cells to endothelium occurs in vascular complications of certain diseases such as falciparium malaria, sickle cell disease, and diabetes.20 Mature red cells express adhesion molecules including Lutheran blood group glycoproteins and CD36,21 ,22 and altered erythrocytes are capable of reacting with endothelial cell adhesion molecules including ICAM-1.23 It is also known that nanometer sized particles readily penetrate the alveolar epithelium12 and recent work has shown that experimental inhalation of diesel particles may upregulate expression of adhesion molecules on capillary endothelial cells in association with alveolar inflammation.24 We suggest that the action of such particles on pulmonary endothelium is capable of altering the adhesive properties of passing red cells, making them more liable to adhere to systemic capillaries. The falls we have observed in platelets and fibrinogen may indicate an early consumption coagulopathy secondary to this, thus leading to increased risk of ischaemic damage in individuals with vulnerable coronary circulations during episodes of air pollution. Experimental and epidemiological studies might now seek evidence of red cell adhesion molecule expression, of adhesion of red cells to cultured endothelial cells, and of thrombus generation or coagulation activation in response to challenge with particles of different size fractions.
Acknowledgments
This research was funded by a grant from the United Kingdom Department of Health. Data were collected by Eilish Armstrong, Hazel Johnston, Deirdre McBride and Pat Ross, research nurses. We are grateful to Professor Michael Greaves for his helpful comments, to the general practitioners who allowed us to study their patients and, especially, to our subjects for their willing co-operation.