Article Text

Abstract
BACKGROUND The functional residual capacity (FRC), the only lung volume to be routinely measured in infants, is an unreliable volume landmark. In addition to FRC, the residual volume (RV) was measured by nitrogen washout using rapid thoracoabdominal compression (RTC) in nine infants with cystic fibrosis aged 5–31 months.
METHODS A commercial system for nitrogen washout to measure lung volumes and a custom made system to perform RTC were used. Lung volume was raised to an airway opening pressure of 30 cm H2O (V30). RTC was performed from V30. The jacket pressure (Pj; 65–92 cm H2O) which generated the highest forced expiratory volume (mean 40.2 ml/kg; 95% confidence interval (CI) 33.03 to 47.33) was used during the RV manoeuvre. The infants were manually hyperventilated to inhibit the respiratory drive briefly. RTC was initiated during the last passive expiration. RV was estimated by measuring the volume of nitrogen expired after end forced expiratory switching of the inspired gas from room air to 100% oxygen while jacket inflation was maintained at the time of switching into oxygen during the post-expiratory pause.
RESULTS In each infant RV and FRC measurements were reproducible and did not overlap; the difference between mean values, which is the expiratory reserve volume, was statistically significant (p<0.05). Mean RV was 21.3 (95% CI 18.7 to 24.0), FRC was 25.5 (95% CI 22.8 to 28.1), and TLC30(total lung capacity at V30) was 61.5 (95% CI 54.4 to 68.7) ml/kg. These values were dependent on body length, weight and age. When measuring RV the period between switching to oxygen and the end of the Pj plateau was 0.301 (95% CI 0.211 to 0.391) s. The washout duration was longer for RV than for FRC measurement (80.9 s (95% CI 71.3 to 90.4) versus 72.4 s (95% CI 64.9 to 79.8)) (p<0.001).
CONCLUSIONS A new non-invasive and reliable technique for routine measurement of RV in infants is presented.
- lung function tests
- cystic fibrosis
- lung volume
- infants
- nitrogen washout
Statistics from Altmetric.com
Objective assessment of lung function has provided valuable insights into the normal process of growth and development of infant lungs and airways. It is also an important component in the diagnosis and management of respiratory diseases and disorders, and is essential to our understanding of their acute or chronic effects and eventually our ability to prevent or minimise these effects.1
The functional residual capacity (FRC)—that is, the volume of air in the lungs and airways at end tidal expiration—is the only lung volume that is routinely measured in infants.1 ,2 In infants FRC is usually dynamically determined, in that they inspire before expiration ends passively.3 FRC is therefore an unreliable volume landmark known to shift with many dynamic events including the airway calibre,4 sleep state,5 ,6 and the addition of dead space.7 Previous measurements of other lung volumes such as the residual volume (RV)—that is, the volume of air remaining in the lung at the end of a forced expiration—and total lung capacity (TLC) either required invasive techniques or had unacceptable reproducibility.1 ,2 We have therefore developed a new technique to measure RV non-invasively by nitrogen washout in infants.
The aim of this study was to investigate the methodological aspects of our new technique and apply it to a group of infants with cystic fibrosis. The basic underlying concept of this investigation was the observation of an inhibition of the infant’s respiratory drive when several rapid lung inflations preceded the performance of rapid thoracoabdominal compression (RTC) from a raised lung volume (RVRTC).8 This brief inhibition not only allowed the forced expiration by RTC to proceed, uninhibited by the infant’s inspiratory effort, to residual volume, but also to be followed by a respiratory pause before the resumption of spontaneous respiration.8 Our working hypothesis was that, by measuring the volume of nitrogen expired after end forced expiratory switching of the inspired gas from room air to 100% oxygen while thoracoabdominal compression was maintained at the time of switching into oxygen during the post-expiratory pause, RV could be reliably estimated. In cystic fibrosis lung disease the small airways are affected at an early stage, resulting in obstructive airflow limitations with consequent overinflation.9 Hence, the measurement of RV is potentially more useful than FRC in investigating early air trapping due to small airway obstruction in cystic fibrosis. The second aim of this study was therefore to ascertain whether, in each infant, RV measurements would be reproducible and consistently lower than FRC.
Methods
SUBJECTS
Nine Caucasian infants and young children (five boys) with a median age of 12 months (range 5–31 months) with cystic fibrosis who regularly attended the outpatient clinic of our hospital were tested during their routine infant lung function testing. Patients were excluded from testing if they were clinically unstable, had a significant upper airway obstruction, or a recent thoracic or abdominal surgical procedure. The median weight was 9.1 kg (range 5.8–13.7) and median length was 72.0 cm (range 63.5–93.5). The characteristics of the patients are presented in table 1. Feeds were withheld and sleep deprivation was encouraged for three hours before the patient was to be sedated. Parents were instructed to feed their baby just prior to this three hour period. Patients were sedated with 80–100 mg/kg chloral hydrate orally. A maximum dose of 1 g was not exceeded. One toddler did not sleep within 20 minutes after the maximum drug dose had been administered and another had a history of not being sedated with chloral hydrate; they received, in addition, oral hydroxyzine,11 0.25 and 0.5 mg/kg, respectively. After the full sedative dose was administered, a hungry infant was allowed to suck a few times on a bottle containing apple juice. The Infant Pulmonary Function Laboratory sedation policy and precautions were adopted. Patients were continuously monitored during the entire study with a pulse oximeter (Nellcor Inc, Pleasenton, California, USA). The ethics committee of the institution approved the testing protocol. Informed written parental consent was obtained for each infant prior to testing and parents were present during the tests.
Data of study subjects
TESTING PROTOCOL
Once asleep, the infant was placed supine on the testing table with the head tilted back gently into a “sniffing” (neutral) position. RVRTC manoeuvres were performed from V30—that is, a raised lung volume to a predetermined airway pressure (Pao) of 30 cm H2O. Increasing jacket pressures (Pj) were used until the largest FVC, defined as the forced expiratory volume between V30 and RV, was obtained as indicated by a decline or a plateau in FVC with a further increase in Pj. The Pj that generated the highest FVC was used during the RV measurement. In addition, in four subjects a Pj 10 cm H2O higher was used once to find out whether further chest compression could have generated a smaller RV. RV and FRC measurements were performed at random. A period of at least twice the washout time was allowed between measurements.
The infants were weighed with a balance (Detecto, Webb City, Missouri, USA) before the chloral hydrate was given and the weight rounded to the nearest 20 g; the balance was checked for accuracy before each patient test. Two trained adults performed the stature measurement after the lung function test had been completed. We used a custom made stadiometer which had two steel rulers each 91.5 cm long (Macklanburg-Duncan, Oklahoma City, Oklahoma, USA). They were mounted on the bottom and sideboards, exactly 20 cm from the headboard. Repeat measurements within 0.5 cm of each other were obtained. Measurements of length were made to the nearest millimetre.12
EQUIPMENT
A commercial system, the Pediatric Pulmonary Unit (PPU) 2600 (SensorMedics, Anaheim, California, USA) was used to measure RV and FRC by nitrogen washout. A custom made computer controlled system (CCCS) was used to perform RVRTC. It was also used to adapt the PPU for measuring FRC and RV in several ways: (1) to introduce the pneumotachometer into the circuit while the infant was breathing room air in order to compensate for switching-errors above end tidal expiration when FRC was measured13; (2) to display signals (flow (V′), Pao, Pj and flow-volume loops) in real time on a 21 inch computer monitor screen to enable the operator to perform sequential activations of the jacket inflation and slide valve in a timely fashion during RV measurement; and (3) to perform RTC for RV measurement.
CCCS FOR RVRTC
The system has been described previously.14 The compression jacket consisted of an inflatable plastic plate held over the chest and abdomen with a firm vinyl outer layer. RTC was performed with the arms outside the jacket to avoid possible splinting of the chest wall.15 The firm vinyl outer layer (Herculite 80, Vicar International, New Jersey, USA) was modified for the present study by inserting a 14 inch zipper (“Separating Sport Zipper”; Coats and Clark, Greenville, South Carolina, USA) so that the firm outer layer could be loosened during FRC measurement with minimal disturbance to the sleeping infant to avoid any possible limitation to chest wall excursions during tidal breathing. Tensile resistance was maximised by covering the zipper with a strip of the firm vinyl on each side of the zipper teeth. With the zipper sandwiched between the vinyl strips and firm outer layer, it was further anchored to the outer layer by stitching through the strips, zipper, and vinyl outer layer. Furthermore, the zipper extended 5 cm beyond the upper and lower edges of the firm vinyl outer layer to ensure that a uniform tension extended to the very edge of the outer layer. In pilot studies a Pj plateau was attained in less than 0.1 seconds and comparable flow-volume curves were obtained using a firm vinyl outer layer with and without a zipper in the same subject (M G Morris, personal observations). The inflatable plastic plate was connected to a large plastic reservoir (15 gallons, Tight Head Drum, Basco Co, University Park, Illinois, USA) via a series of large bore (>2.5 cm) solenoid valves and tubing.
A soft plastic air cushion mask (Kings Systems, Noblesville, Indiana, USA) was held on the mouth and nose forming an airtight seal. The mask connection port had a 10 mm inner diameter (ID) that was cut out and replaced with a 22 mm ID connection. Airway opening pressure (Pao) was measured with a pressure transducer (FPM-02PG; Fujikura, Tokyo, Japan) from a port mounted into the dome of the mask. One end of a heated 0–160 l/min screen pneumotachometer (Hans Rudolph Inc, Kansas City, Missouri, USA) was connected to the mask port and the other was connected to a one way balloon valve (Model 9340, Hans Rudolph Inc). The latter, in turn, was connected to a series of solenoid valves that allowed for inflation of the infant’s lungs to a predetermined Pao of 30 cm H2O (V30) by means of a fan pump (Inflate-all; Coleman Co Inc, Wichita, KS, USA). The inflatable jacket was then pressurised and forced expiration proceeded from V30 to RV. The sequence of valves was controlled by BRATLAB software (RHT-INFODAT, Montreal, Quebec, Canada) on a computer. This integrated software sensed Pao, halted inflation, and initiated expiration. The differential pressure across the pneumotachometer was measured with a 0–7 cm H2O differential pressure transducer (PX170–07DV; Omega International Corp, Stamford, Connecticut, USA) and amplified (SC14C; RHT-INFODAT, Montreal, Canada) in order to measure flow. Flow was integrated to produce volume. All signals were collected and analysed on a computer with LABDAT-ANADAT 5.2 data acquisition and analysis software (RHT-INFODAT).
A Y adapter with a central mount (Bird Products Corporation, Palm Springs, California, USA; fig 1) was used to hyperventilate the infant with several rapid inflations prior to RVRTC. It was transformed into a four way (limbs) connection by rupturing the base inside the central mount. One limb (22 mm ID) was connected to the distal end of the one way balloon valve. A calibrated pressure relief valve (Newport Medical Instruments Inc, Newport Beach, California) that limited maximal pressure to 30 cm H2O was embedded in the second limb (22 mm ID). The third limb (15 mm ID) was connected to a constant airflow of 15 l/min. Occlusion of the fourth (expiratory) limb (17 mm ID) diverted the airflow to the infant via the balloon valve and pneumotachometer causing lung inflation. Prior to RVRTC, several rapid inflations were delivered to the infant lungs by occluding the expiratory limb of the Y adapter until the infant’s respiratory drive was inhibited. The fan pump was then activated to deliver the last inflation to the infant via the pneumotachometer and face mask to a predetermined Pao of 30 cm H2O, the airway was then occluded for 0.05 s by inflating the balloon, and the jacket was rapidly inflated while the airway remained closed. A second plateau occurred in Pao, 18–20 cm H2O above the predetermined Pao. Once the airway was opened, forced expiration proceeded from V30 to RV. Jacket pressures were started at 50 cm H2O and increased by 10 cm H2O until no further increase in FVC was observed. Pj was measured with a pressure transducer (FPM-02PG). The Pj that generated the highest FVC was used during the RV manoeuvre (see below). At least two highest FVC measurements within 10% were obtained.

The nitrogen washout circuit. The long parallel dotted lines point to the connection site of the central port of the aerosol “T” adapter which carries the fixed 10 l/min bias flow of oxygen into the inlet/outlet port of the slide valve. When measuring the residual volume (RV) the Y adapter is connected to the pneumotachometer. Occlusion of the expiratory limb of the Y adapter diverts the air to the infant, raising the lung volume to an airway opening pressure plateau set at 30 cm H2O by the pressure relief valve. Side views of the circuit depict the path (arrows interconnected by a dotted line) of air (A) and, after activating the slide valve, of oxygen (B) in and out of the of the infant’s airway. Note that after the slide valve switches the infant into oxygen, he/she no longer breathes through the pneumotachometer.
Calibration of the pneumotachometer was performed with a high precision calibrating flowmeter with high resolution valves (Gilmont Instruments, Barrington, Illinois, USA). Calibration was rechecked by injecting and withdrawing known air volumes (100, 200, 300 and 500 ml) from a calibrating syringe and integrating the flow signal to produce volume. The latter differed by less than 0.5% from the known volume. The airway opening pressure transducer was calibrated with a U-shaped water manometer (range 0–60 cm H2O; Dwyer Instruments Inc, Michigan City, Indiana, USA) and the jackets with a diaphragm operated differential pressure manometer (Magnehelic, range 0–150 cm H2O; Dwyer Instruments Inc).
NITROGEN WASHOUT TECHNIQUE
The methodological aspects of the validated technique used, the accuracy of which had been improved by the author, have been described elsewhere.16 Using a fixed background flow of oxygen of 10 l/min and a 0.5 litre calibrating syringe (Hans Rudolph Inc), a two point calibration with 42 ml and 342 ml of air was used for all patient tests.
Volume was corrected for the effective dead space of the face mask and the slide valve port10 and converted to BTPS. The latent period before the rise above baseline of the nitrogen washout curve and the duration of the washout were recorded.
Ambient room temperature and relative humidity were measured with a certified hygrometer and temperature indicator (Abbeon Cal Inc, Santa Barbara, California, USA) and daily barometric pressure readings were obtained with a mercury manometer (Princo, Southampton, California, USA).
MEASUREMENT OF FUNCTIONAL RESIDUAL CAPACITY (FRC)
The PPU was adapted by connecting the pneumotachometer of the CCCS to the 22 mm ID end of a plastic adapter (Baxter Healthcare Corporation), the other end of which (15 mm ID) was fitted onto one of the two small ports of the three way slide valve (fig 1). Prior to FRC measurement, the firm vinyl outer layer was unzipped to avoid any splinting of the chest during tidal breathing. The mouth port of the slide valve was connected to a size 1 transparent face mask (Rendell-Baker Soucek pediatric face mask; Gary Hull Anesthesia, Huntington Beach, California, USA) which was held onto the infant’s face with silicone putty (Theraputty; North Coast Medical Inc, San Jose, California, USA) and an airtight seal was achieved. With the infant breathing room air, flow-volume loops were displayed in real time on the computer monitor of the CCCS. After observing a stable tidal breathing, the slide valve was activated as close to end of expiration as possible. After the nitrogen washout had been completed the slide valve was activated and the infant was switched back to breathing room air. Each integrated nitrogen signal and the corresponding calculated volume was recorded. The slide valve assembly was removed from the infant’s face in between measurements. Flow was integrated to produce volume. The FRC was corrected for any volume above exact end tidal expiration when switching the slide valve. At least two FRC measurements within 10% were obtained.
MEASUREMENT OF RESIDUAL VOLUME (RV)
The Y adapter described above was connected to the pneumotachometer/slide valve assembly to perform rapid lung inflations (fig 1). Airway opening pressure (Pao) was measured with a pressure transducer (FPM-02PG) from a port mounted onto the dome of the clear mask. Signals (V′, Pao and Pj) displayed in real time on the CCCS computer monitor screen were collected and analysed on a computer with LABDAT-ANADAT 5.2 data acquisition and analysis software (RHT-INFODAT).
The slide valve assembly was connected to the clear face mask which was kept on the infant’s face with an airtight seal by means of the silicone putty. The RV measurement was performed by one operator. Several rapid inflations were delivered to the infant lungs by occluding the expiratory limb of the Y connection until the infant’s respiratory drive was inhibited (fig 1(A)). After the last inflation the flow limb of the flow-volume loop signal was watched closely on the monitor screen. Expiration was allowed to proceed passively at first, then jacket inflation was activated during the last portion of exhalation to induce a forced expiration (fig 4). Once jacket inflation was triggered, the Pj signal was instantaneously observed. The slide valve was activated, switching the infant to breathing 100% oxygen (fig 1(B)) before the decline of the Pj plateau which coincided with maximum chest compression. The total duration of jacket inflation was set for three seconds. When a 0% nitrogen concentration was displayed on the PPU monitor, the slide valve was activated and the infant was switched back to breathing room air. Three criteria were set for an acceptable RV measurement: when the slide valve was switched (1) flow (V′) and (2) pressure (Pao) at the airway opening had been zero while a maximal chest compression was maintained as indicated by (3) a raised jacket pressure (Pj) plateau. The period between the activation of the slide valve and the end of the Pj plateau was estimated for each RV measurement (see Results below). At least two RV measurements within 10% of each other were obtained.
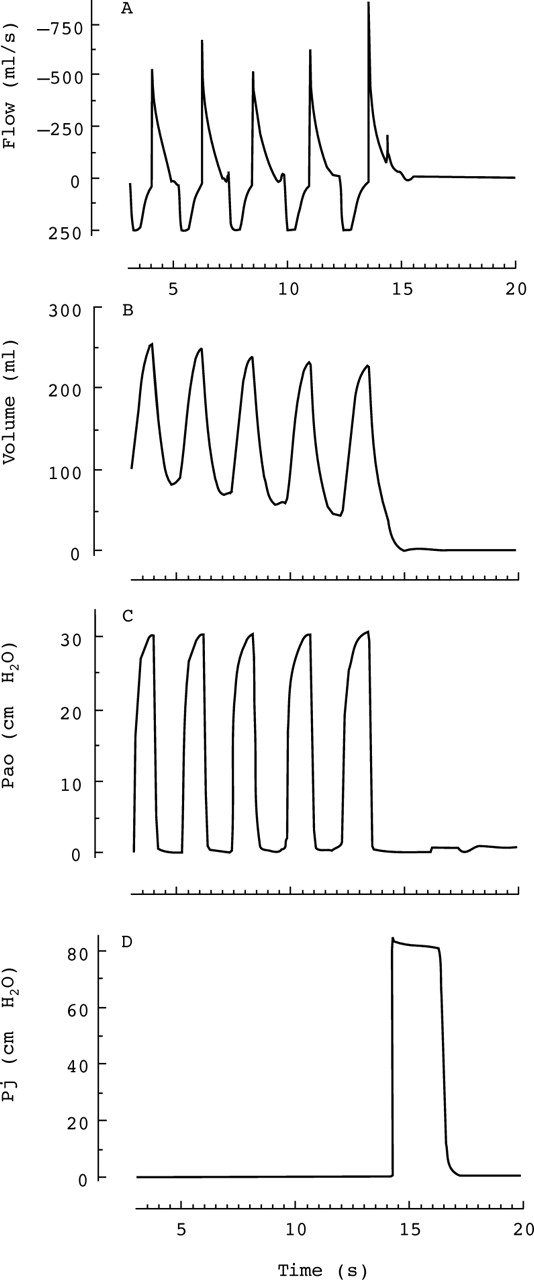
Measurement of residual volume (RV). An example trace of flow, volume, airway opening pressure (Pao), and jacket pressure (Pj) from infant no. 6. In this figure inspiration is positive and expiration is negative. The infant is hyperventilated by occluding the expiratory limb of the Y adapter (fig 1A). As the lung volume is raised, Pao rises to a plateau set at 30 cm H2O by the pressure relief valve. Close to the end of the fifth passive expiration the jacket is activated at 14.32 s, generating a positive small sharp peak on the expiratory flow limb which signals the onset of a forced expiratory flow. Note that, at 16 s, flow and Pao are zero but Pj is 82 cm H2O, indicating chest compression (lungs are at RV). A very small upward shift in Pao baseline caused by the slide valve switching the infant into the bias flow of oxygen can be seen at 16.2 s (see also fig 5 for a zoomed view of this trace).
STATISTICAL ANALYSIS
Data were expressed as arithmetic means with 95% confidence intervals (CI). Statistical analysis included the Student’st test of unpaired data to compare mean RV and FRC measurements from each patient. p values of less than 0.05 were regarded as significant. A dot plot showing the raw data of RV, FRC, and FVC obtained from each of the nine subjects was presented.17 A mean value for the total lung capacity at V30 (TLC30) was derived from the sum of mean RV and FVC for each patient. Means from all patients were presented as scatter plots against their respective age, height, and weight measurements.
Results
Corrected for weight, the mean RV was 21.3 ml/kg (95% CI 18.7 to 24.0) and, after correction for switching errors above FRC, the mean FRC was 25.5 ml/kg (95% CI 22.8 to 28.1). In each of the nine infants the difference between the mean FRC and RV was statistically significant (p<0.05). In addition, RV and FRC measurements were reproducible and did not overlap (fig 2). Three separate RV measurements were obtained from each of three infants and only two from each of the other six. In eight infants the first and second RV measurements were within 5%. Six infants had at least two RV measurements that were within 2%. Only one infant had two measurements obtained that were within 10%. Three separate measurements of FRC were obtained from each of four infants, and only two from each of the other five. The first and second FRC measurements were within 10% in each of the nine infants. At least two FRC measurements were within 5% in eight patients (fig 2). Before correction to the end tidal expiratory level, as determined from the flow signal collected on the CCCS computer, FRC was overestimated by as much as 65.5 ml (mean 17.5 ml; 95% CI 8.4 to 26.5). Only in 25% of switches was the error less than 2.0 ml. No more than three tries were needed to obtain at least two RV or FRC measurements that were within 10% in each subject (fig 2). In four subjects an increase in Pj of 10 cm H2O did not produce a lower RV. Means of RV and FRC exhibited body length and weight as well as age dependence (fig3).

A dot plot showing individual residual volume (RV), functional residual capacity (FRC), and forced vital capacity (FVC) measurements obtained from the nine subjects. RV and FRC were corrected for the dead space of the face mask and converted to BTPS. FRC was also corrected for the switching error above FRC. Note the lack of overlap between RV and FRC measurements. Infant no. 3 had two separate RV measurements: 125.5 and 125.6 ml. Infant no. 6 had four FVC measurements: 190.4, 190.9, 193.8 and 194.8 ml. Note that the volumes of FVC and FRC are close to each other in this infant. He had a significant airway obstruction as indicated by a concave flow limb of the flow-volume curve (not shown).
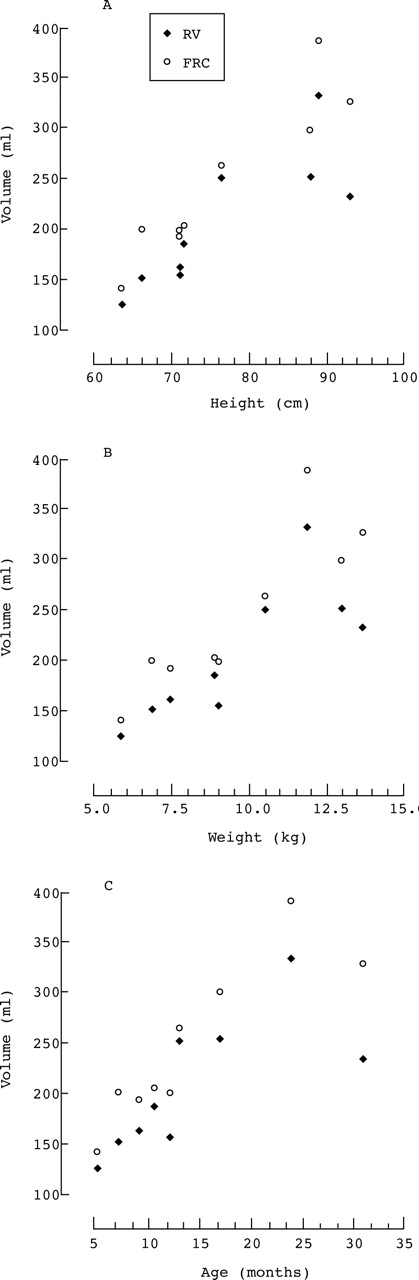
Mean values of residual volume (RV) and functional residual capacity (FRC) from each infant plotted against the respective height (A), weight (B), and age (C).
Confirmation that the lungs were indeed at residual volume when the slide valve switched the infant into pure oxygen was achieved by analysing the signals collected on the CCCS computer. In fig 4 (patient 6), following multiple inflations, the jacket was activated before the end of the fifth passive expiration at 14.320 s. Jacket inflation caused an abrupt increase in airflow (forced expiration) that resulted in a positive sharp small peak on the (passive) expiratory flow trace (see also the zoomed illustration of this period in fig5).

Measurement of the residual volume. These illustrations from patients 2, 7, and 6, respectively, zoom on the time period that begins with jacket inflation and ends at the 20th second of the data collection period. Each includes a trace of flow, volume, airway opening pressure (Pao), and jacket pressure (Pj). In these illustrations inspiration is positive and expiration is negative. Jacket inflation causes a sharp rise in flow (forced expiration) and a simultaneous tiny rise in Pao followed by a rapid return to zero. Note in each Pao tracing the abrupt upward shift in baseline from zero to about 0.65 cm H2O caused by the switching of the infant into the bias flow of oxygen. Note also a zero flow and a raised Pj plateau at the time of the switching. Note that after switching the infant into oxygen he/she no longer breathes through the pneumotachometer. The rapid decline in Pj which signals jacket deflation leads to a synchronous negative deflection in Pao due to the outward springing of the compressed infant’s chest generating this negative airway pressure. Pao then resets and remains at 0.65 cm H2O signalling apnoea (patients 2 and 7). This post-expiratory pause is followed, in patient 7, by a negative deflection (inspiration) in Pao followed by a subsequent rise to 1.35 cm H2O (expiration). No significant post-expiratory pause is observed after jacket deflation in patient 6. The negative Pao of the outward chest recoil is immediately followed by a large negative deflection (inspiration) followed by a rise to 0.78 cm H2O (expiration). Note the return of Pao to 0.65 cm H2O at 19.4 s, indicating the lack of significant chest wall excursions.
For all RV measurements further zooming was performed on the period that began with jacket inflation and ended at the 20th second of the data collection period. This enabled us to establish the three criteria for an acceptable measurement (see above) and determine the exact time of slide valve activation. After activating the slide valve the infant was no longer breathing through the pneumotachometer (fig 1(B)) and the Pao signal provided additional information. In fig 5 (patient 2) V′ and Pao have reached zero at 16.050 s; activation of the slide valve at 16.945 s led to an abrupt upward shift of 0.66 cm H2O over 0.04 s in the baseline Pao. This was due to the infant being switched to the constant bias flow of oxygen which generated this continuous positive Pao of 0.66 cm H2O. Further confirmation was obtained by briefly interrupting the oxygen bias flow which then abolished the positive Pao (data not shown). This positive Pao was observed in every RV measurement in all nine patients. Thus, a time reference point for valve activation could be precisely determined. In patient 2 (fig 5) the period between the activation of the valve at 16.945 s and the end of the Pj plateau (82.4 cm H2O) at 17.250 s was 0.305 s. Jacket deflation which started at 17.250 s led to a synchronous and rapid (over 0.275 s) negative deflection of 0.46 cm H2O in Pao. This was presumably due to the outward springing of the chest wall which was compressed by the jacket causing the airway pressure to become more negative than the ambient pressure within the circuit at the time of measurement, resulting in passive indrawing of gas (oxygen from the bias flow) into the airways of the apnoeic infant. While apnoea continued, the bias flow of oxygen slowly, over 0.70 s, increased Pao back to its 0.66 cm H2O level. The total duration of this negative deflection was 0.975 s. After complete jacket deflation, post-expiratory apnoea lasted at least 2.0 s in this infant (fig 5).
In patient 7 (fig 5) the negative deflection in Pao from the chest wall recoil was followed by apnoea lasting 7.02 s. A small negative deflection of a shallow inspiration starting at 17.82 s was followed by a larger inspiration at 18.675 s. The subsequent overshooting of Pao above baseline was presumably due to a continued expiration into the bias flow of oxygen, raising Pao above baseline. In patient 6 (fig5), no significant post-expiratory pause was seen. The negative deflection of the outward chest recoil was followed by a large negative deflection caused by the patient’s early inspiration that started at 17.45 s with a subsequent overshooting of Pao (expiration). In patient 3 (fig 6) the outward chest recoil induced a small negative deflection in Pao which merged with another more negative deflection of an early inspiration. Progressively larger negative deflections in Pao indicated progressively larger tidal inspirations. This patient had a respiratory rate of 54 breaths/min. Inspiratory efforts were simultaneously confirmed by observing the collapsible breathing bag.

Measurement of residual volume. This illustration includes a trace of Pao and Pj from patient 3. It zooms on the period between the switching into oxygen and ends at the 20th second. At the time of the switching Pao is zero (flow is also zero (not shown)) and Pj is 64.7 cm H2O. Note the lack of a significant post-expiratory pause. The negative deflection in Pao, caused by the outward springing of the chest wall, begins at 14.1 s and merges at 14.3 s with an early more negative deflection (inspiration) followed by increasingly larger negative Pao deflections indicating progressively larger tidal inspirations. This patient had a respiratory rate of 54 breaths/min.
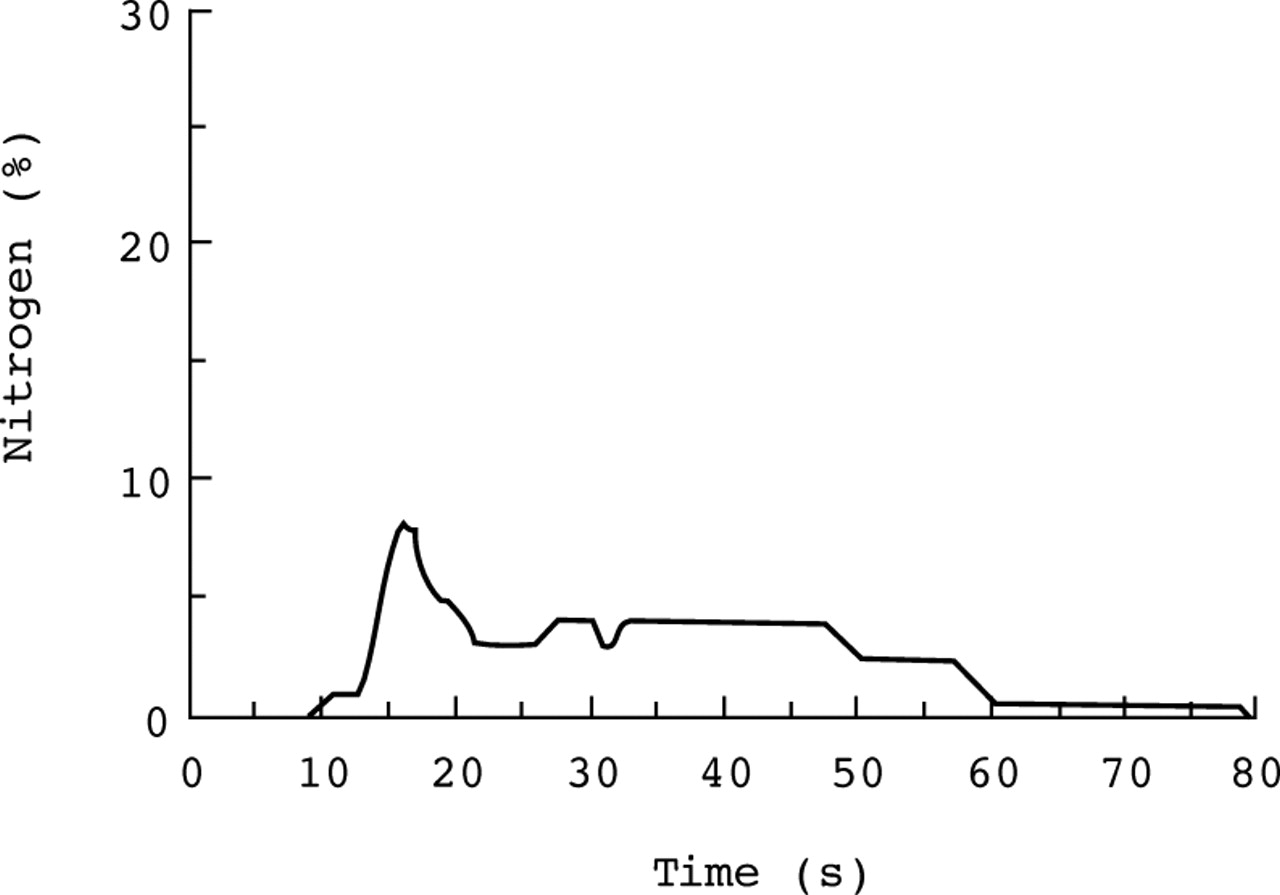
The mean period between the switching to oxygen and the end of the Pj plateau was 0.301 s (95% CI 0.211 to 0.391). Typically, the nitrogen washout curve rose above baseline 10–15 s after the slide valve switched the infant into pure oxygen for RV compared with 1 s for FRC (fig 7). The peak RV and area under the curve (integrated nitrogen signal) were smaller than those of FRC in the same subject. The mean washout duration for RV was longer than for FRC (80.9 s (95% CI 71.3 to 90.4) versus 72.4 s (95% CI 64.9 to 79.8); p<0.001). The intrasubject washout duration was mostly within 10 s.

Nitrogen washout curve of residual volume. Note the curve rises above baseline after a latent period (9 s). The initial peak and the area under the curve are smaller than those of FRC (not shown) in the same subject.
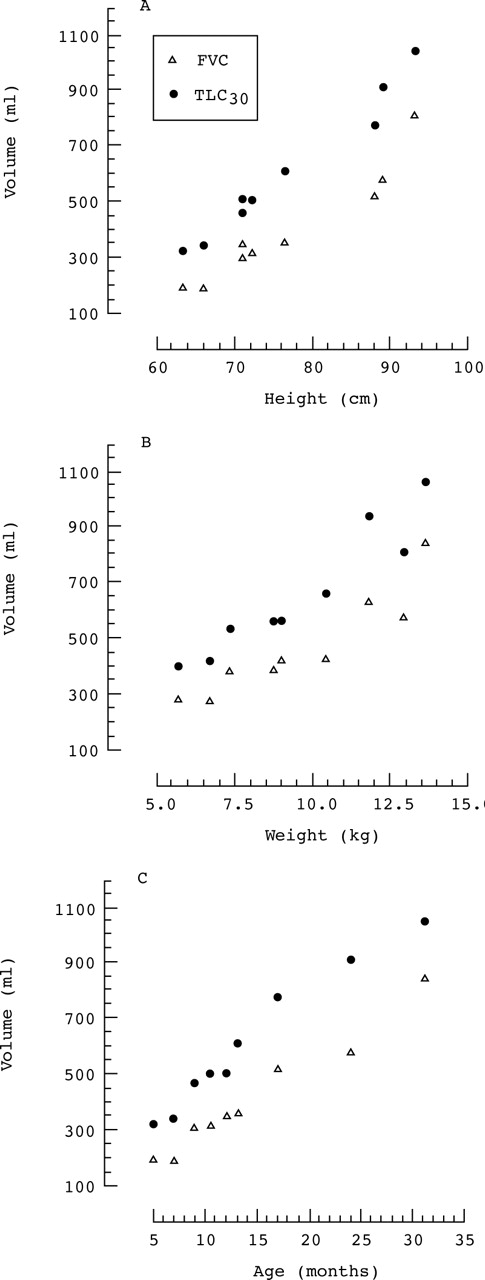
Corrected for weight, the mean FVC was 40.2 ml/kg (95% CI 33.0 to 47.3) and TLC30 was 61.5 ml/kg (95% CI 54.4 to 68.7). FVC and TLC30 exhibited age, height, and weight dependence (fig8).

Mean of forced vital capacity (FVC) and total lung capacity at a raised lung volume to an airway opening pressure of 30 cm H2O (TLC30) from each infant plotted against the respective height (A), weight (B), and age (C).
Discussion
All patients remained clinically stable throughout the study. Using the technique described, in each of the nine infants with cystic fibrosis not only was the mean RV lower than FRC (p<0.05) (fig 3) but RV and FRC measurements also did not overlap (fig 2). RV measurements were very reproducible. After just two attempts RV measurements were within 5% in eight of the infants. In six infants at least two RV measurements were within 2% (fig 2). Compared with FRC, RV therefore appears to be a more reliable measurement of volume. During the brief inhibition of the infant’s respiratory drive, RV was unlikely to be affected by dynamic events such as sleep state,5 ,6 dead space,7 or airway calibre.4 Any measurement of FRC is, however, a measurement of dynamic FRC.2 The mean percentage predicted (FRC in our study was 114 (95% CI 104 to 125) based on a reported prediction equation (FRC (ml) = 0.0036 × length2.531) derived from collated data from healthy children using helium dilution.18
In performing the RV manoeuvre we chose to trigger jacket inflation late in passive expiration, during the brief inhibition of the infant’s respiratory drive, for three reasons: (1) to ensure complete exhalation to residual volume when the slide valve was switched; (2) to allow the operator a reasonable time to react and sequentially activate jacket inflation and the slide valve in a timely fashion; and (3) because activating jacket inflation at a lower lung volume has the theoretical advantage of minimising air trapping so that more reproducible measurements of RV can be obtained. It has been suggested that RV is closer to FRC in infants than in older children1 so we thought that even the induction of a partial forced expiration in these patients, who probably had some small airway disease, might cause early closure of the small airways with increased air trapping and an inability to discriminate between RV and FRC measurements. Clearly, however, this was not the case. Indeed, patient 6 had significant airway obstruction, as indicated by a concave pattern of the flow limb of the flow-volume curve (data not shown), and had the highest percentage predicted FRC (138%).18 In this patient RV measurements remained reproducible and did not overlap with those of FRC (fig 2). Moreover, the two RV measurements were within 5% of each other despite a difference of 15 s between washout times.
A negative deflection in Pao occurred synchronously with jacket deflation. It was observed in every RV measurement in all patients and was ascribed to the outward springing of the chest wall that was compressed by the jacket. It was even noticed in patient 3 who was tachypnoeic and had reproducible RV measurements (fig 6).
A study on 11 healthy infants reported a mean nitrogen washout time of 59 s (range 35–90 s) for FRC.13 However, separate intrasubject FRC measurements with washout times of more than 10 s were excluded. In another study of wheezy infants recovering from bronchiolitis the washout time was shorter at 50 s (range 30–75 s).20 One would expect to find a longer washout time in the presence of airway obstruction because of the slow equilibration of trapped nitrogen rich gas with the pure oxygen, as was the case in our patients with cystic fibrosis (mean 72.4 s; range 49–97 s). Differences might be due to a different underlying disease process (cystic fibrosis versus recovery from bronchiolitis), the subject’s respiratory rate and tidal volume which in turn could be influenced by sedation, or testing conditions such as the background flow of oxygen. It is conceivable that a relatively high flow rate of oxygen could shorten the washout time. A fixed flow rate of 10 l/min was used for all our patients. Indeed, the intrasubject washout time in our study had no influence on the reproducibility of measured washout volumes. It seemed unlikely that washout volumes were overestimated because of additional release of nitrogen from the blood and tissues. We think that RV washout times were longer than FRC washout times because of the induced apnoea and the subsequent resumption of breathing with small tidal volumes (figs 5 and 6). Similarly, the nitrogen washout curve of RV had a smaller peak and area under the curve (integrated nitrogen signal) than that of the FRC because of the initial small tidal volumes following the apnoea and the inherently smaller volume of RV (fig 7).
The adaptations that were introduced into the nitrogen washout technique have increased the reproducibility and precision of measurements. Along with our modifications in the washout circuit, the calibration technique, and the extended equipment warming time,16 the introduction of the pneumotachometer was essential. Without it, not only was switching exactly at end tidal expiration difficult when measuring FRC, but the assessment of any volume above end tidal expiration was also impossible. Similarly, the measurement of RV would have been difficult. The pneumotachometer increased the precision of FRC measurement in two ways: (1) by observing the flow signal in real time on the computer monitor the operator was able to time the switching as close to end tidal expiration as possible (25% of our correction volumes ranged from zero to 2.0 ml); and (2) FRC was corrected for any volume above exact end tidal expiration by analysing the recorded signals on the CCCS computer. The manufacturer of the PPU has introduced an upgraded version of the computer software which includes a pneumotachometer in the circuit, with the purpose of automatically switching the infant into pure oxygen when the pneumotachometer “senses” end tidal expiration. Following a limited use of these modifications it was concluded that there was no improvement in the repeatability of measurements (M G Morris, personal observations).
It has been suggested that the lung volume may be lowered by breathing high oxygen concentrations.21 This was not observed in the present study, where each infant had reproducible RV and FRC measurements, or in a previous study on healthy subjects.13 The waiting periods in between measurements were at least twice the washout time. This seems to have been an adequate period for the initial fractional alveolar nitrogen concentration (0.79) to be restored since RV and FRC were similarly reproducible in those few instances when we had waited longer.
The application of a face mask to the infant’s face may significantly reduce the dead space within the mask.22 The actual combined dead space of a size 1 clear face mask with its connected slide valve mouth port was found to be 23 ml.10 Patient 8 had the smallest effective dead space of 8 ml. The actual combined dead space of the connected ports of the face mask and slide valve was 8 ml. This clearly seemed to be an obligatory dead space because it was unlikely for it to be penetrated by the infant’s nose, lips or cheeks. We think that previously reported dead spaces in the literature were probably underestimated.10
In the present study airway occlusion of 0.05 s was used during the performance of RVRTC to prevent any significant lung volume loss prior to maximal inflation of the jacket. More importantly, it also completely prevented leaks around the mask that occurred with longer occlusions because of increasing pressure in the mask, which was the highest during the occlusion.14 The mean FVC from V30 in our cystic fibrosis patients was 40.2 ml/kg (range 28.3–49.1) which is slightly less than the reported value in the literature of 46.1 ml/kg (range 27.2–61.5) for newborn infants obtained by the forced deflation technique.23 This could be due to the cystic fibrosis in our patients and the pressures used to generate FVC by forced deflation (+40 cm H2O to –40 cm H2O). Using a prediction equation (TLC30 = –278 + 99.8 × weight) derived from a previous study by Thorsteinsson et al 19on intubated patients without an underlying lung disease in whom TLC30 represented the sum of FRC and the inspiratory capacity at a Pao of 30 cm H2O, the mean percentage predicted TLC30 of our infants with cystic fibrosis was 90% (95% CI 81 to 99). However, there were differences in testing conditions in the two studies, such as the use of anaesthesia and muscle paralysis by Thorsteinsson et alcompared with sedation in our study. Since FVC may be smaller than a slow vital capacity in obstructive airway disease, it is possible that a small TLC was obtained in some of our patients because we used FVC.24
RV, FRC, FVC, and TLC30 were all dependent on the age, height, and weight of the patients (figs 3 and 8). A previous study by Beardsmore et al 25 found no correlation between age and thoracic gas volume or maximal expiratory flow at FRC in a group of infants with cystic fibrosis.
In conclusion, we have developed a non-invasive technique that could be used for routine measurement of the RV by nitrogen washout in infants. In all infants tested measurements of RV and FRC were reproducible and did not overlap even in the presence of significant airway obstruction or tachypnoea. Measured variables correlated with the age, height, and weight of the infants. We postulate that, as well as FVC and forced expiratory flows measured by RVRTC, FRC, RV and TLC30measurements and the RV/TLC30 ratio will be useful variables in prospective studies, providing a comprehensive assessment of the infant lung in health and disease.
Acknowledgments
The author wishes to thank the parents of the infants for participating in the study. The expert technical assistance of Sandra E King, RRT, and the engineering expertise of Mr Alfred McGhee at Arkansas Children’s Hospital is acknowledged. This work was supported by a Clinical Research Grant (CG-008-N) co-funded by the American Lung Association (ALA) and the Arkansas Chapter of ALA. M G Morris was supported in part by the Department of Pediatrics, UAMS.