Article Text

Abstract
BACKGROUND The American Thoracic Society (ATS) has set the acceptable resistance for spirometers at less than 1.5 cm H2O/l/s over the flow range 0–14 l/s and for monitoring devices at less than 2.5 cm H2O/l/s (0–14 l/s). The aims of this study were to determine the resistance characteristics of commonly used spirometers and monitoring devices and the effect of resistance on ventilatory function.
METHODS The resistance of five spirometers (Vitalograph wedge bellows, Morgan rolling seal, Stead Wells water sealed, Fleisch pneumotachograph, Lilly pneumotachograph) and three monitoring devices (Spiro 1, Ferraris, mini-Wright) was measured from the back pressure developed over a range of known flows (1.6–13.1 l/s). Peak expiratory flow (PEF), forced expiratory flow in one second (FEV1), forced vital capacity (FVC), and mid forced expiratory flow (FEF25–75%) were measured on six subjects with normal lung function and 13 subjects with respiratory disorders using a pneumotachograph. Ventilatory function was then repeated with four different sized resistors (approximately 1–11 cmH2O/l/s) inserted between the mouthpiece and pneumotachograph.
RESULTS All five diagnostic spirometers and two of the three monitoring devices passed the ATS upper limit for resistance. PEF, FEV1 and FVC showed significant (p<0.05) inverse correlations with added resistance with no significant difference between the normal and patient groups. At a resistance of 1.5 cm H2O/l/s the mean percentage falls (95% confidence interval) were: PEF 6.9% (5.4 to 8.3); FEV1 1.9% (1.0 to 2.8), and FVC 1.5% (0.8 to 2.3).
CONCLUSIONS The ATS resistance specification for diagnostic spirometers appears to be appropriate. However, the specification for monitoring devices may be too conservative. PEF was found to be the most sensitive index to added resistance.
- flow resistance
- instrument resistance
- back pressure
Statistics from Altmetric.com
Although previously published data suggest that the airflow resistance of spirometry circuits affects the measurement of ventilatory function, the magnitude of these effects has not been well defined.1-6 Zwi et al 6 found that the maximum voluntary ventilation fell when artificial flow restrictors were inserted into the breathing circuit, and Robertsonet al 4 reported similar reductions in peak expiratory flow (PEF) and mid expiratory flow (MEF50%), whereas the forced expiratory volume in one second (FEV1) was little affected unless the added restrictor had an orifice of less than about 8 mm.
In 1979 a policy statement on spirometry from the American Thoracic Society (ATS) recommended that the upper limit for acceptable spirometer resistance should be 1.5 cm H2O/l/s at flows up to 12 l/s.7 (These values should be multiplied by 0.0981 to convert to kPa/l/s.) This statement has recently been updated and now includes separate resistance recommendations for diagnostic spirometers (1.5 cm H2O/l/s over the flow range ±14 l/s) and monitoring devices such as peak flow meters (2.5 cm H2O/l/s over the flow range ±14 l/s).8 These resistance specifications include any tubing, valve or barrier filter associated with the breathing circuit. However, a detailed rationale for the choice of these resistance specifications was not given and surprisingly few quantitative data appear to have been published on the effect of spirometer resistance on the commonly measured indices of expiratory ventilatory function such as FEV1, PEF, forced vital capacity (FVC), and mid forced expiratory flow (FEF25–75%). There are also few data available on the resistance of modern spirometers and monitoring devices, particularly when they are used in conjunction with barrier filters to reduce the risk of cross infection which is now a common practice in many laboratories.
The aims of this study were to measure the resistance characteristics of a range of commonly used spirometers and monitoring devices and to assess the effects of breathing circuit resistance on measurement of ventilatory function in both normal subjects and patients with lung disease.
Methods
FLOW RESISTANCE OF SPIROMETERS AND MONITORING DEVICES
We measured the flow resistance characteristics of five types of diagnostic spirometers which use a variety of measurement principles and three types of monitoring device (table 1). The monitoring devices assessed were new but the spirometers had been in routine use prior to the study. Spirometers were 2–8 years old, regularly maintained, and subject to monthly quality assurance procedures. In addition, the two pneumotachograph devices were calibrated twice daily. A range of accurately known and steady flows (1.6–13.1 l/s) were generated by a computer controlled sliding seal spirometer (CDS)8 and passed into each instrument. At each known flow the back pressure (cm H2O) due to the resistance of the instrument was measured with reference to atmospheric pressure with a calibrated differential pressure transducer (Validyne). The flow resistance (cm H2O/l/s) of each spirometer and monitoring device was calculated by dividing back pressure by the corresponding flow. All devices with heating elements (Lilly and Fleisch pneumotachographs) had their resistance characteristics evaluated with heaters switched off to ensure that the flows delivered by the CDS were unaffected by thermal expansion. The measurements on the volume displacement spirometers (Morgan, Stead Wells and Vitalograph) were carried out with the piston, bell, and wedge bellows set at its minimum volume position. The mean of duplicate measurements at each flow was used for analysis although in general there was no discernible difference between duplicates.
Types of spirometers and monitoring devices assessed
EFFECT OF BREATHING CIRCUIT RESISTANCE ON VENTILATORY FUNCTION
Control ventilatory function (PEF, FEV1, FVC, and FEF25–75%) was measured in six healthy subjects with normal lung function (normal group) and in 13 subjects with abnormal lung function (patient group) (table 2). The subjects in the normal group were selected from laboratory personnel with normal lung function and no history of respiratory or cardiac disease. The patient group consisted of five patients with reversible airflow limitation, two with pure restrictive patterns (total lung capacity (TLC) <80%, FEV1/FVC>75%), two with non-reversible chronic obstructive pulmonary disease (COPD, FEV1/FVC >60%), and four heart-lung transplant recipients (6–12 months after transplantation).
Control ventilatory function
The measurements of ventilatory function were made with a calibrated Lilly pneumotachograph (Jaeger Masterlab, Hoechberg, Germany) whose flow resistance characteristics had been determined as described above. This instrument was chosen because of its linear resistance. Ventilatory function was measured according to the latest ATS recommendations.8
Ventilatory function was then reassessed at 20 minute intervals with four external resistors (internal diameters 16 mm, 14 mm, 11.5 mm, and 8.5 mm) inserted one at a time in random order between the mouthpiece and pneumotachograph. Two parabolic screens were inserted between the resistor and pneumotachograph to ensure that the expired airflow was dispersed axially before passing through the pneumotachograph (fig 1). Calibration checks were performed by emptying a three litre calibration syringe over a wide range of flows and showed that this arrangement preserved the accuracy of the pneumotachograph with and without the resistors in place.

Schematic diagram of the breathing circuit used to assess the effect of resistance on ventilatory function.
The flow resistance characteristics of the pneumotachograph plus each resistor and parabolic screens were measured as described above over the flow range 1.6–13.1 l/s.
ANALYSIS OF DATA
Because the resistance of an added resistor varied with flow, it follows that each subject was exposed to varying resistances during the expiratory manoeuvre. This complicated the choice of which resistance value to use for each index of ventilatory function. The resistances corresponding to the following flows were considered the most appropriate for each index of ventilatory function:
PEF: resistance corresponding to the flow equal to PEF.
FEF25–75%: resistance corresponding to the flow equal to FEF25–75%.
FEV1: resistance corresponding to the mean flow during the first second of the FVC manoeuvre.
FVC: resistance corresponding to the flow equal to the MEF50%.
To quantify the effect of increasing breathing circuit resistance on measurement of ventilatory function we used least squares linear regression analysis to calculate the mean percentage change in each index per unit change in resistance—for example, ΔFEV1/cm H2O/l/s). This analysis was performed separately on the normal subjects and patients and then on the pooled data. An unpaired t test was used to analyse differences between patients and normal subjects.
In order to calculate the magnitude of the change in each index of ventilatory function we calculated the mean effect for all subjects at the upper limit of the ATS resistance specifications for diagnostic (1.5 cm H2O/l/s) and monitoring devices (2.5 cm H2O/l/s) and also at 3.5 cm H2O/l/s. These data are shown in table 4 as the mean percentage change relative to zero resistance. The change at 3.5 cm H2O/l/s was included to determine whether relaxing the ATS specification to allow the use of barrier filters would cause clinically significant errors.
Effect of specific resistances on ventilatory function. All results are relative to zero resistance
Results
FLOW RESISTANCE OF THE SPIROMETERS AND MONITORING DEVICES
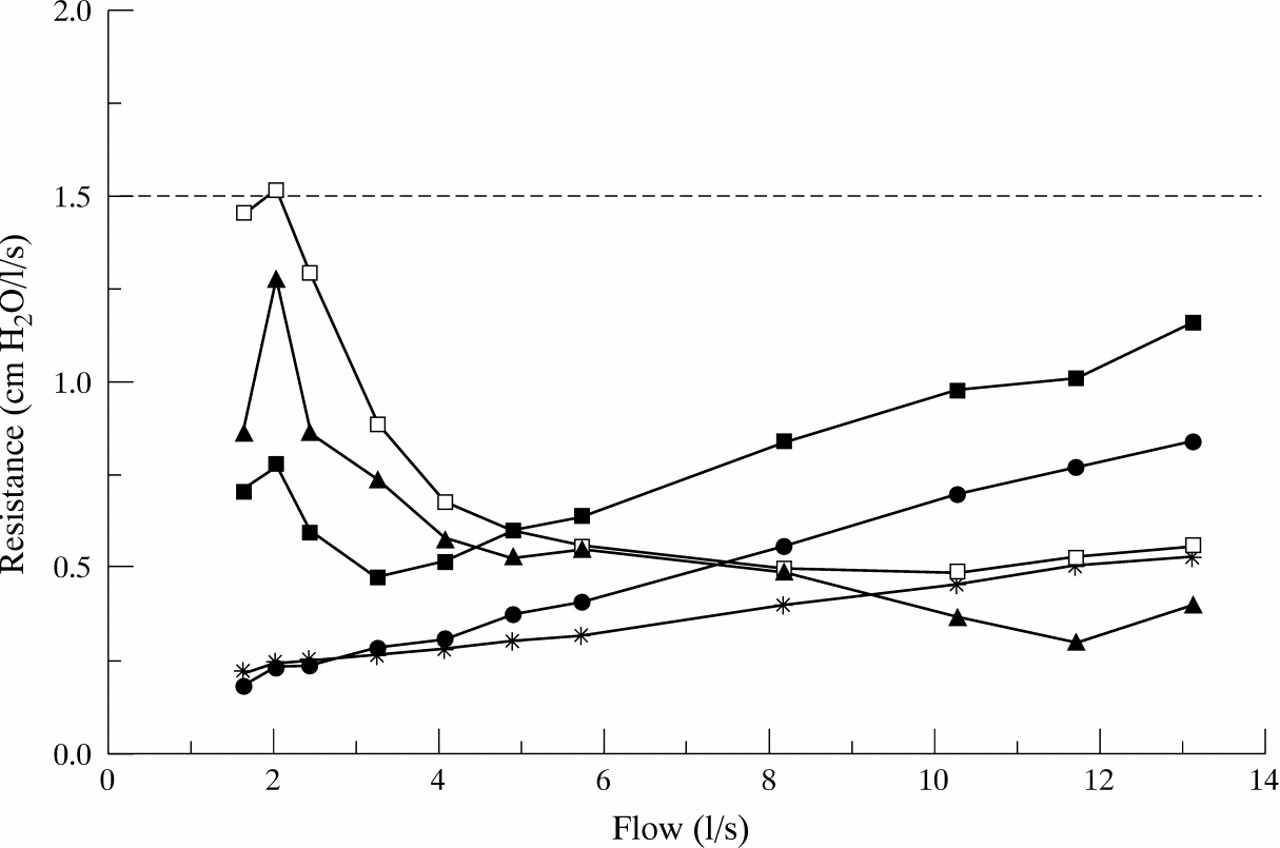
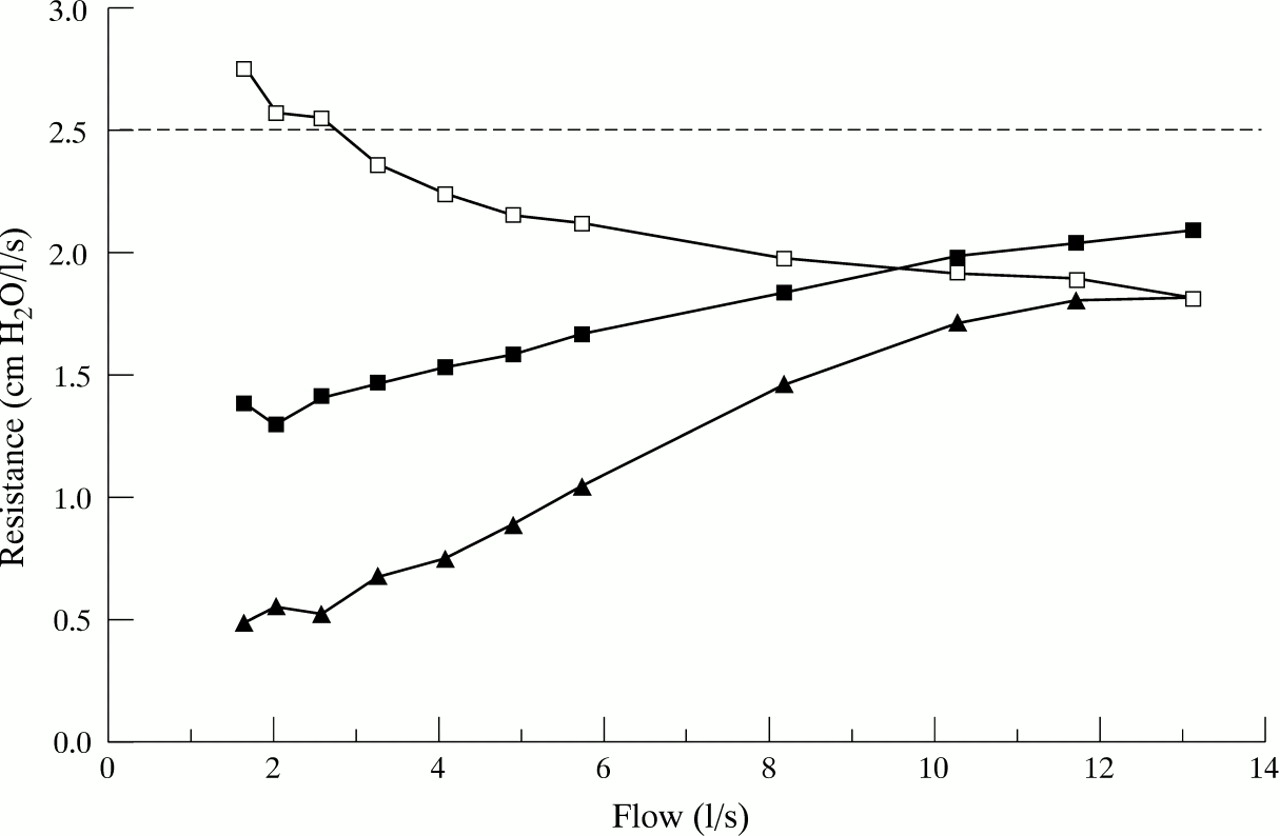
The five spirometers (wedge bellows, rolling seal, water sealed, Fleisch and Lilly pneumotachographs) conformed to the ATS resistance specification over the flow range 1.6–13.1 l/s (fig 2). The Stead Wells water sealed spirometer had the lowest resistance at the highest flows assessed, whereas the Vitalograph wedge bellows spirometer had the highest resistance at low flows. The Fleisch pneumotachograph had the lowest overall resistance. Of the three monitoring devices studied the Ferraris and Spiro1 passed the ATS resistance specification for monitoring devices but the mini-Wright peak flow meter exceeded the resistance specification at flows lower than 2.8 l/s (fig3).

Resistance profiles of five diagnostic spirometers over the flow range 1.6–13.1 l/s. The horizontal line represents the maximum ATS resistance specification. □ = Vitalograph; ▴ = Stead Wells; • = Morgan M8; ● = Lilly pneumotachograph; * = Fleisch pneumotachograph.

Resistance profiles of three monitoring devices over the flow range 1.6–13.1 l/s. The horizontal line represents the maximum ATS resistance specification. ▴ = Spiro 1; □ = mini-Wright; • = Ferraris.
EFFECT OF ADDED EXTERNAL RESISTANCES ON VENTILATORY FUNCTION
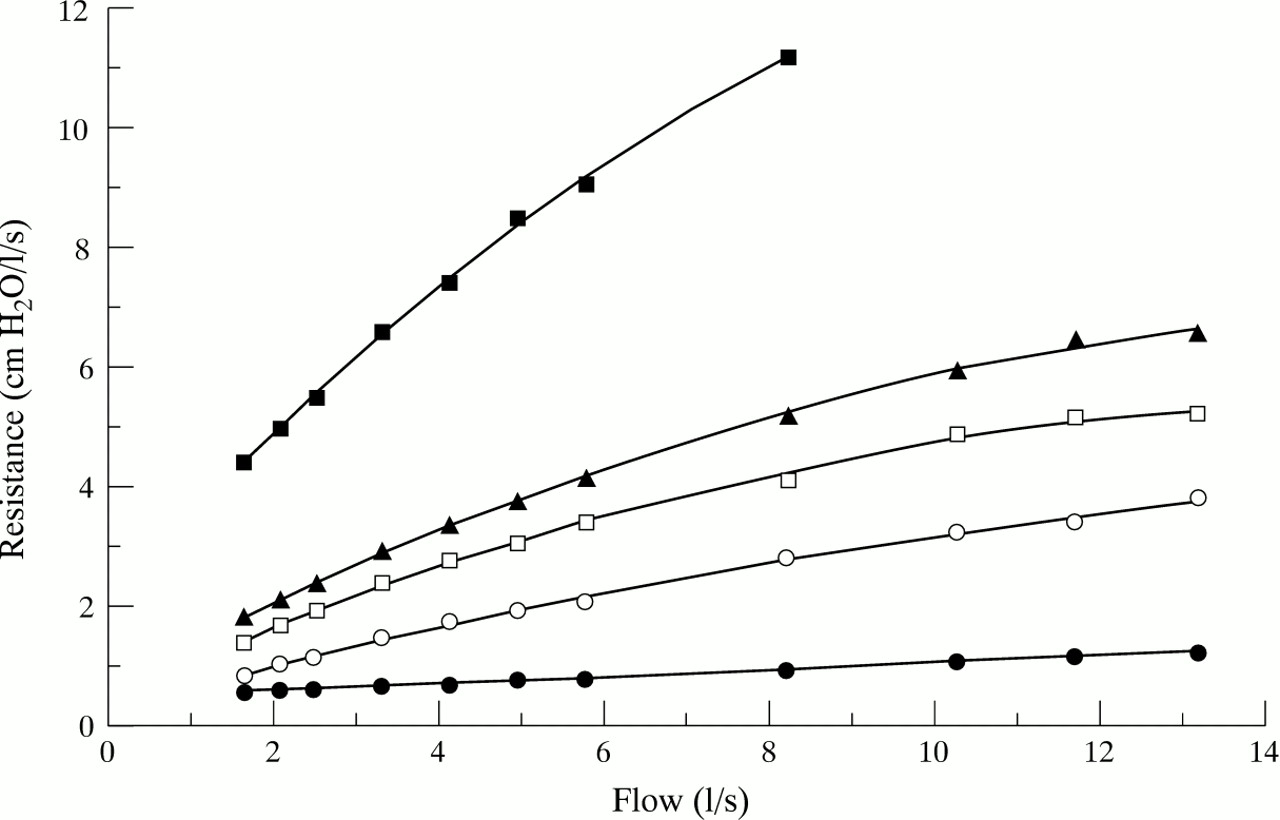
Figure 4 shows the flow resistance characteristics of the Lilly pneumotachograph with and without the inclusion of each external resistor (resistor plus pneumotachograph). The flow resistance of the pneumotachograph alone increased linearly with flow from 0.4 to 1.2 cm H2O/l/s, which was within the ATS specification of <1.5 cm H2O/l/s. With the resistors in the circuit the flow resistance of the pneumotachograph circuit ranged up to 11.2 cm H2O/l/s at 8.3 l/s.

Resistance characteristics of the four resistors added to the Lilly pneumotachograph. Resistor diameter: • = 8.5 mm; ▴ = 11.5 mm; □ = 14 mm; ○ = 16 mm; ● = Lilly pneumotachograph and parabolic screens.
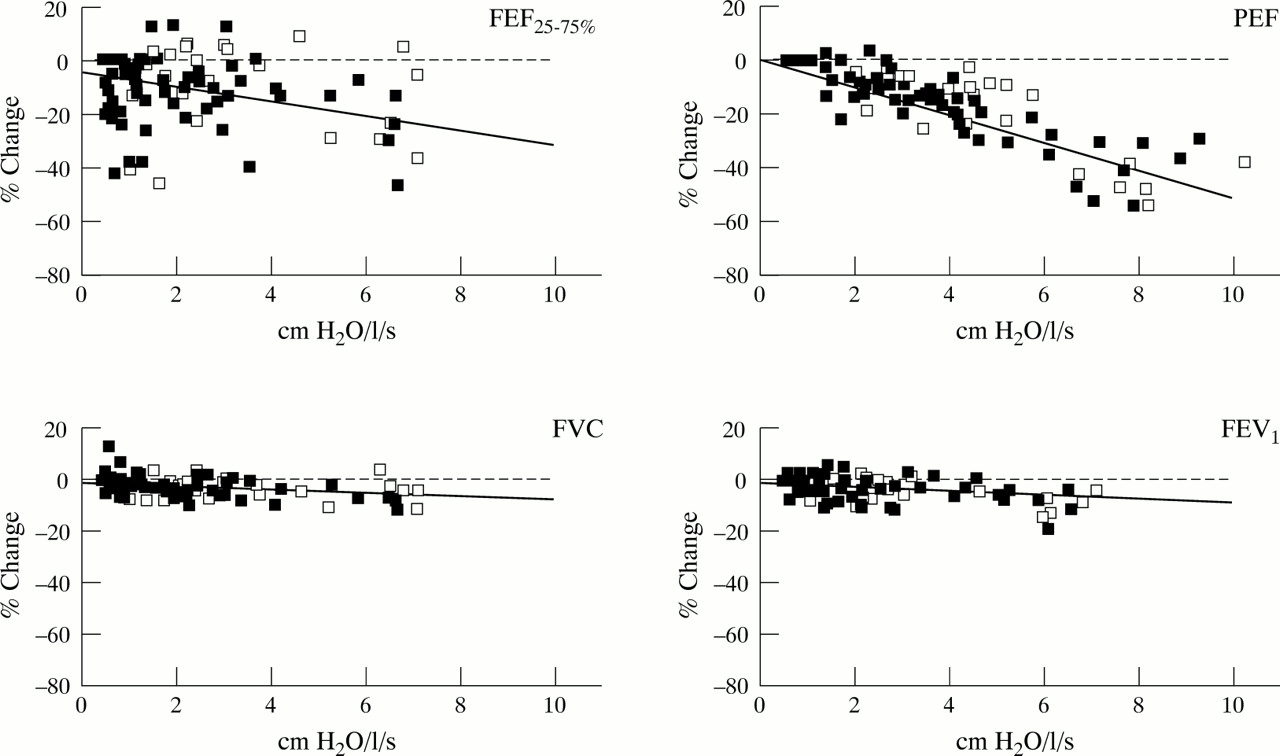
There was a significant inverse relationship between the resistance of the breathing circuit and the percentage change in PEF, FEV1, and FVC for both the patient and normal subject groups, but not for FEF25–75% (fig 5). The differences in gradient between the two groups were not significant (p>0.1) and so the data for all subjects were pooled (table 3). For each ventilatory index the gradient was negative, indicating a decrease in ventilatory function with increasing spirometer resistance. PEF was the most sensitive to circuit resistance with a mean fall in gradient of –4.58%. There was considerably less change in FEV1(–1.25%) and FVC (–1.02%) with increasing resistance. The decrease in FEF25%−75% with increasing resistance was –3.43 but the variation between subjects was so high that the gradient did not reach significance.

Percentage change in FVC, FEV1, FEF25–75% and PEF with increasing circuit resistance. Open squares are the normal group and closed squares the patient group. The solid line is the least squares regression. The horizontal line represents zero percentage change.
Relationships between breathing circuit resistance and lung function (pooled data)
Discussion
This study has shown that all five diagnostic spirometers and two of the three monitoring devices met the ATS resistance specification8 over the flow range 1.6–13.1 l/s. The mini-Wright peak flow meter was within the ATS specification at flows above 2.8 l/s but marginally failed at lower flows (fig 3). As expected, the resistance of this instrument was not a linear function of flow because it is designed to operate as a variable resistor. The Stead Wells (water sealed) spirometer had the lowest resistance at high flows and the Vitalograph (wedge bellows) spirometer had the highest resistance at the low flows (fig 2).
With the increasing use of barrier filters in spirometer circuits one must consider whether their additional flow resistance would increase the resistance of the breathing circuit beyond the ATS limit. Published data on the resistance characteristics of one brand of barrier filter suggest that their resistance increases linearly with flow to about 0.6 cm H2O/l/s at 12 l/s.5 This suggests that the airflow resistance of most diagnostic spirometers and all monitoring devices would fall outside the accepted ATS upper limit if used with this barrier filter.
Our study also showed that PEF, FEV1 and FVC decreased significantly (p<0.05) with increasing spirometer resistance. This agrees with published data of Guimond and Gibson9 and also of Johns et al 5 who assessed ventilatory function before and after the inclusion of a barrier filter to their spirometer circuit. The reason for the failure to show a significant effect of resistance on FEF25–75% is unclear but may be due to the large variability in this index.
Table 4 shows that PEF is the most sensitive index to circuit resistance. At the ATS resistance limit of 1.5 cm H2O/l/s PEF is the only index for which the mean decrease of up to 6.9% may be regarded as clinically significant. However, using the higher resistance limit of 2.5 cm H2O/l/s for monitoring devices the mean decrease in both PEF (11.5%) and FEV1 (3.1%) may be clinically relevant. Relaxing the ATS specification to 3.5 cm H2O/l/s would produce clinically unacceptable errors in PEF, FEV1, and FVC. The data suggest that the ATS resistance specifications are appropriate, although increasing the maximum requirement for diagnostic spirometers up to 2.0 cm H2O/l/s would seem reasonable to allow for the use of barrier filters without undue loss of accuracy.
The sensitivity of PEF measurements to breathing circuit resistance probably contributes to the inaccuracy of inter-instrument measurements. The capacity of an instrument to accurately detect changes in PEF would be compromised if its resistance changed widely throughout its flow range as is the case with several of the instruments, some of which showed an increasing and some a decreasing resistance with flow. This could also contribute to differences between instruments in their capacity to measure changes in PEF accurately.
Robertson et al 4 studied the effects of an external resistance on ventilatory function in normal controls and patients with COPD. They also found that PEF was the most sensitive index to the presence of an external resistance when the internal diameter of an resistor was decreased to 12 mm in the control group and 10 mm in the COPD group, with significant reductions whether expressed in absolute units or as a percentage change. Their results are in agreement with our findings that spirometer resistance produced greater absolute reductions in PEF in the normal control group than in the patient group. We believe our data are easier to apply than those of Robertson and colleagues because we related the change in ventilatory function to circuit resistance rather than orifice size. As stated, this may have implications for the ability of some monitoring devices and diagnostic spirometers to accurately monitor changes in PEF in an individual with markedly varying PEF values, particularly if the resistance characteristics of the device vary.
Shepard2 also studied the effect of an external resistance on PEF and showed that, with increasing resistance, the sharp peak seen in a plot of flow versus time was flattened and that an external resistance of 2 cm H2O/l/s had a relatively small effect on the peak flow reading. However, he observed a significant decline in PEF at resistances of 8 and 28 cm H2O/l/s. At a resistance of 2.0 cm H2O/l/s our data also showed there would be a relatively small reduction in PEF of about 0.6 l/s (36 l/min).
Although the decrease in all indices of ventilatory function with increasing resistance was significant, we would only consider the decrease in PEF to have some clinical relevance. Ironically, the devices with the highest resistance are those designed to measure PEF, which is the most sensitive to circuit resistance. Even so, only one peak flow meter did not meet the ATS resistance specification and this was only true at low flows. It can be argued that this is not critical in a monitoring device provided the patient uses the same device and comparisons are made between readings rather than compared with predicted values. However, peak flow meters are provided with a scale calibrated in l/min and predicted values are often included which were obtained using a low resistance spirometer. As shown in table 3, if the resistance of the measuring device was 2.5 cm H2O/l/s (ATS upper limit for monitoring devices) the mean decline in PEF would be 0.75 l/s (45 l/min) and 0.1 l for FEV1. These decreases may be considered clinically significant for those subjects with compromised lung function. However, our data show that, in absolute terms, the ventilatory function of such subjects was less sensitive to external resistance than those with higher or less compromised function.
In conclusion, this study provides data which demonstrate that the ATS resistance standards for spirometers and monitoring devices are appropriate and applicable. Although the resistances of the equipment evaluated are not negligible, effects upon pulmonary function measurements were generally not of clinical significance. However, added resistances of the magnitude inherent in barrier filters, which are being increasingly used, are likely to breach ATS guidelines and have clinically relevant effects upon the measurement of airflow.