Article Text

Abstract
Background: A diagnosis of aspirin-intolerant asthma requires aspirin provocation in specialist clinics. Urinary leukotriene E4 (LTE4) is increased in aspirin-intolerant asthma. A study was undertaken to investigate new biomarkers of aspirin intolerance by comparing basal levels of cysteinyl-leukotrienes (CysLTs) and leukotriene B4 (LTB4) in saliva, sputum and ex vivo stimulated blood in subjects with aspirin-intolerant and aspirin-tolerant asthma. The effects of aspirin- and allergen-induced bronchoconstriction on leukotriene levels in saliva and ex vivo stimulated blood were also compared with the effects of the provocations on urinary mediators.
Methods: Induced sputum, saliva, urine and blood were obtained at baseline from 21 subjects with asthma. At a separate visit, 11 subjects showed a positive response to lysine-aspirin inhalation and 10 were aspirin tolerant. Saliva, blood and urine were also collected on the provocation day. Analyses of CysLTs and LTB4 and the prostaglandin D2 metabolite 9α,11β-prostaglandin F2 were performed and the fraction of exhaled nitric oxide was measured.
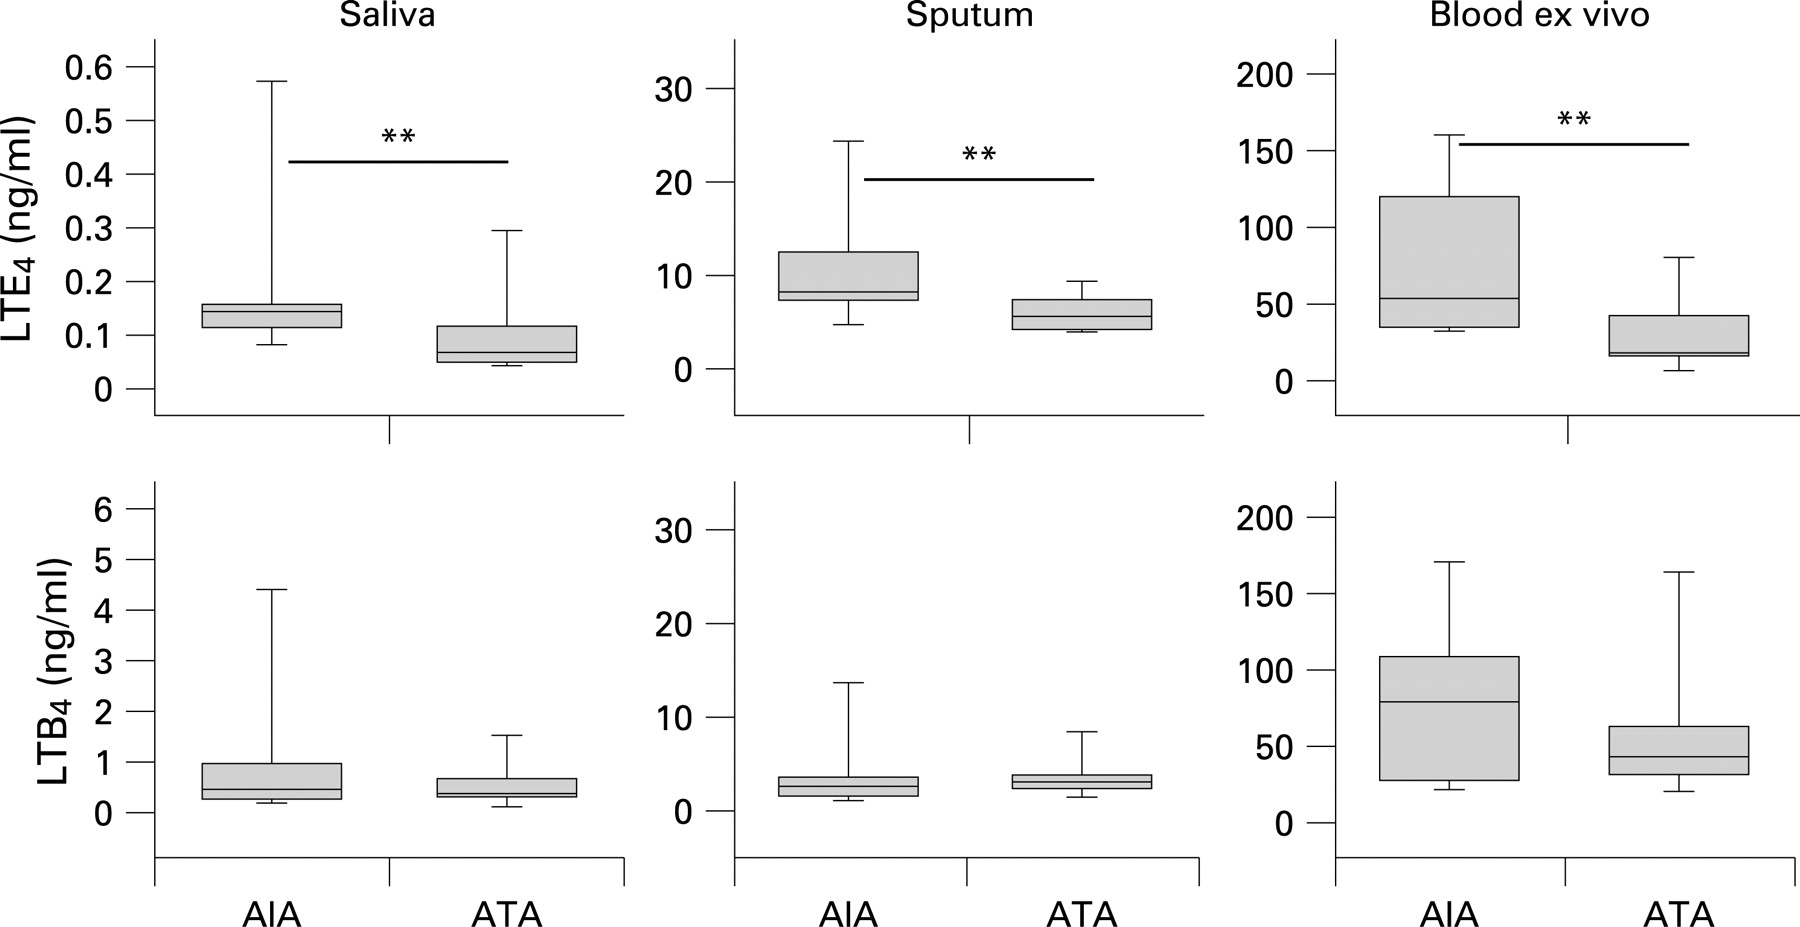
Results: Subjects with aspirin-intolerant asthma had higher exhaled nitric oxide levels and higher baseline levels of CysLTs in saliva, sputum, blood ex vivo and urine than subjects with aspirin-tolerant asthma. There were no differences in LTB4 levels between the groups. Levels of urinary LTE4 and 9α,11β-prostaglandin F2 increased after aspirin provocation whereas leukotriene levels in saliva and ex vivo stimulated blood did not increase.
Conclusion: These findings support a global and specific increase in CysLT production in aspirin-intolerant asthma. Measurement of CysLTs in saliva has the potential to be a new and convenient non-invasive biomarker of aspirin-intolerant asthma.
Statistics from Altmetric.com
Aspirin-intolerant asthma (AIA) is a well defined clinical syndrome where asthma and chronic nasal problems such as rhinosinusitis and recurrent polyps are associated with intolerance to aspirin and most other non-steroidal anti-inflammatory drugs (NSAIDs).1–3 The hypersensitivity to aspirin and a large number of structurally unrelated NSAIDs is not due to immunological reactions but is caused by the common ability of this class of drugs to inhibit the cyclooxygenase (COX) enzymes that catalyse prostaglandin (PG) formation.4 More recently it has been concluded that inhibition of the COX-1 isoenzyme precipitates the adverse reaction because subjects with AIA generally tolerate coxibs and other NSAIDs that more selectively inhibit COX-2.1 5 The aspirin/NSAID-induced reaction is associated with mast cell activation6 and the release of cysteinyl-leukotrienes (CysLTs; LTC4, LTD4 and LTE4) which contribute to bronchoconstriction.7 The most accepted hypothesis for how NSAIDs trigger the intolerance reaction is that patients with AIA are exceptionally dependent upon an anti-inflammatory mechanism where PGE2 inhibits mast cell mediator release.1–3
Although there is general agreement that AIA is more common among subjects with severe asthma,8 published estimations of prevalence in patients with asthma vary from 0.1% to 20%.2 One reason for the variable data is that, so far, only challenge tests performed in specialist clinics can objectively establish the diagnosis of AIA. Because of the potential severity of the reactions to NSAIDs and occasional deaths, in many countries everyone with asthma is advised against the use of NSAIDs, although in reality only a minority of patients with the typical clinical phenotype for AIA are at risk. There is therefore a great unmet need for improved methods of AIA diagnosis and a simple non-invasive in vitro test would be attractive.
The primary aim of the present study was to perform a comprehensive assessment of whether or not differences in the basal levels of leukotrienes could be observed between AIA and aspirin-tolerant asthma (ATA) in three matrices that could be included in clinical research and practice; namely, sputum, ex vivo stimulated blood and saliva. The reason the study focused on measurements of leukotrienes is that high basal urinary excretion of LTE4 is the most consistent biomarker of AIA.6 9 It has in fact been proposed that hyperleukotrienuria is one of the strongest predictors of AIA.10 There is also one report of increased sputum levels of CysLTs in AIA compared with ATA,11 whereas data on the ability of blood cells from subjects with AIA to release leukotrienes or other mediators ex vivo are conflicting.11–13
Saliva was included in the panel of tests because we have recently reported that leukotrienes can be measured in saliva.14 This study is the first to assess whether salivary leukotriene levels relate to different asthma phenotypes. Saliva represents a truly non-invasive sample and has previously been used for measurements of immunological and endocrinological variables such as secretory IgA and cortisol.15
Classification of patients by history only has many shortcomings. The protocol for this study was therefore selected in order to provide an unambiguous provocation-verified diagnosis of AIA at the time of the study. The provocations also permitted us, as additional end points, to assess possible effects of aspirin-induced bronchoconstriction on leukotriene levels in saliva, ex vivo stimulated blood and urine.
We analysed levels of urinary LTE4 and 9α,11β-PGF2 at baseline and after challenge. These two measurements were included for comparison because it is documented that both mediators increase after aspirin-induced bronchoconstriction in subjects with AIA.6
Finally, it has been proposed that Clara cell protein-16 (CC-16) is a marker of reactions in peripheral airways and that leakage of CC-16 into the bloodstream may provide an in vivo index of inflammation in the peripheral lung.16 Furthermore, increased levels of the fraction of exhaled nitric oxide (Feno) may serve as an index of airway inflammation.8 As a secondary aim, measurements of serum CC-16 and Feno were therefore included in the study.
METHODS
An extended version of the Methods section is available in the online data supplement.
Subjects
The study involved 21 non-smoking subjects with chronic asthma, recurrent rhinosinusitis and/or nasal polyps and a suspicion of intolerance to NSAIDs (table 1). All subjects had a forced expiratory volume in 1 s (FEV1) ⩾70% of predicted and had stable asthma.
In order to gain further insight into the source of the salivary leukotrienes, urine and saliva were collected from eight patients with atopic asthma (5F/3M, age range 19–55 years) undergoing allergen bronchoprovocation (ethics committee approval Dnr 04-470/1-4).
Study design (table 2)
After an initial screening visit, eligible patients were enrolled for a baseline visit (visit 1) followed by an aspirin provocation visit after 3–10 days (visit 2), except for one subject who returned for the provocation visit after 3 months (identified as ATA). Before each visit, subjects were instructed to withhold medications according to standard procedures. At the baseline visit, measurement of Feno was followed by collection of saliva and urine and sputum induction. On visit 2, subjects underwent a lysine-aspirin inhalation challenge as described in the EAACI/GA2LEN guidelines.17 Subjects producing a fall in FEV1 of 20% or more compared with post-saline FEV1 were assigned to the AIA group. Subjects inhaling the maximum cumulative dose of lysine-aspirin (600 μmol) without significant bronchoconstriction or other adverse symptoms were assigned to the ATA group. Saliva, blood and urine were collected before, during and after the provocation.
Measurement of exhaled nitric oxide (Feno)
Feno was analysed using NIOX (Aerocrine AB, Solna, Sweden) at a flow rate of 50 ml/s.18
Saliva collection
Subjects were instructed to wash their mouth with water before collecting 5 ml of saliva. The sample was stored at −70°C. Before assay the sample was thawed and centrifuged at 1500g for 10 min (+4°C) and the supernatant was subsequently analysed.
Urine collection
The voided volume was measured and the urine samples were stored at −20°C until assayed.
Ex vivo blood incubation
Whole blood was collected and ex vivo stimulation with ionomycin was performed as previously described.19
Sputum induction and processing
Sputum induction and processing of whole sputum was performed essentially according to the ERS guidelines. The sample was considered adequate when it weighed ⩾1 g. The sputum supernatant was stored at −70°C until assayed for leukotrienes. Cytospins were prepared from the cell pellet and differential cell counts were established by counting 500 cells in random fields twice. The results of the cell differential counts are expressed as a percentage of the total number of non-squamous cells, except for squamous cells which are expressed as a percentage of the total cell number.
Measurements of CysLTs, LTB4 and 9α,11β-PGF2
Analyses of CysLTs, LTB4 and 9α,11β-PGF2 were performed in serially diluted aliquots of the respective samples by enzyme immunoassays (Cayman Chemical, Ann Arbor, Michigan, USA) as previously described.19 20 Results of CysLT analyses are expressed as LTE4 equivalents. The final concentrations of LTE4 and 9α,11β-PGF2 in urine are given as ng/mmol creatinine. For analyses of LTB4 and CysLTs in sputum, the same concentration of DTT (0.04%) as in the sputum supernatant was added to the standard curve and enzyme immunoassay buffer.
Measurement of CC-16
Levels of CC-16 in serum were determined using an enzyme-linked immunosorbent assay for serum CC-16 from BioVendor Laboratory Medicine (Brno, Czech Republic) according to the protocol provided by the manufacturer.
Statistical analysis
Baseline levels of Feno were analysed by the Student t test to assess differences between the groups. The Feno results are expressed as means and standard deviations (SD). All other results were analysed using the non-parametric Mann–Whitney rank-sum test and Wilcoxon signed rank test. Results are expressed as medians and interquartile range (IQR). A p value of <0.05 was regarded as significant. Data presented in the figures show the median, 10th, 25th, 75th and 90th percentiles.
RESULTS
Baseline characteristics of subjects
On the basis of the aspirin provocation test results, subjects who did not respond to the highest cumulative dose of 600 μmol lysine-aspirin were assigned to the ATA group (table 1). The resulting groups had very similar baseline characteristics, although the AIA group used slightly higher doses of inhaled corticosteroids (table 1). Sputum cell counts were similar in the two groups, but there was a tendency towards a higher sputum eosinophil count in the AIA group than in the ATA group (6.0% (IQR 1.6–13.3) vs 1.1% (IQR 0.2–3.3); p = 0.078, table 1). The Feno levels were higher in AIA group than in the ATA group (31.7 (12.2) ppb vs 18.9 (11.3) ppb; p = 0.023).
Baseline mediator levels
The AIA group had higher baseline levels of LTE4 in saliva, sputum supernatant and in ex vivo stimulated whole blood (fig 1, table 3). In contrast, basal levels of LTB4 in saliva, sputum supernatant and ex vivo stimulated whole blood were not significantly different between the two groups (fig 1, table 3). The AIA group also had higher baseline levels of urinary LTE4 (table 3). In contrast, urinary 9α,11β-PGF2 levels were not significantly different between the two groups at baseline (table 3). There was no significant difference between the AIA and ATA groups in baseline sputum LTE4 levels expressed per million total cells (AIA 1.2 (IQR 0.9–2.3) vs ATA 1.9 (IQR 0.8–3.2) ng/106 cells; p = 0.972) or per million eosinophils (AIA 30.5 (IQR 8.9–139.8) vs ATA 79.2 (IQR 30.2–616.1) ng/106 eosinophils; p = 0.549). Likewise, the two groups did not differ with regard to baseline levels of LTB4 per million cells nor in relation to macrophages (not shown).
Repeatability analysis
Repeatability of measurements of mediators in saliva and urine and of Feno was calculated as described by Bland and Altman 21 and was found to be good. Thus, the intraclass correlation coefficient between the baseline measurement at visit 1 and the baseline measurement at visit 2 (n = 21) was 0.79 for urinary 9α,11β-PGF2, 0.83 for urinary LTE4, 0.77 for salivary LTB4, 0.70 for salivary LTE4 and 0.87 for Feno.
Effects of aspirin bronchoprovocation on salivary, blood and urinary mediators
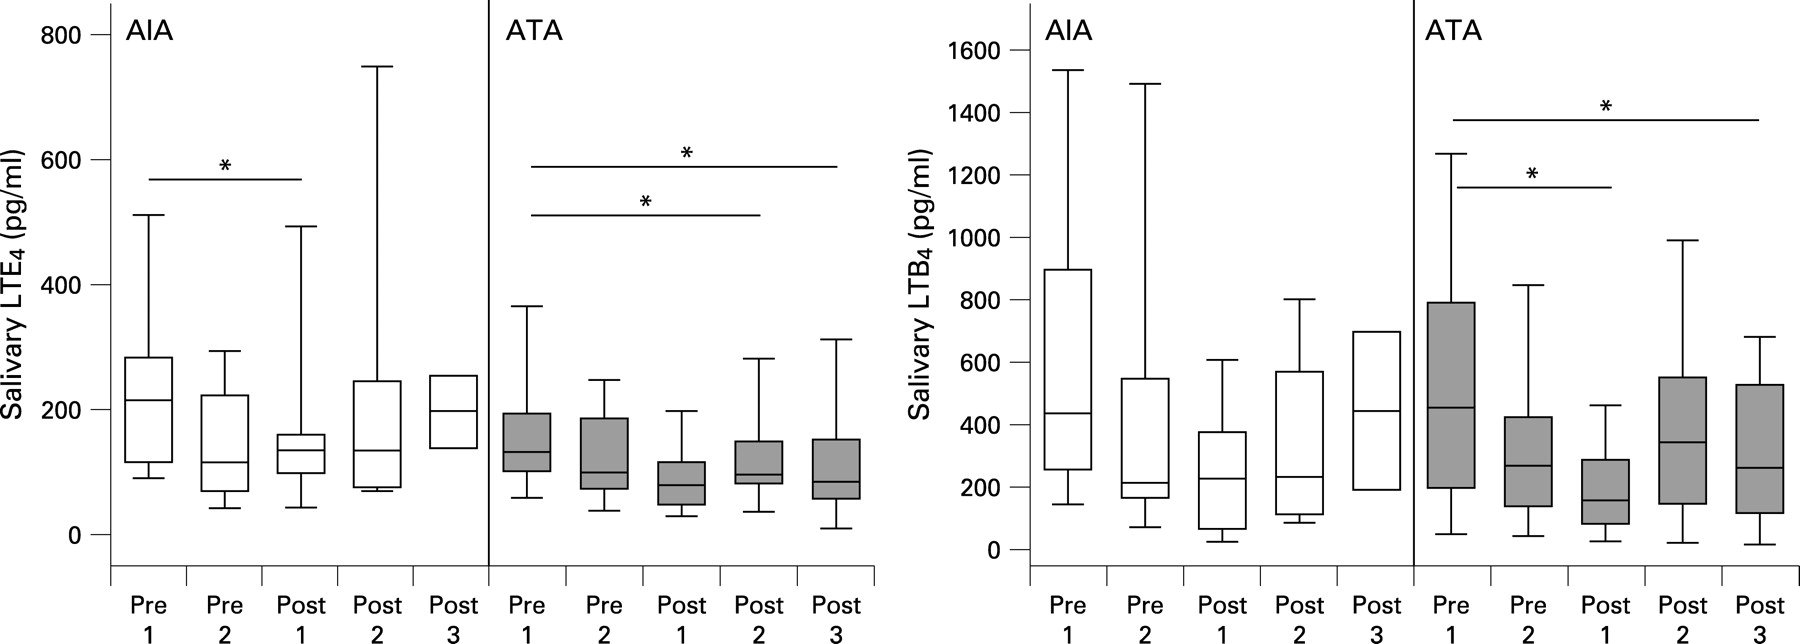
To assess whether aspirin-induced bronchoconstriction affected salivary LTs, saliva was collected every hour during the provocation from prechallenge baseline up to 2–3 h after the end of provocation. No increase in salivary LTE4 or LTB4 was seen in either group of subjects (fig 2). If anything, the levels of LTE4 and LTB4 were decreased after the end of provocation compared with baseline levels (fig 2).

Levels of LTE4 in plasma from ex vivo stimulated whole blood were not significantly altered after lysine-aspirin provocation, nor were post-challenge levels of LTB4 in ex vivo stimulated whole blood altered in the AIA group (fig 3). There was an increase in LTB4 release post-challenge in the ATA group (fig 3).

In contrast, levels of LTE4 in urine were consistently and markedly increased in the AIA group after positive aspirin provocation (p<0.001, fig 4). There was also an increase in the urinary levels of the PGD2 metabolite 9α,11β-PGF2 in the AIA group after positive provocation (p = 0.01, fig 4).

In the ATA group the levels of urinary 9α,11β-PGF2 and LTE4 were not at all or only slightly altered during the course of the negative provocation (fig 4).
Effects of allergen bronchoprovocation on salivary and urinary mediators
In order to investigate further whether salivary leukotrienes were affected by bronchial provocation, saliva and urine were collected in a parallel experiment where atopic subjects with mild asthma (n = 8) were challenged with inhaled allergen.
The levels of salivary LTE4 were not increased following allergen challenge but, as with aspirin provocation, the levels decreased after the end of the provocation (fig 5A). Levels of LTB4 in saliva were not significantly altered following allergen provocation (fig 5A). In contrast and, as expected, there was a significant increase in LTE4 and in 9α,11β-PGF2 in the urine 1 h after the end of the allergen provocation (fig 5B).

Levels of CC-16 during lysine-aspirin bronchoprovocation
There was no change in serum levels of CC-16 following aspirin bronchoprovocation in either group, nor was there a difference between the groups (table 4).
DISCUSSION
The baseline levels of CysLTs were higher in saliva, sputum, ex vivo stimulated blood and in urine from subjects with AIA than in those with ATA. In contrast, basal levels of LTB4 were not significantly different between the two groups in either saliva, induced sputum or ex vivo stimulated blood (LTB4 and its metabolites cannot normally be detected in urine 9). The higher levels of urinary LTE4 in subjects with AIA serve to validate this study and also confirm previous studies of increased urinary levels of CysLTs in patients with AIA.1–3 9 The levels of CysLTs in the sputum of patients with AIA have not been extensively studied. Our finding replicates the only previous report of increased sputum CysLT levels.11 The observation that basal CysLT levels are raised in ex vivo stimulated whole blood and saliva from subjects with AIA is new. This is the first time that measurement of leukotrienes in saliva has been tested as a novel method to distinguish AIA from ATA. Taken together, our data lend further support to the concept that there is a global deviation in leukotriene metabolism in AIA, with selective overproduction of CysLTs but not LTB4.
One particular strength of our study was that the AIA status of the subjects was confirmed with an aspirin bronchoprovocation test at the time of the study. This is important as it is well known that the aspirin/NSAID intolerance clinically has a waxing and waning course.1–3 Another advantage of our study protocol was that it avoided the possible effects of aspirin desensitisation. Patients with AIA will be desensitised for up to a week after a positive reaction to aspirin or any other NSAID,1–3 and this may also lead to decreased leukotriene production.22 In order to avoid the influence of such a refractory state when collecting baseline samples, subjects were assigned as AIA or ATA depending on the outcome of the aspirin provocation test at the following visit.
It has been suggested that basal overproduction of CysLTs in AIA is due to increased expression of LTC4 synthase in eosinophils,23 the enzyme that initiates formation of CysLTs from LTA4.24 Interestingly, when sputum CysLT levels were expressed per million eosinophils, the levels were not greater in the AIA group. This suggests that the increased baseline levels of CysLTs in AIA may be due to increased numbers of eosinophils rather than an overactivation of each eosinophil.
Furthermore, our finding of higher Feno levels at baseline in AIA would lend circumstantial support to more pronounced eosinophilic inflammation in this group.25 This is also the first report of increased Feno in AIA despite the fact that the AIA group was treated with somewhat higher doses of inhaled corticosteroids than the ATA group. Four subjects in the AIA group were also treated with leukotriene receptor antagonists which have been shown to reduce Feno levels.26 Rolla et al27 did not observe a significant difference in baseline Feno levels between AIA and ATA, but their patients with ATA had higher sputum eosinophils (7%) than in our study (1%).
This study has shown for the first time that subjects with AIA have higher baseline levels of salivary CysLTs than those with ATA. We have previously reported that the 5-lipoxygenase inhibitor zileuton effectively inhibited salivary leukotriene levels.14 We propose that saliva may be a new alternative for in vivo monitoring of the effects of drugs that affect the leukotriene pathway. However, the leukotriene content of saliva should also be recognised as a possible contributing source of leukotrienes when collecting other biological samples via the mouth. We have previously shown that LTB4 was only detectable in exhaled breath condensate when saliva was present.28 In the present study, possible salivary contamination of sputum samples was estimated to be similar in the two groups as sputum squamous cell counts did not differ between the two groups (table 1).
With regard to the origin of the salivary leukotrienes, it is known that LTE4 appears in other body fluids such as urine after its appearance in the circulation.9 29 We were also able to document the expected increments in urinary excretion of LTE4 following aspirin-induced and allergen-induced bronchoconstriction. However, there was no increase in salivary CysLTs after either challenge. We therefore conclude that salivary levels of CysLTs are unlikely to reflect direct overflow from the circulation. Further studies are needed to determine whether the leukotrienes are secreted only from the salivary glands or if further processes such as exchange over ductal epithelium and synthesis by cells in the oral cavity contribute to leukotriene levels in whole saliva. Cells taken from the oral cavity have been found to produce leukotrienes,30 but our subjects rinsed their mouths before collecting saliva, suggesting that oral contribution is limited. There is also an intriguing report which suggests that patients with asthma have local inflammation in salivary glands that seems to mirror airway inflammation.31
This is also the first time that whole blood from subjects with AIA has been shown to possess an increased capacity for ionophore-stimulated CysLT production. Sanak et al12 did not detect a difference between AIA and ATA in plasma LTC4 levels from whole blood stimulated with interleukin 3 and ionophore, nor did Obase et al11 detect a difference at baseline between AIA and ATA with respect to CysLT levels in unstimulated blood.
The basal urinary levels of the mast cell marker 9α,11β-PGF2 were not significantly different between AIA and ATA, which confirms previous results.6 Taken together, the data in this study support the concept that the increased basal CysLT biosynthesis in AIA is mainly eosinophil-derived and, furthermore, that mast cell activation during aspirin-induced bronchoconstriction—as documented in this study by increased levels of 9α,11β-PGF2—leads to additional production of CysLTs.
In summary, this study found higher baseline levels of CysLTs in saliva, induced sputum, ex vivo stimulated blood and urine from subjects with AIA than from subjects with ATA. However, there were no differences in LTB4 levels between the two groups. The finding of higher CysLT levels in saliva from subjects with AIA is new. We conclude that CysLTs in saliva should be explored as a new and clinically convenient biomarker of AIA and other diseases associated with increased production of leukotrienes.32
Acknowledgments
The authors thank Jenny L Barton, Katarina Damm, Marianne Eduards, Elisabeth Henriksson, Ann-Sofie Lantz and Dr Nurdan Sandalci for valuable contributions.
REFERENCES
Supplementary materials
web only appendix 63/12/1076
Files in this Data Supplement:
Footnotes
▸ An extended version of the Methods section is published online only at http://thorax.bmj.com/content/vol63/issue12
Funding: The Swedish MRC, Heart-Lung Foundation, Asthma and Allergy Foundation, The Stockholm County Council (ALF), the Research Council of HMQ Sophiahemmet and Karolinska Institutet.
Competing interests: None.
Ethics approval: The study was approved by the local ethics committee (Dnr 518/03) and the subjects gave written informed consent.
Linked Articles
- Miscellaneous