Article Text

Abstract
Background: The Global Initiative on Obstructive Lung Disease stages for chronic obstructive pulmonary disease (COPD) uses a fixed ratio of the post-bronchodilator forced expiratory volume in 1 second (FEV1)/forced vital capacity (FVC) of 0.70 as a threshold. Since the FEV1/FVC ratio declines with age, using the fixed ratio to define COPD may “overdiagnose” COPD in older populations.
Objective: To determine morbidity and mortality among older adults whose FEV1/FVC is less than 0.70 but more than the lower limit of normal (LLN).
Methods: The severity of COPD was classified in 4965 participants aged ⩾65 years in the Cardiovascular Health Study using these two methods and the age-adjusted proportion of the population who had died or had a COPD-related hospitalisation in up to 11 years of follow-up was determined.
Results: 1621 (32.6%) subjects died and 935 (18.8%) had at least one COPD-related hospitalisation during the follow-up period. Subjects (n = 1134) whose FEV1/FVC fell between the LLN and the fixed ratio had an increased adjusted risk of death (hazard ratio (HR) 1.3, 95% CI 1.1 to 1.5) and COPD-related hospitalisation (HR 2.6, 95% CI 2.0 to 3.3) during follow-up compared with asymptomatic individuals with normal lung function.
Conclusion: In this cohort, subjects classified as “normal” using the LLN but abnormal using the fixed ratio were more likely to die and to have a COPD-related hospitalisation during follow-up. This suggests that a fixed FEV1/FVC ratio of <0.70 may identify at-risk patients, even among older adults.
- BMI, body mass index
- CHS, Cardiovascular Health Study
- COPD, chronic obstructive pulmonary disease
- FEV1, forced expiratory volume in 1 second
- FVC, forced vital capacity
- GOLD, Global Initiative on Obstructive Lung Disease
- LLN, lower limit of normal
Statistics from Altmetric.com
- BMI, body mass index
- CHS, Cardiovascular Health Study
- COPD, chronic obstructive pulmonary disease
- FEV1, forced expiratory volume in 1 second
- FVC, forced vital capacity
- GOLD, Global Initiative on Obstructive Lung Disease
- LLN, lower limit of normal
Chronic obstructive pulmonary disease (COPD) is an internationally important cause of morbidity and mortality.1,2 The definition of COPD has evolved over time from one based on a clinical diagnosis of chronic bronchitis or anatomical findings of emphysema to one based on the presence of abnormal lung function.3,4
The Global Initiative on Obstructive Lung Disease (GOLD) has developed criteria to help both the diagnosis and epidemiological study of COPD3,5 that have been, in large part, adopted by the American Thoracic Society and the European Respiratory Society.6 The GOLD criteria classify obstructive lung disease on the basis of the post-bronchodilator lung function into the following categories: stage 1 (mild, forced expiratory volume in 1 second (FEV1)/forced vital capacity (FVC) <0.70 and FEV1 ⩾80%), stage 2 (moderate, FEV1/FVC <0.70 and FEV1 ⩾50% to <80% predicted), stage 3 (severe, FEV1/FVC <0.70 and FEV1 ⩾30% to <50% predicted) and stage 4 (very severe, FEV1/FVC <0.70 and FEV1 <30% predicted). In addition, people with chronic respiratory symptoms with an FEV1/FVC ratio ⩾0.70 are classified as GOLD stage 0 (at risk).3
An area of controversy in the GOLD guidelines relates to the use of the fixed FEV1/FVC ratio of 0.70 as the threshold for defining stage 1 or more severe COPD. This decision was a pragmatic one, based on the desire for simplicity, as perception of the complexity of spirometry and its interpretation has been one of the barriers to more widespread uptake of this simple clinical tool. This threshold, although easy to remember, does not take into account the age-related decline in the FEV1/FVC ratio. Thus, a ratio of 0.65 might be considered “normal” in a 75-year-old if one uses the population “norms” to classify individuals. This concept is shown graphically in fig 1⇓, which shows the lower limit of normal (LLN) for the FEV1/FVC ratio derived from “healthy” female never smokers in the Third National Health and Nutrition Examination Survey.7 From these data, the age at which the LLN crosses 0.70 is 52 years in white women (comparable ages for other race–gender groups are 41 years for white men, 54 years for black women and 48 years for black men). The darker shading of fig 1⇓ depicts people who would be diagnosed as having COPD using the fixed ratio but not using the LLN, a group which some might consider “overdiagnosed”.8 Using the same logic, the fixed ratio potentially “underdiagnoses” COPD in younger adults (fig 1⇓). The recently published American Thoracic Society/European Respiratory Society guidelines for the interpretation of spirometry recommends that the LLN be used to classify “obstruction” on spirometry.9 These recommendations come from an examination of cross-sectional data. A hallmark of COPD is the presence of obstruction, but patients may have obstruction in the absence of COPD, although in this paper we will consider the presence of “obstruction” and COPD as the same. Missing from discussions of whether to use the fixed ratio versus the LLN is how these different classifications relate to outcomes. This information is crucial in making recommendations for the clinical use of spirometry.
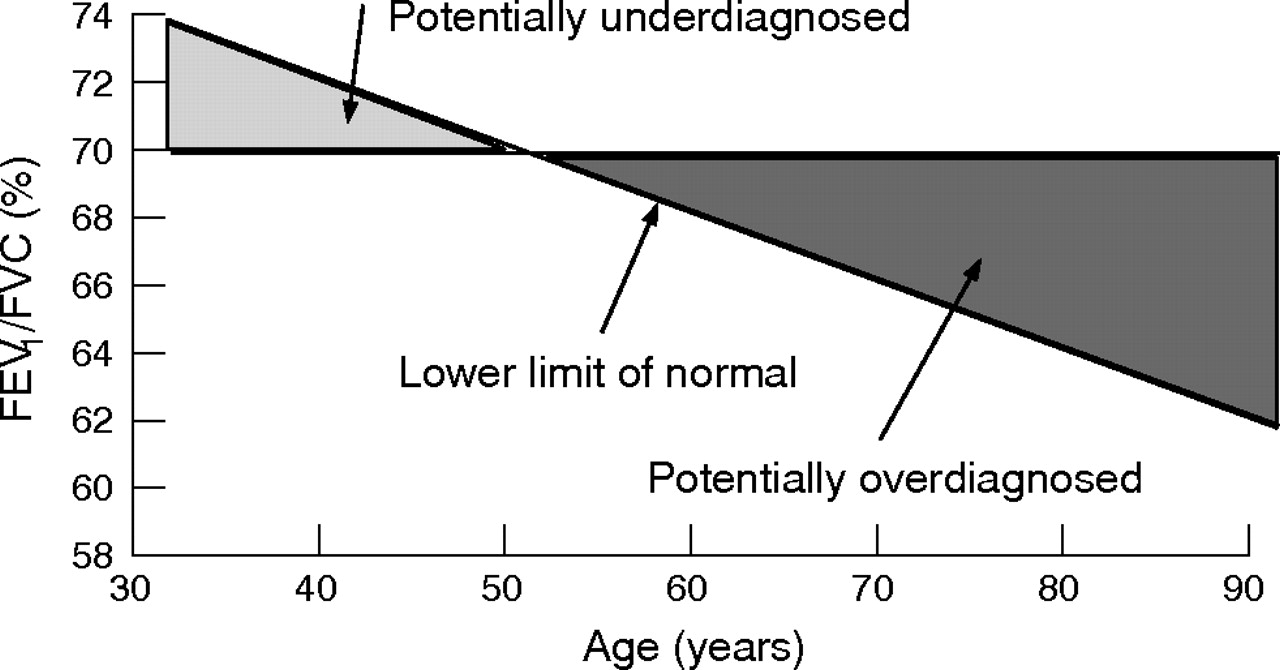
Diagram depicting the decline of the lower limit of normal of the forced expiratory volume in 1 second (FEV1)/forced vital capacity (FVC) ratio with ageing, among white never-smoking women in the Third National Health and Nutrition Examination Survey.7 The dark shaded portion depicts elderly subjects who are “potentially overdiagnosed” and the light shaded portion depicts younger adults who are “potentially underdiagnosed” with obstructive lung disease.
This paper uses data from a large cohort of US adults aged ⩾65 years at baseline and followed for up to 11 years in order to look at outcomes in individuals who fell below the fixed ratio threshold of 0.70 at baseline, but whose ratios were above the LLN. We compared their outcomes against those of a healthy cohort of a similar age that was free of respiratory symptoms and had “normal” lung function (FEV1/FVC ⩾0.70 and FVC >80% predicted) at baseline.
METHODS
Study background and population
Study subjects were members of the Cardiovascular Health Study (CHS), a cohort of 5201 men and women, aged ⩾65 years, who were recruited from four communities in 1989.10 Our analysis was limited to CHS participants of white or black race who underwent pulmonary function testing during their baseline clinical examination. For this analysis, participants were followed for up to 11 years to determine all-cause mortality and COPD-related hospitalisations. Study protocols were approved for protection of humans.10
Pulmonary function data
Spirometry was conducted using a volume displacement, water-sealed spirometer. At least three acceptable spirograms were obtained from a minimum of five forced expirations. Quality assurance was provided by the CHS Pulmonary Function Center, and the procedures followed the then contemporary American Thoracic Society guidelines.11 We used the race-specific and sex-specific prediction equations developed by Hankinson et al7 to determine the predicted values for the FEV1, FVC and the LLN for the FEV1/FVC.
Variable definition
Age, sex, race and smoking status were self-reported. Age was stratified into six categories, race was classified as white or black and baseline smoking status was classified as current, former or never.
We used modified GOLD criteria3 to classify an individual’s lung function, adding a “restricted” category (FEV1/FVC ⩾0.70 and FVC <80% predicted). Subjects were then classified as GOLD 0 if they had “normal” lung function (FEV1/FVC ⩾0.70 and FVC ⩾80% predicted) and at least one respiratory symptom. (Do you usually have a cough? Do you usually bring up phlegm from your chest? Does your chest ever sound wheezy or whistling apart from colds? Do you have to walk slower than people of your age on the level because of breathlessness?) In addition, we stratified GOLD categories 1, 2 and 3–4 according to whether the FEV1/FVC ratio was also less than the LLN (table 1⇓).
Description of modified Global Initiative on Obstructive Lung Disease categories
Deaths
Information on deaths coded in the CHS database was obtained from death certificates, although the cause of death was not made available in our file to protect the participants’ confidentiality. We used the time of survival from the baseline examination to either death or the date last known to be alive as the time metric.
Hospitalisations
Hospitalisation data were searched and events coded for any hospitalisations that mentioned COPD in the time period after the baseline examination. We used the time from the spirometric test to the COPD hospitalisation, death or the date last known to be alive as the time metric.
Analysis of data
All analyses were conducted with SAS V.8.2, SUDAAN (Survey Data Analysis) V.8.0 and SPSS V.10. Our primary outcomes of interest in the survival models were death and COPD hospitalisations, and the main predictor of interest in our analysis was lung function. Cox proportional hazard regression models were developed using the SUDAAN procedure SURVIVAL to account for differential follow-up in cohort participants. Plots of the log–log survival curves for each covariate were produced to ensure that the proportional hazards assumptions were satisfied. Time of follow-up was used as the underlying time metric. For deaths, the exit date was the date of death reported on the death certificate and, for survivors, the exit date was the date the participant was last known to be alive. For COPD hospitalisations the exit date was the date of COPD hospitalisation, and for those not hospitalised the exit date was the date of death reported on the death certificate or the date the participant was last known to be alive. Age, sex, race, and smoking status were included in the adjusted models.
RESULTS
The studied CHS cohort consisted of 5201 subjects. We excluded 30 subjects who were not of white or black race, 154 subjects missing pulmonary function data and an additional 52 individuals who were missing data on covariates included in the analysis or missing follow-up data, leaving 4965 subjects in our analytical cohort.
Table 2⇓ shows the demographic characteristics of the studied population. The cohort comprised 95% whites and 57% women, and only 11.6% were current smokers. The categories in bold in the modified GOLD classification scheme represent those individuals who would not have been classified as having COPD had we used the LLN in place of the fixed ratio to define an abnormal ratio. In all, 54% (1134) of the 2090 individuals who met the current GOLD threshold for COPD would not have been identified as having COPD based on the LLN criterion. This included 74.9% of those with GOLD stage 1, 38.6% of those with GOLD stage 2 and 2.4% of those with GOLD stage 3 or 4 disease.
Demographic distribution of study participants and proportion of people who died or had a chronic obstructive pulmonary disease-related hospitalisation during follow-up
During the follow-up period there were 1621 (32.6%) deaths and 935 (18.8%) individuals with at least one COPD-related hospitalisation (table 2⇑). As would be expected, increasing age was associated with a higher death rate, as was sex and smoking status. Smoking status and age were, similarly, predictors of COPD-related hospitalisation, whereas age was not.
When evaluated using Cox proportional hazard models, the “potentially overdiagnosed” individuals (ie, those for whom the FEV1/FVC ratio was <0.7 but greater than the LLN) seem to be at increased risk of both death and COPD-related hospitalisation. The unadjusted HR, relative to the “normal” group, for all-cause mortality was significantly >1 for those with both stage 1 and stage 2 disease (small sample size precluded meaningful analysis of those with stage 3 or 4 disease), and this remained statistically significant in the adjusted analysis for those with stage 2 disease (table 3⇓).
Risk of lung function impairment for death using Cox proportional hazard models
Furthermore, for all “potentially overdiagnosed” subjects combined, the adjusted risk of death was 1.3 (95% CI 1.1 to 1.5). For COPD-related hospitalisations, the estimated risks were consistently greater and more statistically significant (table 4⇓), with an adjusted risk of 2.6 (95% CI 2 to 3.3) for all “potentially overdiagnosed” subjects combined.
Risk of lung function impairment for chronic obstructive pulmonary disease-related hospitalisation using Cox proportional hazard models
The Kaplan–Meier curves depicting time to the first COPD-related hospitalisation, stratified by baseline lung function level, are shown in fig 2⇓.

Kaplan–Meier survival curves of chronic obstructive pulmonary disease (COPD)-related hospitalisation. From the Cardiovascular Health Study and follow-up through 1999. Global Initiative on Obstructive Lung Disease (GOLD) stage 3 or 4 (FEV1 (forced expiratory volume in 1 second)/FVC (forced vital capacity) <0.70 and FEV1<50% predicted), GOLD stage 2 (FEV1/FVC <0.70 and FEV1 ⩾50 to <80% predicted), GOLD stage 1 (FEV1/FVC <0.70 and FEV1 ⩾80%), restricted (FEV1/FVC ⩾0.70 and FVC <80% predicted), GOLD stage 0 (presence of respiratory symptoms in the absence of any lung function abnormality) and no lung disease. GOLD stages are further split into those with subjects below and above (bold) the lower limit of normal (LLN) for the FEV1/FVC.
The preceding analyses indicate that individuals with restrictive disease and those with GOLD stage 0 (ie, symptomatic but with normal lung function) are also at an increased risk of both all-cause mortality and COPD-related hospitalisations. Those with restrictive disease seem to have a risk between that of individuals with stage 1 and stage 2 disease. The “potentially overdiagnosed” group with ratios above the LLN tend to be at less risk than those whose ratios are less than the LLN.
DISCUSSION
In this large cohort of an elderly population, lung function at the baseline examination predicted both death and COPD-related hospitalisations during the follow-up period. Indivduals whose FEV1/FVC fell between the LLN and the fixed ratio, who some might consider as “overdiagnosed”, had an increased adjusted risk of death (HR 1.3, 95% CI 1.1 to 1.5) and COPD-related hospitalisation (HR 2.6, 95% CI 2 to 3.3) during follow-up.
Although we saw the above noted effects in the overall “potentially overdiagnosed” group, these effects varied, predictably, by the FEV1 percentage predicted category at baseline (tables 3⇑ and 4⇑). This resulted in a much stronger effect being seen among subjects with FEV1 <80% predicted (GOLD stage 2 or higher) than those above this threshold.
We included in this analysis separate categories for subjects with restrictive disease and those who reported respiratory symptoms at baseline in the absence of pulmonary function impairment (GOLD stage 0). Our inclusion of individuals who report any respiratory symptom (cough, sputum production, wheezing, or dyspnoea) goes beyond what the GOLD criteria use to classify GOLD stage 0 (chronic symptoms of cough and sputum production),3 but we have shown previously that this more inclusive and sensitive classification predicts adverse outcomes.12 This finding was confirmed in this analysis, with subjects in the GOLD stage 0 category at baseline having a higher adjusted risk of death (HR 1.2, 95% CI 1.03 to 1.4) and COPD-related hospitalisation (HR 1.9, 95% CI 1.4 to 2.5) during follow-up.
Although the current GOLD criteria3 do not include a category for restrictive disease, we have shown previously that a variety of different disease processes, including congestive heart failure, diabetes mellitus and obesity, predict this spirometric pattern and that this spirometric pattern is a predictor of death.13 Kohler et al14 reported recently that about 14% of patients in their “COPD clinic” were in this category. In this analysis, being in this category at baseline predicted both death and COPD-related hospitalisations at follow-up. Whether this represents a misdiagnosis, a phenotype of COPD or an overlap between COPD and other comorbid disease is unclear.
Central to this paper is the debate on what constitutes “normal” in a population and how that may change over time and with ageing. For example, the body mass index (BMI) of the population of the US has been increasing in recent years.15 Using population “norms” to classify people in the upper 5th centile of BMI, rather than using a fixed BMI threshold to classify an at-risk group, would misclassify people at risk if the population is growing more obese.16 More analogous to what is seen with lung function in an ageing population, visual acuity declines with age.17 Standards for what constitutes adequate vision to, for example, obtain a driver’s licence are not linked to age; if a person’s vision is below a certain fixed threshold, they are not issued a licence.
This analysis has certain limitations. The strict classification using GOLD criteria requires the use of a post-bronchodilator FEV1, which was not available in this study.3 There is evidence that 20–30% of a population classified as “obstructed” pre-bronchodilator will not meet this criteria after an inhaled bronchodilator.18 However, what proportion of these people meet true reversibility criteria, and how this change affects outcomes is unclear. In our analysis, misclassifying “normal” subjects as obstructed would have biased our findings towards the null. We did not have data on total lung capacity, which is needed for the strict definition of restrictive lung disease,19 so it is possible that some people we classified as restrictive may have had other pathology or normal lung volumes.20 Again, this potential misclassification would bias our findings towards the null. In this analysis we did not reclassify our “potentially overdiagnosed” subjects into either our “restrictive” category or GOLD stage 0. This was done to simplify the analysis and to allow the results to be more easily interpreted.
The current GOLD standards for the diagnosis of COPD use the fixed FEV1/FVC of 0.70 to define COPD, potentially “over-diagnosing” some elderly patients whose ratio is below this threshold but above their LLN value. Data from this analysis suggest that patients in this group have a risk of death and COPD-related hospitalisations that is higher than that seen in “normal” subjects but lower than that seen in subjects with values below the LLN. Thus, using the LLN to classify lung disease in older people may miss a part of the population more likely to have complications and, possibly, able to benefit from intervention. Overall, this suggests that concerns about “over-diagnosis” of COPD using the fixed ratio that stem from cross-sectional data deserve closer scrutiny from other cohort studies that can evaluate outcomes to see if their analyses replicate ours.
Acknowledgments
We thank the staff and participants in the Cardiovascular Health Study (CHS) for their important contributions. The CHS is conducted and supported by the National Heart Lung and Blood Institute (NHLBI) in collaboration with the CHS Investigators. This paper was not prepared in collaboration with the investigators of the CHS and does not necessarily reflect the opinions or views of the CHS or the NHLBI. We also thank Jennifer Methvin and Rebecca Copeland for their valuable contributions to this work.
REFERENCES
Footnotes
Published Online First 7 November 2006
Funding: None.
Competing interests: None declared.