Article Text

Abstract
To investigate whether hyperpolarised xenon-129 MRI (HXeMRI) enables regional and physiological resolution of diffusing capacity limitations in chronic obstructive pulmonary disease (COPD), we evaluated 34 COPD subjects and 11 healthy volunteers. We report significant correlations between airflow abnormality quantified by HXeMRI and per cent predicted forced expiratory volume in 1 s; HXeMRI gas transfer capacity to red blood cells and carbon monoxide diffusion capacity (%DLCO); and HXeMRI gas transfer capacity to interstitium and per cent emphysema quantified by multidetector chest CT. We further demonstrate the capability of HXeMRI to distinguish varying pathology underlying COPD in subjects with low %DLCO and minimal emphysema.
- COPD ÀÜ mechanisms
- imaging/CT MRI etc
- COPD pathology
- emphysema
- lung physiology
- respiratory measurement
This is an open access article distributed in accordance with the Creative Commons Attribution Non Commercial (CC BY-NC 4.0) license, which permits others to distribute, remix, adapt, build upon this work non-commercially, and license their derivative works on different terms, provided the original work is properly cited, appropriate credit is given, any changes made indicated, and the use is non-commercial. See: http://creativecommons.org/licenses/by-nc/4.0/.
Statistics from Altmetric.com
Introduction
Chronic obstructive pulmonary disease (COPD) is a leading cause of death worldwide and represents a heterogeneous group of diseases sharing irreversible airflow obstruction as a common feature.1 Recent studies have highlighted the complex overlap of multiple COPD traits.1–3 Still, conventional diagnostics, such as pulmonary function testing (PFT) and multidetector chest CT (MDCT), have limitations including uncoupled anatomic and functional information, and reliance on multiple, often metachronous studies. Because hyperpolarised xenon-129 MRI (HXeMRI) permits visualisation and quantification of pulmonary physiology associated with alveolar tissue density, ventilation, perfusion and gas–blood barrier thickness in the human lung, it offers the ability to deconvolute complex pathophysiology in COPD (figure 1).4–7 Here, we report on the relationships between conventional COPD multimodality metrics (PFT and MDCT) and HXeMRI indices. We further demonstrate the capability of HXeMRI to spatially and physiologically resolve functional defects, instantiated in the COPD trait of gas exchange impairment out of proportion to emphysema extent, which we designate herein as minimal emphysema-diffusion capacity limitation (ME-DCL).

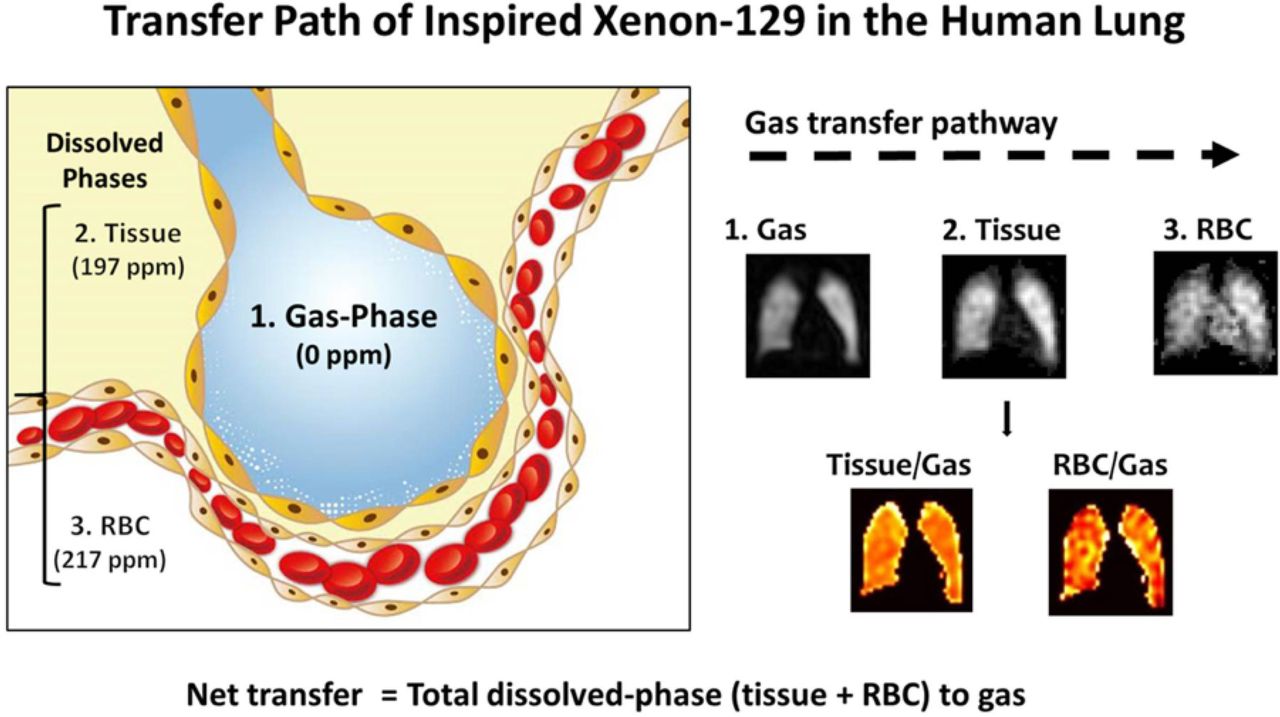
Intrapulmonary transfer path of inspired xenon-129 in the human lung. The transfer path starts from the gas phase (0 PPM) in alveoli to dissolution in the lung parenchyma and plasma (tissue, 197 PPM), and then into the red blood cells (RBC, 217 PPM). Because images of xenon-129 in these three compartments are acquired simultaneously and are inherently co-registered, ratio maps can be produced: tissue-to-gas ratio reflecting pulmonary tissue density and RBC-to-gas ratio reflecting the overall gas transfer efficiency from alveolar airspaces to blood. The tissue-to-gas and RBC-to-gas ratios are expressed as a percentage (%), meaning the amount of xenon-129 dissolved in tissue or rbcS as a fraction of the total amount of xenon-129 remaining in the alveoli through ventilation (gas).
Methods and results
Thirty-four COPD subjects and 11 healthy volunteers were enrolled. Subjects’ clinical characteristics are shown in online supplemental table 1. All subjects were assessed by PFT, MDCT and HXeMRI. PFT evaluation comprised spirometry with and without bronchodilator (2.5 mg albuterol sulfate by nebulisation), body plethysmography for lung volume, carbon monoxide diffusion capacity (DLCO) and 6 min walk. Details of these assessments, data analyses and statistics are described in the online supplemental file . No significant demographic differences were observed between COPD and healthy subjects (online supplemental table 1). PFT reflected irreversible obstructive lung disease in subjects with COPD. Multivariable correlation matrix analysis was performed to probe relationships between conventional diagnostics (PFT, per cent of %DLCO and quantitative MDCT) and HXeMRI indices, which included ventilation defect percentage (VDP, percent areas of the lung with no ventilation), xenon diffusion into interstitial tissues normalised to xenon in alveoli (tissue/Gas), and xenon diffusion into capillary red blood cells (RBCs) normalised to xenon in alveoli (RBC/Gas) (figure 1).6 8 Relevant PFT metrics correlating with HXeMRI indices were: per cent predicted value of forced expiratory volume in 1 s (%FEV1) with VDP (Spearman r=−0.70, p<0.0001), per cent of the lung with Low Attenuation Area Hounsfield unit less than −950 (%LAA-950) with tissue/gas (Spearman r=−0.82, p<0.0001) and %DLCO with RBC/gas (Spearman r=0.72, p<0.0001) (figure 2A–C). Apparent diffusion coefficient (ADC, a marker of terminal airspace dilation) was performed in a subset of subjects (n=36) and was significantly correlated with %DLCO (Spearman r=−0.74, p<0.0001), tissue/gas (Spearman r=−0.78, p<0.0001), and RBC/gas (Spearman r=−0.73, p<0.0001 (online supplemental figure 1). COPD subjects had significantly higher VDP (p<0.001), and significantly lower tissue/gas (p<0.01) and RBC/gas (p<0.001) (figure 2D–F). While minimal overlap was seen in VDP for COPD compared with healthy subjects (whose mean VDP was 2.55%, consistent with prior literature), overlap was seen for both tissue/gas and RBC/gas. ADC was also significantly increased in COPD subjects as compared with healthy subjects (online supplemental figure 1).
Supplemental material

(A) correlation of hyperpolarised xenon-129 MRI (HXeMRI) ventilation defect percentage (VDP) with per cent predicted forced expiratory volume in 1 s (%FEV1) (Spearman r=−0.70, p<0.0001), (B) Correlation of HXeMRI gas transfer capacity to interstitium (Tissue/Gas) with per cent emphysema quantified by MDCT (Spearman r=−0.82, p<0.0001) and (C) Correlation of HXeMRI gas transfer capacity to red blood cells (RBC/Gas) with %DLCO (Spearman r=0.72, p<0.0001). (D) Ventilation defect percentage (p<0.0001), (E) Tissue-to-gas ratio (p=0.005) and (F) RBC-to-gas ratio (p=0.0001) in COPD (○) and healthy (x) subjects. Mann-Whitney U test was performed for data in D–F. COPD, chronic obstructive pulmonary disease; DLCO, carbon monoxide diffusion capacity; MDCT, multidetector chest CT.
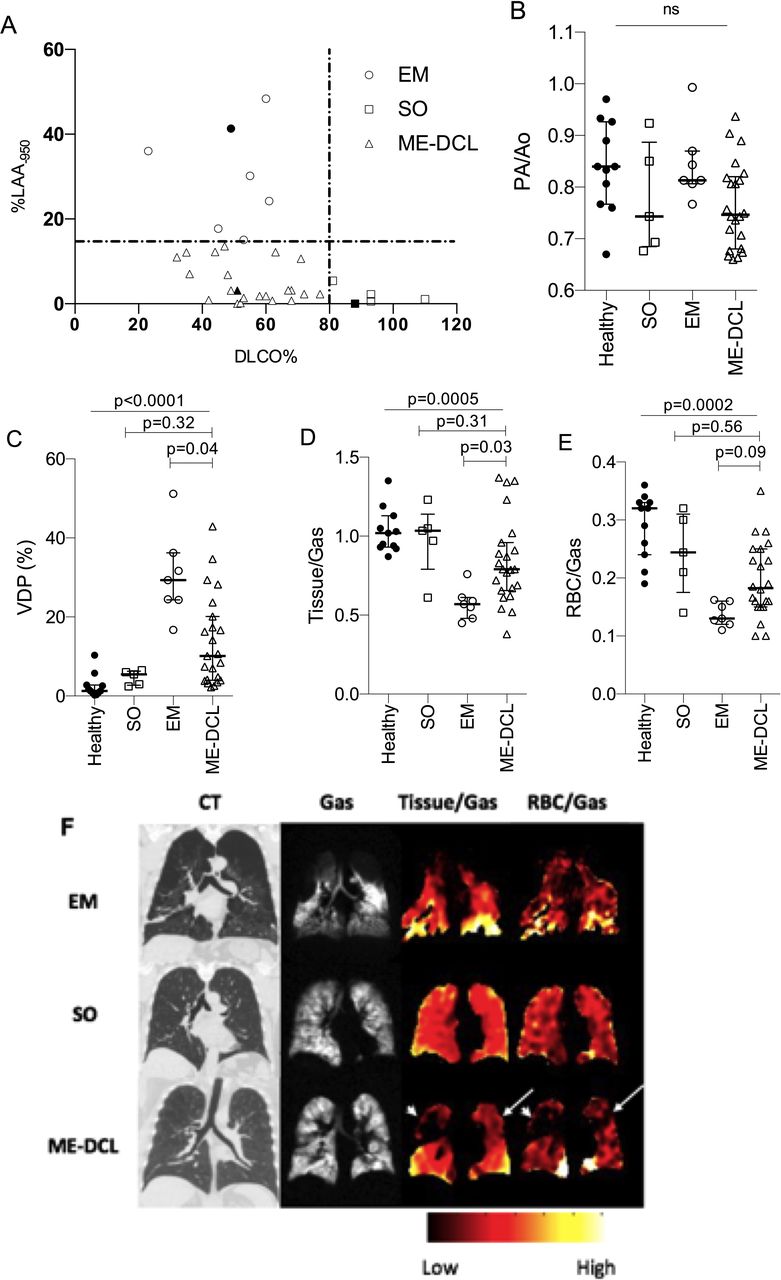
To demonstrate the capability of HXeMRI to enhance resolution of underlying pathophysiology, we investigated the trait of ME-DCL. We categorised COPD subjects into three mutually exclusive phenotypes by applying binary %DLCO and %LAA-950 thresholds (figure 3A). Subjects with %LAA-950 ≧15% and %DLCO ≦80% were designated ‘emphysema-predominant’ (EM, n=7, ‘o’).9 Subjects with %LAA-950 <15% and %DLCO ≧80% were designated ‘simple obstruction’ (SO, n=5, ‘⧠’), while subjects with %LAA-950<15% and %DLCO <80% were designated (ME-DCL, n=22, ‘⧍’). Baseline demographics and characteristics of these groups are presented in online supplemental table 2. Age, ody mass index and pack-years were comparable among the groups. Current smokers were significantly overrepresented in the ME-DCL group. Severity of airflow obstruction was increased in EM as compared with SO and ME-DCL. Six min walk distance and %DLCO were similar between EM and ME-DCL (online supplemental table 2 and figure 2). To investigate whether low %DLCO in ME-DCL subjects was attributable to pulmonary hypertension, CT-derived pulmonary artery to aorta diameter ratio (PA/Ao) was assessed as a convenience measure in all subjects with no differences observed among groups (figure 3B).
(A) Grouping COPD phenotypes by per cent predicted value of carbon monoxide diffusion capacity (%DLCO) and per cent of the lung with emphysematous changes detectable by % Low Attenuation Area less than -950 Hounsfield Unit (%LAA-950) by MDCT. Vertical line shows cut-off of 80% predicted value of %DLCO. Horizontal line shows cut-off of 15% value for %LAA-950. em, denoted by ‘O’ symbol, represents subjects with EM phenotype (%DLCO ≦80% and %LAA-950≧15%). SO, denoted by ‘□’ symbol, represents subjects with minimal emphysema extent and preserved DLCO (%DLCO ≧80 and %LAA-950 <15). Minimal Emphysema-Diffusion Capacity Limitation (ME-DCL), denoted by ‘△’ symbol, represents subjects with minimal emphysema but disparately impaired diffusion capacity (%DLCO <80% and %LAA-950 <15%). (B) Pulmonary artery diameter to aorta diameter ratio (PA/Ao) in healthy (x), em (○), so (□), and ME-DCL (△) groups. (C) Ventilation defect percentage (VDP), (D) Tissue-to-gas ratio and (E) RBC-to-gas ratio in healthy (x), em (○), SO (□), and ME-DCL (△) groups. Kruskal-Wallis analysis was performed for multigroup comparison and Dunn’s multiple comparisons between ME-DCL and EM or ME-DCL and SO in the C–E. Representative images for subjects denoted with symbols ‘●’, ‘■’ and ‘▲’ are presented in F. (F) Images of individuals from each of the three subgroups. White arrow heads indicate matched tissue/gas and RBC/gas defects. White arrows indicate isolated RBC/gas defect. COPD, chronic obstructive pulmonary disease; EM, emphysema-predominant; MDCT, multidetector chest CT; ns, not significant; RBC, red blood cell; SO, simple obstruction.
HXeMRI VDP mirrored differences in %FEV1 and was highest in EM with subgroup analysis revealing significantly higher VDP in EM (29.3% (24.3%–36.2%)) and ME-DCL (10.1% (4.0%–20.1%) compared with SO (5.5% (2.7%–6.3%) and healthy subjects (1.3% (0.8%–2.8%)) (figure 3C). A wider variance in VDP was seen in ME-DCL, with some VDPs comparable to those of EM and others nearly normal. Gas exchange indices, HXeMRI tissue/gas, revealed the lowest movement of xenon gas into tissue in EM (0.57 (0.48–0.61)), the highest in SO (1.04 (0.79–1.13)), and the intermediate in ME-DCL (0.79 (0.66–0.96)) (figure 3D). Similarly, RBC/gas revealed the lowest movement of xenon gas into RBC in EM (0.13 (0.12–0.16)), the highest in SO (0.24 (0.18–3.10)), and the intermediate in ME-DCL (0.18 (0.15–0.25)) (figure 3E). We set our %LAA-950 threshold at 15% so that we are confident that emphysema is a primary contributor of the respiratory pathophysiology in EM group. We also considered an alternative threshold of %LAA-950 at 6.8% from other publications,10 and this alternative approach corroborated our strategy (online supplemental figure 3). To deconvolute the dissolved-phase indices of ME-DCL at the subject level, we reasoned that in regions of preserved ventilation, where RBC/gas and tissue/gas defects coregister, deficits are attributable to regional emphysema. Alternatively, isolated RBC/gas defects reflect vascular compromise or early interstitial disease. We provide representative images from an ME-DCL subject with these two distinct pathologic profiles affecting different regions of the lung (figure 3F, representative SO and EM subjects). While this ME-DCL subject’s right upper lobe RBC/gas defect conforms to the tissue/gas defect affecting the same region (arrowheads), the RBC transfer defect of the left upper lobe does not correspond to a tissue/gas defect (arrows).
Discussion
Our cohort of COPD subjects demonstrates high fidelity between HXeMRI-derivable indices and PFT and MDCT. While single-breath VDP may serve as a surrogate for %FEV1, when considered in isolation, dissolved-phase signals are more difficult to interpret. Specifically, tissue/gas may be reduced with emphysema or non-ventilating lung regions and RBC/gas may reflect the amalgam of alveolar integrity and capillary perfusion in series.6 By considering ventilation, tissue/gas, and RBC/gas signals as a gradient reflecting xenon movement from alveoli to RBCs, more resolved identification of aberrant regional physiology becomes feasible.7 With this approach, we report considerable intersubject and intrasubject heterogeneity among ME-DCL subjects. These subjects may not be uniformly characterised by a single pathology but rather varying, subject-specific aggregates of multiple pathologies resulting in V/Q mismatch. As presented here, attenuated RBC/gas in regions of preserved tissue/gas and ventilation may reflect perfusion-limitation, an interpretation supported by our recent findings demonstrating that low RBC/gas in the absence of emphysema identifies areas of lung with poor perfusion.6 In contrast, tissue/gas and RBC/gas defects in series reflect parenchymal destruction (subclinical emphysema).6
Our study has several limitations. First, we apply a new HXeMRI technique, which requires validation in larger populations, although our observed correlation of HXeMRI indices with conventional diagnostics provides preliminary methodological validation. Second, the thresholds defining our ME-DCL group are sensitive and somewhat arbitrary. We expect that a hierarchical cluster analysis of a much larger population would provide more reliable estimates of the ‘true’ %DLCO and %LAA-950 boundaries of this population. Third, our quantitation methods for ventilation focus on areas with no ventilation. Clinical implication of areas with reduced ventilation (hypoventilation) also seems important because it tracks HXeMRI gas exchange matrix (online supplemental figure 4). Significance of hypoventilated areas, however, requires further investigation in the future. Fourth, more ME-DCL subjects were active smokers at the time of study participation. Active cigarette smoking can confound the gas exchange measurement by PFT and HXeMRI. Therefore, subjects with a history of active smoking were asked to refrain from cigarette smoking 24 hours prior to participating in our study, and they reported to be compliant with this request. Lastly, the therapeutic implications of our findings are unknown. Parsing pathology is of limited value unless pathology-specific treatment options are available. As a single modality, HXeMRI offers synchronous, quantifiable and regional data reflecting the functions of multiple microcompartments in the human lung and may improve phenotypic resolution of COPD for future research.
Supplementary materials
Supplementary Data
This web only file has been produced by the BMJ Publishing Group from an electronic file supplied by the author(s) and has not been edited for content.
Footnotes
Contributors All authors listed in this manuscript have made substantial contributions to the conception or design of the work, or the acquisition, analysis or interpretation of data. All authors listed in this manuscript have made substantial contribution to drafting the work or revising it critically for important intellectual content. Final approval of the version submitted is obtained from all the listed authors. LM, KQ, and MH equally contributed to the work in this manuscript as the first coauthors. KQ, JP and YMS performed planning, conducting, reporting, conception and design, acquisition of data or analysis and interpretation of data. LM, MH, NT, AMR, GWM, JM, TA performed conducting, reporting, acquisition of data or analysis and interpretation of data. ZL, AWM, JP, YH, ZO, ST performed reporting, acquisition of data or analysis and interpretation of data. JC, RNN-A performed conducting, reporting and acquisition of data.
Funding This study is funded by NIH HL132177 (KQ, YMS), NIH HL132287 (YMS), NIH HL091127 (YMS), NIH HL109618 (JM, TA), NIH CA172595 (JM), NIH S10OD018079 (JM).
Competing interests None declared.
Patient consent for publication Not required.
Provenance and peer review Not commissioned; externally peer reviewed.