Article Text

Abstract
Introduction Idiopathic pulmonary fibrosis (IPF) is a fatal disease of lung scarring. Many patients later develop raised pulmonary vascular pressures, sometimes disproportionate to the interstitial disease. Previous therapeutic approaches that have targeted pulmonary vascular changes have not demonstrated clinical efficacy, and quantitative assessment of regional pulmonary vascular involvement using perfusion imaging may provide a biomarker for further therapeutic insights.
Methods We studied 23 participants with IPF, using dynamic contrast-enhanced MRI (DCE-MRI) and pulmonary function tests, including forced vital capacity (FVC), transfer factor (TLCO) and coefficient (KCO) of the lungs for carbon monoxide. DCE-MRI parametric maps were generated including the full width at half maximum (FWHM) of the bolus transit time through the lungs. Key metrics used were mean (FWHMmean) and heterogeneity (FWHMIQR). Nineteen participants returned at 6 months for repeat assessment.
Results Spearman correlation coefficients were identified between TLCO and FWHMIQR (r=−0.46; p=0.026), KCO and FWHMmean (r=−0.42; p=0.047) and KCO and FWHMIQR (r=−0.51; p=0.013) at baseline. No statistically significant correlations were seen between FVC and DCE-MRI metrics. Follow-up at 6 months demonstrated statistically significant decline in FVC (p=0.040) and KCO (p=0.014), with an increase in FWHMmean (p=0.040), but no significant changes in TLCO (p=0.090) nor FWHMIQR (p=0.821).
Conclusions DCE-MRI first pass perfusion demonstrates correlations with existing physiological gas exchange metrics, suggesting that capillary perfusion deficit (as well as impaired interstitial diffusion) may contribute to gas exchange limitation in IPF. FWHMmean showed a significant increase over a 6-month period and has potential as a quantitative biomarker of pulmonary vascular disease progression in IPF.
- interstitial fibrosis
- idiopathic pulmonary fibrosis
- imaging/CT MRI etc
This is an open access article distributed in accordance with the Creative Commons Attribution Non Commercial (CC BY-NC 4.0) license, which permits others to distribute, remix, adapt, build upon this work non-commercially, and license their derivative works on different terms, provided the original work is properly cited, appropriate credit is given, any changes made indicated, and the use is non-commercial. See: http://creativecommons.org/licenses/by-nc/4.0/.
Statistics from Altmetric.com
Key messages
What is the key question?
Does dynamic contrast-enhanced MRI (DCE-MRI) provides a means of quantifying regional information of pulmonary perfusion in idiopathic pulmonary fibrosis (IPF)?
What is the bottom line?
DCE-MRI first pass perfusion demonstrates correlations with existing physiological gas exchange metrics, shows increased pulmonary transit times in regions of fibrosis and progression over a 6-month time period.
Why read on?
In light of recent trials failing to demonstrate efficacy of pulmonary vasodilator therapy in IPF, DCE-MRI may provide a novel means of phenotyping vascular changes and thus be used to enrich future study populations.
Introduction
Idiopathic pulmonary fibrosis (IPF) is the the most common idiopathic interstitial lung disease, carrying a natural median life expectancy of 2 to 5 years from diagnosis,1 although recent advances in antifibrotic therapy may have somewhat improved the outlook.2 Most patients with IPF listed for lung transplantation exhibit elevated pulmonary arterial pressures, and many patients in the end stages of disease develop fulminant pulmonary hypertension.3 However, more than 60% of the capillary bed is lost before elevated pulmonary arterial pressures are manifest at the time of right heart catheterisation,4 the clinical gold standard of assessment. Recent data from quantitative CT assessment of blood vessel volume density suggests that loss of the small pulmonary vessels may be prognostic in IPF.5 Thus, a means of functionally assessing these changes may provide mechanistic insight into lung pathophysiology and a quantitative means of testing interventions targeted at treating the pulmonary vascular changes in IPF at an earlier stage.
Dynamic contrast-enhanced MRI (DCE-MRI) is clinically used for the functional assessment of perfusion, predominantly in imaging the myocardium,6 brain7 8 and oncological targets.9 10 Literature for imaging the pulmonary circulation with DCE-MRI in a clinical setting has to date largely focussed on pulmonary vascular disease,11 with other studies in disease such as cystic fibrosis and chronic obstructive pulmonary disease generally small and focussed on methodological development.12–14
DCE-MRI tracks the passage of a paramagnetic contrast agent bolus applied via a peripheral vein through the circulation in the organ of interest. In pulmonary imaging, the contrast can be visualised passing through the right atrium and ventricle, into the pulmonary arterial trunk, the pulmonary circulation, then into the left heart and systemic circulation. From the resultant time-resolved images, qualitative inferences of cardiopulmonary vascular haemodynamic processes such as shunting and bronchial circulation can be observed. Moreover, quantitative metrics of regional blood flow, volume and transit time may be generated, allowing regional and global assessment of pulmonary perfusion to be made.
Pulmonary perfusion metrics have prognostic implications in patients with pulmonary arterial hypertension,11 but have undergone little exploration in interstitial lung disease (ILD). There may however be a role for gadolinium-enhanced MRI in the assessment of disease activity.15 Tsuchiya et al reported a relationship between reduced pulmonary blood flow measured using phase-contrast MRI and reduced lung volumes in 27 patients with ILD, but did not discover a relationship with lung physiology, perhaps due to the heterogeneity of the lung diseases analysed.16 Other studies have identified that delayed or late phase contrast (images taken approximately 10 min after administration of intravenous gadolinium) mean signal intensity correlates with structural extent of fibrotic lung disease,17 and may even evaluate early fibrosis in patients with apparently morphologically normal lung.18
Herein, we present first pass perfusion DCE-MRI of the lungs as a means of assessing changes in blood flow through the lung parenchyma of patients with IPF.
Methods
Study subjects
For this prospective, observational study, all participants provided informed written consent. The research was conducted according to the principles of the Declaration of Helsinki. Some participants in this study have been previously reported on in the context of hyperpolarised xenon MRI.19 However, none of the DCE perfusion MRI data in this article has been published elsewhere.
Twenty-three participants with a diagnosis of IPF were recruited through a tertiary interstitial lung disease centre. All diagnoses were clarified against international consensus criteria,1 in a multidisciplinary setting of respiratory physicians and thoracic radiologists. No lung biopsies were necessary in the diagnostic pathway. Participants had no evidence of pulmonary hypertension at baseline, from transthoracic echocardiography using the Bernoulli equation to assess estimated systolic pulmonary artery pressure from tricuspid jet velocity as a standard method of clinical screening.20 Potential participants with stage 4 or 5 chronic kidney disease were excluded prior to enrolment (n=2), due to the reported risk of gadolinium-induced nephrogenic systemic fibrosis in the context of renal failure.21
Study design
Each of the 23 participants underwent a baseline DCE-MRI, between February 2016 and March 2019. Nineteen participants returned for repeat imaging at 6 months (mean 193 days; SD 17.7 days). Four patients withdrew from the study prior to follow-up and subsequently died from respiratory failure. Pulmonary function tests were performed on the same day during both visits.
Imaging and physiology methods
Images were obtained on a 1.5T GE HDx scanner, with an 8-channel thoracic array coil using a three-dimensional spoiled gradient echo time resolved view sharing sequence22 with parallel imaging.23 Pulse sequence parameters included: voxel size 2.4×6.0×10.0 mm3, bandwidth 250 kHz, flip angle 30°, TE 1.1 ms, TR 2.5 ms, frame rate of 2 per s. The imaging temporal resolution ranged from: 0.597 to 0.826 s per whole lung volume (mean±SD = 0.664±0.051 s). Images were taken over 25 s at the end of tidal breathing following a bolus of 0.05mL.kg-1 dose of Gadovist contrast agent (Bayer), injected through a peripherally sited intravenous cannula at a rate of 4mL.s-1 with a 20 mL 0.9% sodium chloride flush.
Pulmonary function tests included spirometry for forced vital capacity (FVC) and the single breath carbon monoxide assessment of gas exchange in the seated position, providing transfer factor (TLCO) and coefficient (KCO) of the lungs. A 10 s single breath-hold manoeuvre was used as per international standards,24 repeated twice to ensure reproducibility.
Analysis
From the resultant MRI images, full width of half-maximum (FWHM) maps of the first pass of perfusion signal enhancement were derived for each voxel within the lung parenchyma. Each voxel demonstrates an upslope in signal, until a peak signal enhancement is seen and a downslope as contrast exits the voxel. The FWHM (s) is taken as the time taken between the point where 50% of maximum signal intensity has been reached on the upslope and downslope as represented in the left panel of figure 1. The FWHM was averaged over the whole lung maps to give a mean value (FWHMmean) and the IQR (FWHMIQR) of the distribution of FWHM was used in order to provide a metric of perfusion heterogeneity.
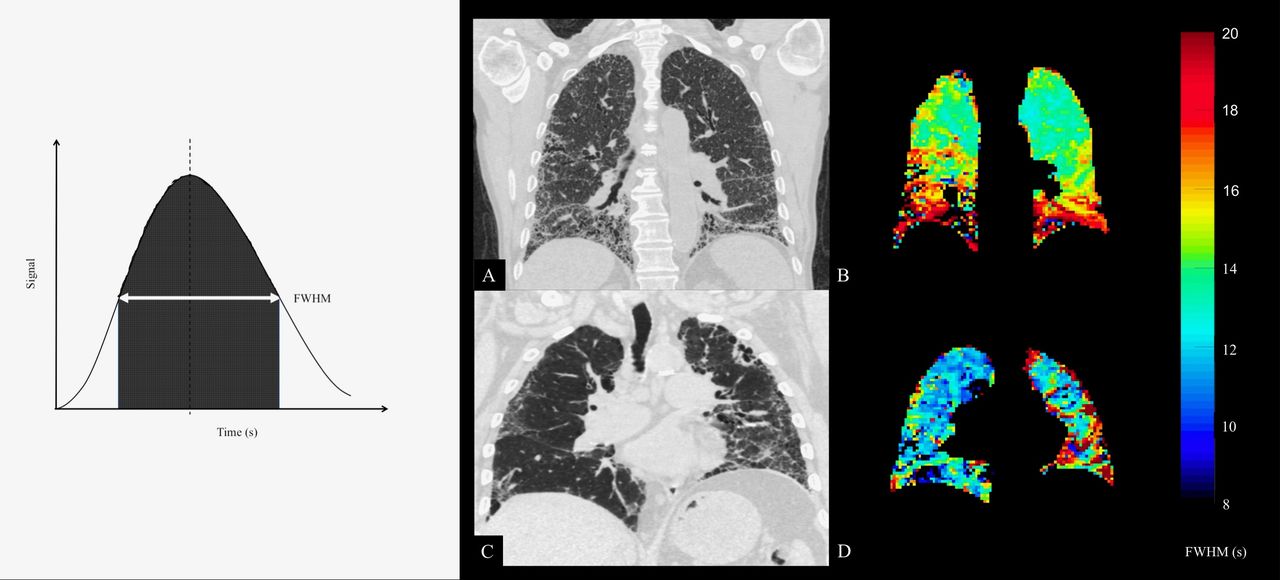
Left panel: Example of signal change through a parenchymal region of interest. The full width at half-maximum (FWHM) signal is often used as a standard threshold for integration. Right panel: CT with best matching coronal slice mean transit time (FWHM) maps derived from dynamic contrast-enhanced MRI from two participants (A+B and C+D). Reticulation and honeycombing on the CT is related to regions of increased transit time in basal and peripheral regions. Colour bar denotes FWHM in seconds.
The parametric maps of FWHM were generated for each participant,25 performed using custom-written code for MATLAB 2016a (The MathWorks, Inc., Natick, Massachusetts, USA), based on equation (2) from Lin et al.25 Each slice was manually segmented from the maximum intensity projection image using ITK-SNAP software.26 The left and right pulmonary veins, pulmonary artery and second generation pulmonary arterial vessels were excluded from the segmentation. Voxels were only included in the FWHM calculation a point existed after the peak signal enhancement which was <50% of this peak value. Any voxels not analysable were set to zero and excluded from whole lung metrics reported.
All gas transfer metrics are studied in SI units, that is, mmol.min-1.kPa-1 for TLCO, or mmol.min-1.kPa-1.L-1 for KCO. Per cent predicted values for both FVC and TLCO pertain to the Global Lung Initiative reference equations.27 28 Strength of correlations between pulmonary function tests, and MRI metrics were assessed by Spearman’s rho. Wilcoxon signed-rank test evaluated the significance of 6-month changes in participants undergoing follow-up. P values stated are two-tailed. Statistical analysis was performed using GraphPad Prism 7 for Mac (GraphPad Software, La Jolla, California, USA).
Post-hoc analyses between participants surviving versus not surviving to 6-month follow-up, as well as participants exceeding versus not exceeding the 95% upper limit of agreement of reproducibility of FWHMmean over 6 months were undertaken using Mann-Whitney U tests. No correction for multiple testing was performed.
Results
All examinations were well tolerated, and no adverse events were reported. Baseline demographic, pulmonary function and DCE-MRI summary metrics are summarised in table 1. As described above, any voxels not analysable were set to zero and excluded from whole lung metrics reported. This resulted in (mean±SD) 80.5%±13.6% of voxels being included over the cohort. Details for each subject are available in the online supplemental material.
Supplemental material
Participant characteristics and baseline data
Reproducibility
During the first study visit, a cohort of six subjects underwent repeat DCE-MRI approximately 2 hours apart. Mean interscan bias in FWHMmean was 0.35 s (95% CI −0.95to 1.66 s), while mean interscan bias in FWHMIQR was 1.05 s (95% CI −3.62to 5.74 s). Bland-Altman plots of repeatability can be found in the online supplement. An example quantitative parametric map of a subject undergoing imaging twice at baseline is provided in figure 2.

Reproducibility of regional full width at half maximum (FWHM). An example of one subject undergoing same day repeat imaging at two time points (A and B). Colour bar denotes FWHM in seconds.
Correlation with baseline pulmonary function tests
No correlation was found between FVC and FWHMmean (r=−0.22; p=0.310; 95% CI −0.59 to 0.22), or FVC and FWHMIQR (r=−0.14; p=0.529; 95% CI −0.53 to 0.30). However, a mild strength of correlation trends were found between TLCO and FWHMmean (r=−0.41; p=0.054; 95% CI −0.71 to 0.02) and also TLCO and FWHMIQR (r=−0.46; p=0.026; 95% CI −0.74 to −0.05). KCO showed mild-to-moderate correlations with both FWHMmean (r=−0.42; p=0.047; 95% CI −0.71 to 0.01) and FWHMIQR (r=−0.51; p=0.013 95% CI −0.77 to −0.11). There was a strong correlation between the two MRI metrics, FWHMmean and FWHMIQR (r=0.77; p<0.001; 95% CI 0.52 to 0.90).
Change over 6 months
Figure 3 demonstrates changes in FVC, TLCO, FWHMmean and FWHMIQR over 6 months in the 19 patients followed up to 6 months. FVC decreased by a median of 2.7% (p=0.040; estimated 95% CI −6.0% to 1.02%). TLCO decreased by a median of 0.05mmol.min-1.kPa-1 (2.9%) (p=0.090; estimated 95% CI −4.86% to 1.02%). KCO decreased by a median of 0.03 mmol.min-1.kPa-1.L-1 (p=0.014; estimated 95% CI −0.06 to 0.00 mmol.min-1.kPa-1.L-1). FWHMmean increased by a median of 1.05 s (p=0.040; estimated 95% CI −0.65 to 3.14 s), whereas FWHMIQR increased by a median of 0.09 s, but was not significant (p=0.821; estimated 95% CI −1.87 to 0.95 s).
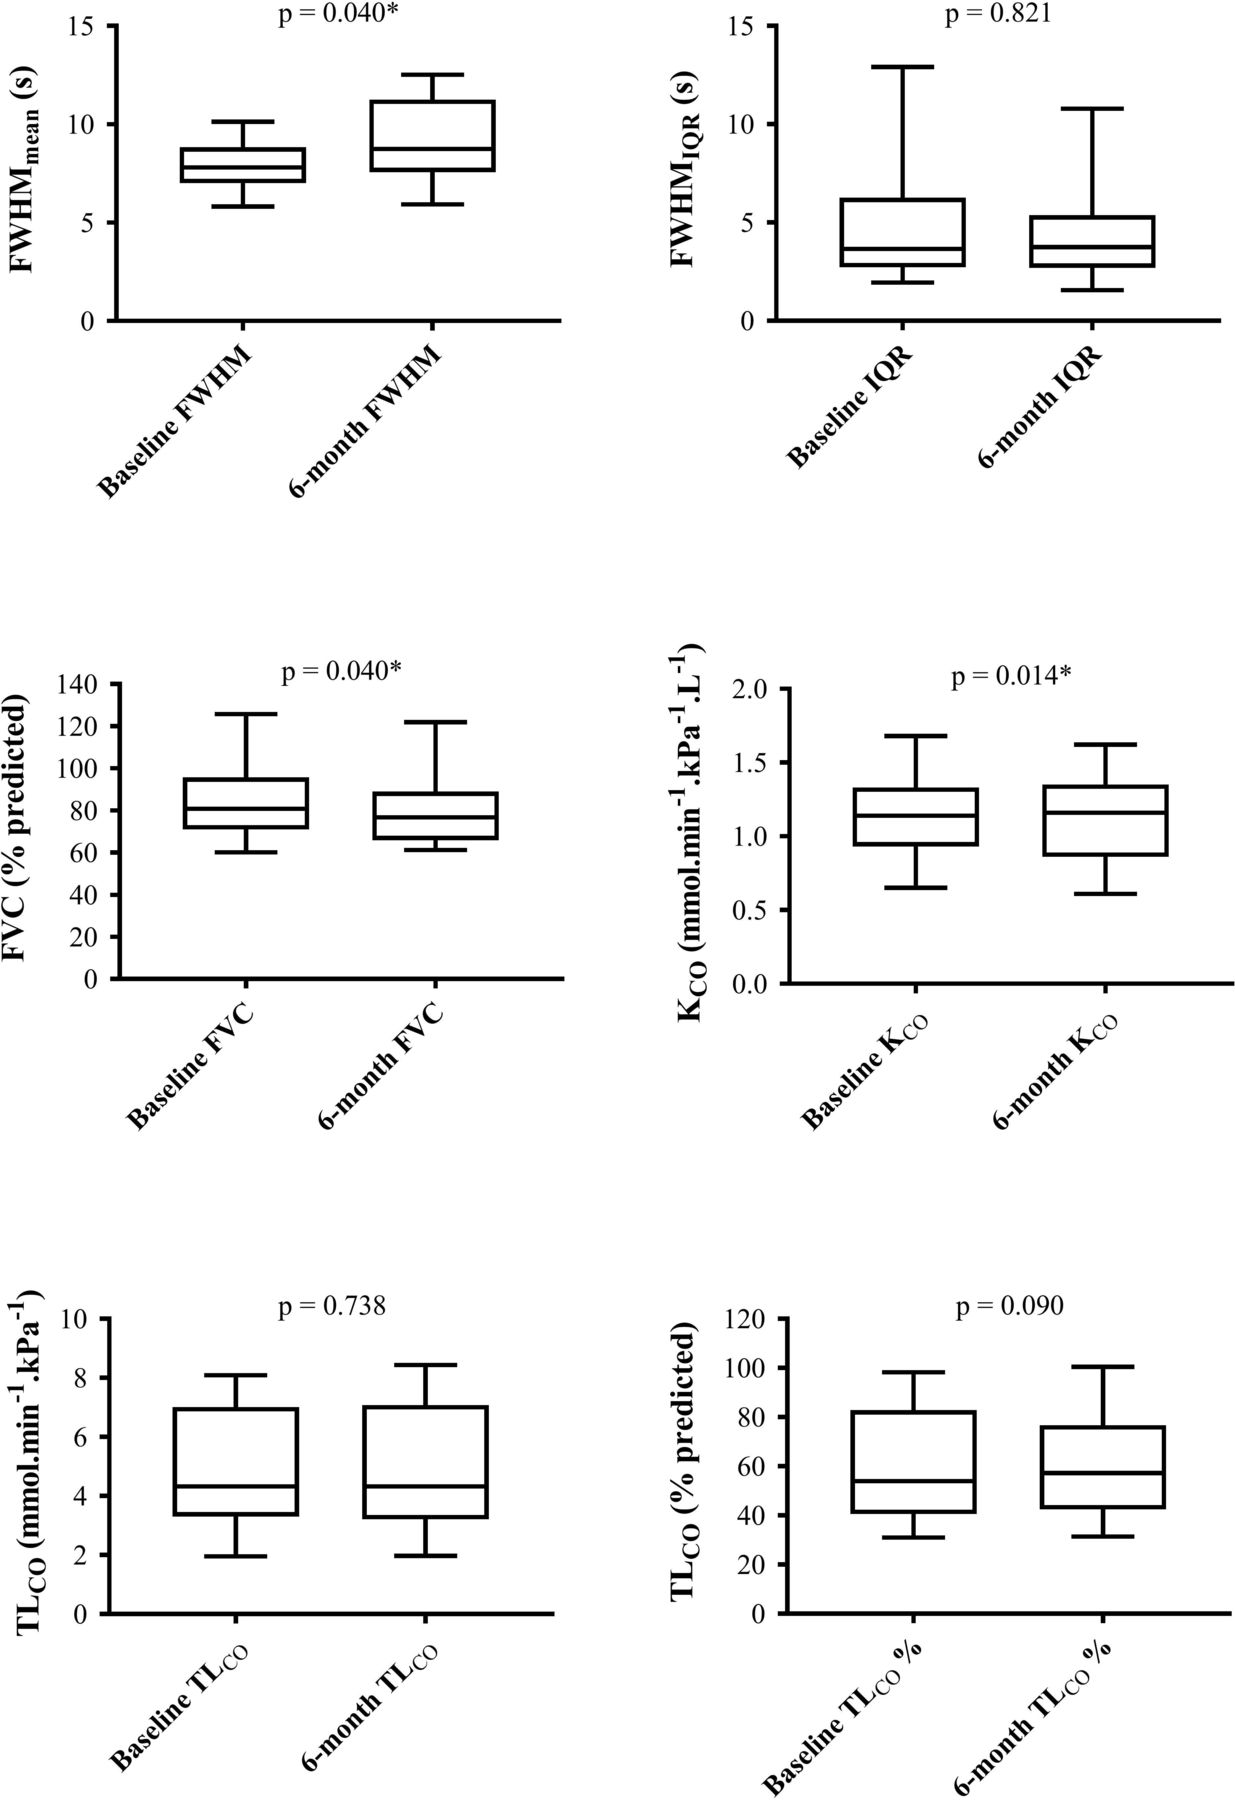
Box and whisker diagrams of baseline and 6-month changes in FWHMmean (A); FWHMIQR (B); FVC % predicted (C); KCO SI units (D); TLCO SI units (E); TLCO % predicted (). Wilcoxon signed-rank p values quoted for each. FVC, forced vital capacity; FWHM, full width at half maximum; FWHMIQR, IQRof the FWHM; FWHMmean, mean FWHM;KCO, diffusingcoefficient of the lungs for carbon monoxide; TLCO, diffusingcapacity of the lungs for carbon monoxide.
There were no statistically significant correlations between 6-month change in any of the pulmonary function tests and FWHMmean, nor FWHMIQR. There was a correlation between 6-month change in FWHMmean and 6-month change in FWHMIQR (r=0.55; p=0.015). All correlations are summarised in table 2.
Summary of correlations between pulmonary function tests and MRI metrics
Qualitative imaging analysis
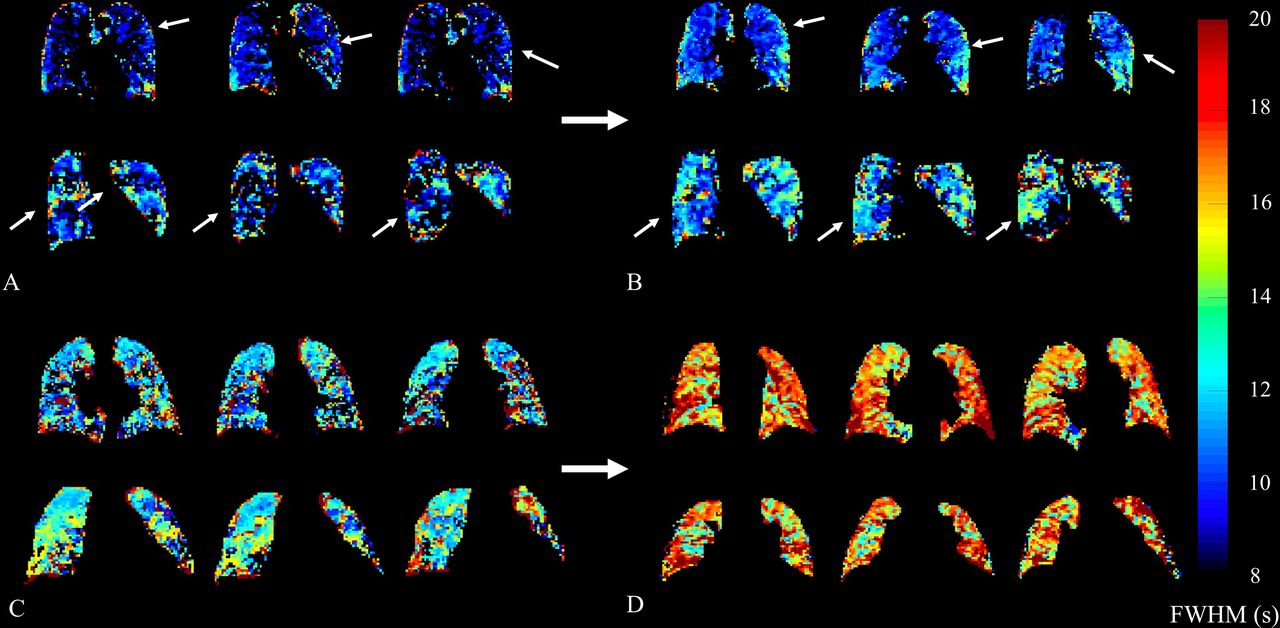
The right panel of figure 1 shows the parametric maps of FWHM to demonstrate the spatial relationship between regions of increased blood transit time and presence of fibrotic lung disease on the accompanying CT coronal image of the same participant. Figure 4 demonstrates progression of transit time across a 6-month time period in two participants.

Representative parametric transit time (FWHM) maps from two participants each with baseline (A and C) and follow up (B and D) scans. Participant 12 (A and B) demonstrates an increase in FWHM in the right lower lobe and left mid-zone peripheral lung tissue. FWHMmean decreased slightly by 0.13 s, with associated changes in FVC from 60.1% to 63.2%, and TLCO from 37.1% to 33.0%, respectively. Participant 18 (C and D) shows a gross overall increase in FWHM, again worse in peripheral lung tissue. FWHMmean increased by 4.35 s, in spite of both FVC and TLCO remaining relatively stable from 76.0% to 74.5%, and from 87.2% to 88.2%, respectively. Colour bar denotes FWHM in seconds. FVC, forced vital capacity; FWHM, full width at half maximum; FWHMmean, mean FWHM;TLCO, diffusingcapacity of the lungs for carbon monoxide.
Post-hoc analysis of subjects exceeding the FWHMmean upper limit of reproducibility
Exploratory analyses were performed on those participants in whom the 6-month increase in FWHMmean exceeded the upper limit of agreement on the Bland-Altman analysis (change >1.66 s) and those who did not meet this threshold (change ≤1.66 s). Herein, these groups are referred to as progressors/non-progressors, respectively, for clarity.
Baseline FWHMmean (median difference −0.73 s; 95% CI −1.55 to 0.95 s) and baseline FVC (−2.22%; 95% CI −14.9 to 20.8%), were lower in FWHMmean progressors versus non-progressors. Baseline TLCO (median difference 20.8%; 95% CI −16.6 to 34.4%) and change in TLCO (median difference 4.4%; 95% CI −5.15 to 5.73%) were higher in FWHMmean progressors versus non-progressors. None of these differences were statistically significant.
Post-hoc analysis of participant survival
Mean FWHMmean and FWHMIQR were compared in a post-hoc analysis between participants surviving to 6-month follow-up (n=19) and non-survivors (n=4). Both the FWHMmean and FWHMIQR were on average higher in the non-survivors (1.10 s and 1.29 s, respectively), although neither was statistically significant (p=0.218; 95% CI −0.77 to 3.71 and p=0.785; 95% CI −1.93 to 6.66, respectively). The small sample size in the non-survivor group should be noted.
Discussion
The transit time of contrast through the lung increases in proportion to worsening gas exchange in our IPF cohort and exhibits a mild strength of non-parametric correlation with established metrics of gas exchange, but not FVC. The FWHMmean of the transit time demonstrates an increase in our sample IPF population over a 6-month follow-up period and the IQR (FWHMIQR) may be a simple means of describing perfusion heterogeneity. Regional increases in transit time, although analysed on a purely qualitative basis in this study, appear to be spatially congruous with the known peripheral and basal distribution of disease in IPF.
Previous literature suggests changes in lung perfusion may represent loss of the vascular bed due to vascular remodelling.29 Histologically, fibrotic regions contain epithelial cells undergoing apoptosis, but also proliferation,30 31 leading to a complex and aberrant vascular network involving anastomoses between alveolar capillaries and pulmonary veins. This disruption of perfusion contributes along with alveolar destruction and septal thickening to gas exchange impairment and thus explain the correlation we see between FWHMIQR and TLCO. Patients with IPF are at increased risk of venous and arterial clot formation,32 leading to suggestions that intramural thrombus in the pulmonary vasculature may also contribute to perfusion limitation in IPF.
Our model assumes that the FWHMmean is a surrogate of transit time of blood through the lung and therefore can represent blood flow; with the FWHMIQR a measure of heterogeneity.11 33 IPF is generally thought of as a disease of the lung parenchyma, rather than a disease of perfusion limitation and while the parenchymal disease leading to diffusion limitation is the significant mechanism that causes changes in TLCO, the accompanying changes in capillary perfusion should also be considered in the understanding of gas exchange in IPF. If DCE-MRI can indeed identify subclinical changes in pulmonary perfusion, this technology may fulfil a clinical need to identify patients with early pulmonary vascular changes, disproportionate to the degree of ILD. Anecdotal observations of clinical improvement of some patients with IPF on sildenafil have been reported and there is biological plausibility of its effect,34 even though a randomised controlled trial of patients with IPF and low TLCO demonstrated no significant difference between subjects on sildenafil or placebo.35
Our findings differ somewhat from the findings of Tsuchiya et al, who used phase contrast MRI to evaluate blood flow within the pulmonary arteries.16 They found no relationship between pulmonary arterial flow and diffusing capacity, although severity quantified by CT was correlated with pulmonary arterial flow.16 Their cohort was a wider population of patients with ILD, some of whom had IPF. Our population had a greater degree of diffusion limitation (although the carbon monoxide gas diffusion coefficient, KCO is not reported in their data) and a relatively better preserved FVC. Moreover, measurement of blood flow in the major pulmonary arteries is a global measurement of pulmonary vascular resistance and while affected by the downstream changes in microvascular blood flow is not a direct measure of capillary perfusion.
Given that much of the capillary bed is lost before elevated pulmonary artery pressures are manifest, a sensitive means of detecting vascular changes earlier in the process may allow clinical trial stratification for those at risk of pulmonary hypertension, or better inform lung transplantation decisions. Such markers may complement other MR sequences used in the assessment of ILD. For example, ultrashort echo time MRI demonstrates improved structural image quality and resolution compared with conventional sequences and also provides a non-ionising alternative to CT and hyperpolarised xenon MRI has the potential to provide longitudinal,19 regional36 metrics of gas exchange.
The use of global measures is however, potentially problematic. It is possible that the increase in FWHMmean over time is representative of progression of another aspect of the disease process, rather than vascular injury. However, the participants with and apparently progressive FWMHmean have a higher baseline TLCO and do not appear more likely to demonstrate progression in TLCO, nor FVC. Qualitatively, regions of increased FWHMmean appear analogous with regions of fibrotic disease on CT, though no quantitative analysis yet exists to support this. Therefore, assessment of the regional correlation of perfusion maps with 129Xe maps of tissue and red blood cell uptake, alongside quantitative regional assessment of CT is a logical next step in regional understanding of gas exchange using multimodal MRI.
The main limitation of this study is that it was conducted in a single-centre and in a relatively small number of participants. However, the statistically significant change seen in FWHMmean at 6 months demonstrates the potential of this approach for assessment of disease progression. Future work to provide description of more quantitative regional changes in other perfusion parameters may provide a means of detecting gradual progression. From a DCE methodological perspective, ongoing work with full quantitative perfusion analysis is being pursued in order to generate associated maps of regional blood flow and blood volume using T1 mapping and arterial input function deconvolution.37–39
Consideration should also be given to the role of anatomical positioning on perfusion. While TLCO is typically measured in the sitting position, MRI is performed supine. This leads to a redistribution of flow from the usually dependant and optimally perfused basal lung tissue to the rest of the lung, which could affect transit times in the bases. However, one would still not expect transit times to be slower in the lung bases than the rest of the lung tissue in health in the supine position as is clearly the case in the example parametric maps provided. This makes the observed qualitative findings of increased basal and peripheral transit time much more likely to be disease related. As is visible in figure 2, there is greater repeated-measurement disagreement in the anterior slices. We propose this is likely due to the presence an anterior-posterior perfusion gradient, caused by blood pooling towards the posterior thorax under gravitational effect while the subject is in a supine position. This reduces the signal from the anterior slices and therefore reduces the signal to noise ratio. The anterior slices also contain a smaller volume of lung tissue, greater increasing the margin of error. The postural gradient and its associated impact on the findings should be considered in future studies.
The participants in our study did not undergo right heart catheterisation, the gold standard assessment for the presence of pulmonary hypertension. However, echocardiography is sensitive in detecting the presence of pulmonary hypertension and is clinically used as a screening tool,40 and as such best represents the investigation that is routinely available in standard clinical practice.
Debate exists around the best technique by which to control for the effects of the respiratory cycle and thus intrathoracic pressure effects on pulmonary perfusion. Here, we have chosen end of tidal breathing to facilitate breath holding and reduce the risk of a Valsalva manoeuvre being performed. Respiratory gating may ensure functional residual volume is met, but is not available in many centres and regardless, the measurement of first pass enhancement requires the participant to perform a breath holding technique to mitigate for the effects of variation in intrathoracic pressures. Further methodological work on the optimal breath-hold technique may therefore be of value in future studies. Interscan reproducibility results may also be affected by slight alteration of the temporal resolution for each case. This was due to the bespoke slice positioning by the MR radiographer on each scan session. This as an experimental limitation that could be avoided with more stringent control of the slice positioning in future work. One possible solution would be to fix the slice coverage to ensure the same inter frame rate between all subjects. Further details of the temporal resolution changes in the six participants who underwent same-day reproducibility imaging are presented in the online supplemental table. One significant consideration is the role of cardiac function in the quantitative metrics of our analysis. While patients with significant cardiac dysfunction were not recruited to this study, in clinical practice, the cardiac function of sexagenarian and septuagenarian population is likely to vary. This may in turn cause changes in global pulmonary flow metrics. Both systolic and diastolic dysfunction are commonly comorbid conditions in this age bracket and future studies may wish to consider including measures of systolic and diastolic cardiac function, either in the form of transthoracic echocardiography, or possibly in the same imaging sitting as the investigative endpoint with cardiac MRI. While the FWHMmean appears relatively repeatable in our small cohort, the FWHMIQR has a significant degree of variability, which may be problematic to its use as a clinical biomarker.
Overall, 80% of voxels returned an analysable result, but this leaves a not insignificant amount of the lung tissue that could not be analysed. The overall reduced perfusion in the IPF lung may induce underestimation bias of the transit time, particularly in the most severely affected disease. Future work on developing the methodology of this approach therefore needs to account for this.
The potential effects of antifibrotic therapy are not accounted for in this study, and some participants commenced antifibrotic therapeutics after the initial baseline study visit, which may therefore affect follow-up results. However, none of these participants were taking pulmonary vasodilator therapy and none were part of the recently reported trial of nintedanib/sildenafil versus nintedanib/placebo.35
In conclusion, DCE lung perfusion MRI is feasible and well-tolerated in a population of participants with IPF. Of the two candidate markers described here, FWHMmean appears to be more reproducible than FWHMIQR. Although there is a paucity of data to determine reliably whether the mean interscan bias of 0.35 s is significant, it appears lower than the mean 6-month change of 1.05 s. Whole lung metrics of transit time correlate to existing metrics of perfusion-limited gas (TLCO) and FWHMmean significantly increases over a 6-month time interval. The regional information contained within the parametric maps may provide a novel means of assessing early perfusion changes in this population in the absence of detectable pulmonary hypertension on echocardiography and future research in this area could focus on quantifying these changes on a regional basis to enhance the sensitivity of this technique for use in early intervention trials.
Acknowledgments
The authors would like to acknowledge the administrative support provided to this study by Leanne Armstrong and Jennifer Rodgers at POLARIS, University of Sheffield, UK. We also thank the National Institute of Health Research (NIHR-RP-R3-12-027), Medical Research Council (MR/M008894/1) and GlaxoSmithKline (BIDS3000032592) for funding.
References
Supplementary materials
Supplementary Data
This web only file has been produced by the BMJ Publishing Group from an electronic file supplied by the author(s) and has not been edited for content.
Footnotes
Twitter @steverenshaw
Contributors Conceptualisation: NDW, PH, SR, SMB, JMW; Methodology: NDW, SR, SMB, JMW; Software: JB, HM, JMW; Formal Analysis: NDW, JAE, PH, HM; Investigation: NDW, JAE, MA, LS, JB; Wrting - original draft: NDW; Writing - review and editing: All authors; Supervision: SR, SMB, JMW; Project Administration: NDW; Funding Acquisition: JMW.
Funding This study is funded by the National Institute of Health Research (NIHR-RP-R3-12-027), Medical Research Council (MR/M008894/1) and GlaxoSmithKline (BIDS3000032592).
Competing interests None declared.
Patient consent for publication Not required.
Ethics approval Ethical approval was given by North West NHS Research Ethics Committee.
Provenance and peer review Not commissioned; externally peer reviewed.
Data availability statement All data relevant to the study are included in the article or uploaded as supplementary information.