Article Text

Abstract
Background Estimation of the risk of malignancy in pulmonary nodules detected by CT is central in clinical management. The use of artificial intelligence (AI) offers an opportunity to improve risk prediction. Here we compare the performance of an AI algorithm, the lung cancer prediction convolutional neural network (LCP-CNN), with that of the Brock University model, recommended in UK guidelines.
Methods A dataset of incidentally detected pulmonary nodules measuring 5–15 mm was collected retrospectively from three UK hospitals for use in a validation study. Ground truth diagnosis for each nodule was based on histology (required for any cancer), resolution, stability or (for pulmonary lymph nodes only) expert opinion. There were 1397 nodules in 1187 patients, of which 234 nodules in 229 (19.3%) patients were cancer. Model discrimination and performance statistics at predefined score thresholds were compared between the Brock model and the LCP-CNN.
Results The area under the curve for LCP-CNN was 89.6% (95% CI 87.6 to 91.5), compared with 86.8% (95% CI 84.3 to 89.1) for the Brock model (p≤0.005). Using the LCP-CNN, we found that 24.5% of nodules scored below the lowest cancer nodule score, compared with 10.9% using the Brock score. Using the predefined thresholds, we found that the LCP-CNN gave one false negative (0.4% of cancers), whereas the Brock model gave six (2.5%), while specificity statistics were similar between the two models.
Conclusion The LCP-CNN score has better discrimination and allows a larger proportion of benign nodules to be identified without missing cancers than the Brock model. This has the potential to substantially reduce the proportion of surveillance CT scans required and thus save significant resources.
- lung cancer
- non-small cell lung cancer
- CT imaging
This is an open access article distributed in accordance with the Creative Commons Attribution Non Commercial (CC BY-NC 4.0) license, which permits others to distribute, remix, adapt, build upon this work non-commercially, and license their derivative works on different terms, provided the original work is properly cited, appropriate credit is given, any changes made indicated, and the use is non-commercial. See: http://creativecommons.org/licenses/by-nc/4.0/.
Statistics from Altmetric.com
Key messages
What is the key question?
Can machine learning employ radiological data to improve prediction of risk of malignancy in pulmonary nodules?
What is the bottom line?
A machine learning-derived artificial intelligence prediction model for risk of malignancy in pulmonary nodules using radiological data alone outperforms the best current multivariable risk prediction model.
Why read on?
A new automated risk prediction model may improve the efficiency of a pulmonary nodule service.
Background
Pulmonary nodules are commonly detected by thoracic CT. The proportion of scans showing nodules varies from 15% to 50%.1 Current guidelines acknowledge the importance of assessing the risk that a nodule is malignant with low risk nodules either having further interval scanning or no follow-up. The two most recent guidelines do not recommend follow-up for nodules<5 mm in maximum diameter1 or optional follow-up for nodules with an average of 6 mm diameter.2 Being able to predict more accurately which nodules are malignant will reduce the cost of extra scanning, the time taken to confirm the diagnosis for the patient and the risk of missing a malignant nodule. It will also allow earlier treatment in very early stage lung cancer, which is known to be associated with improved survival.3
Logistic regression models have been developed to aid risk prediction. The Brock University or PanCan model4 is one of the most accurate in external validations5–7 and is recommended in the British Thoracic Society guideline to decide whether nodules that are 8 mm or more in maximum diameter should be further evaluated with PET-CT.1 None of the commonly used risk models have been derived in UK populations, although the Brock model performed well in one external validation study.7 A concern with using any model in clinical practice is the accuracy of data input into the model; manual measurement of diameter and assessment of spiculation are known to vary considerably in inter-observer studies.2 8 9 There may also be considerable variation between different software packages if the readings are made automatically. An artificial intelligence (AI)-based system can account for nodule size, margins, attenuation and other radiological factors consistently, and without requiring subjective judgement or data entry on the part of the reading radiologist or pulmonologist.
The IDEAL study (Artificial Intelligence and Big Data for Early Lung Cancer Diagnosis) is a two-part study funded by the National Institute for Health Research (NIHR) Invention for Innovation (i4i) that aims to use AI to improve accuracy of prediction of malignancy in pulmonary nodules within a UK clinical setting. The AI system used in this trial was developed by Optellum Ltd, a company which specialises in lung cancer diagnosis through image analysis. A risk prediction model called the Lung Cancer Prediction CNN (LCP-CNN) was constructed using a machine learning algorithm called Convolutional Neural Networks (CNN).10 11 The LCP-CNN was initially trained using the US National Lung Screening Trial (NLST) data12 which had been extensively marked up for machine learning applications within Optellum, under guidance from experienced thoracic radiologists at Oxford University Hospitals (OUH). LCP-CNN development is outside the scope of this paper, but some further details are given in the online supplementary appendix.
Supplemental material
The IDEAL study is in two parts: the first enables validation of the AI method using retrospectively collected incidentally detected data from three NHS hospitals; the second is an ongoing prospective data collection and evaluation study with results anticipated in 2021. A protocol describing part of the prospective trial has been published.13
Validation on UK clinical data is important, because there are significant differences between the training data and a typical UK incidental nodule patient population. Thus, good cross-validation performance on the NLST alone is not enough to guarantee efficacy in real patients. In particular, NLST has a narrow age range (55-74), are all heavy smokers, and have standardised low-dose chest protocols imaged over a decade ago. The IDEAL data is modern, from a population-appropriate mix of smokers and non-smokers, 18–99 years of age, using a wide variety of dose levels and protocols, including the use of contrast agents, and fields of view not optimised for chest viewing (eg, abdominal or cardiac scans in which the visible parenchyma contains a lung nodule). This paper describes the findings from the analysis of the full set of data collected retrospectively under the first part of IDEAL. The primary objective was to assess the diagnostic performance of the LCP-CNN by measuring the area under the receiver operating characteristic curve compared with ground truth diagnoses on the retrospective IDEAL validation set. Secondary objectives were to compare the new model with the Brock model and to evaluate both models for their ability to exclude benign nodules with exceedingly low likelihood of being cancer, allowing early discharge while not missing cancers.
Methods
Data were collected retrospectively under the IDEAL pre-specified protocol from three different clinical sites. Data were enriched to contain at least a 10% cancer prevalence, but all nodule types were included even those that might be assumed to be benign by experienced thoracic radiologists. IDEAL patients were recruited from one of the three trial centres: Oxford University Hospital NHS Foundation Trust (Oxford), Leeds Teaching Hospital NHS Trust (Leeds), and Nottingham University Hospitals NHS Trust (Nottingham). Oxford data contains images from the Oxford University Hospital NHS Foundation Trust, the Royal Berkshire Hospital NHS Foundation Trust and NHS Frimley Health Foundation Trust, shared through the Oxford Academic Health Science Network. Patients were identified either directly by a thoracic radiologist, or through an electronic search of CT chest scans previously performed on patients as part of their routine clinical care in the study sites. The scans were de-identified prior to analysis. Retrospective data collection ran from January 2018 to August 2019.
Inclusion criteria
Male or female, 18 years or above.
Reported as having one or more solid pulmonary nodules of 5–15 mm in maximal axial diameter detected on thoracic CT scan.
CT slice thickness of 3 mm or less.
Exclusion criteria
Patient has more than 5 nodules of at least 5 mm.
Technically inadequate CT scan (too much noise, motion artefact, or insufficient margins imaged on the nodule).
Diagnosis is unknown or could not be established.
Current or prior history of malignancy in the last 5 years.
If patients met inclusion criteria, clinical and radiological information was entered into an electronic data capture system [Castor Electronic Data Capture, Ciwit BV, Amsterdam, The Netherlands, 2018]. For each patient, data included the year and month of birth, sex, smoking status, and known risk factors such as a known history of emphysema and family history of lung cancer. For each nodule, the data collected were size, diagnosis, diagnostic method and presence of spiculation. The patient information was used for calculating Brock model scores for each of the nodules, as well as to offer other opportunities to improve logistic regression models for UK-based populations.13
The diagnosis for each nodule was established using one or more methods. For cancers, all diagnosis was required to be by histology. Benign lesions were defined by 1 year volumetric stability, 2 year diameter stability or resolution. For benign nodules classed as lymph nodes (either perifissural or subpleural), expert opinion by experienced chest radiologists was also accepted as a method of diagnosis.
Nodules were classified as follows:
Primary adenocarcinoma of the lung.
Other primary lung cancer.
Cancer of unknown type.
Benign subpleural lymph node.
Typical benign perifissural lymph node.
Other benign nodule (eg, infection or benign hamartoma).
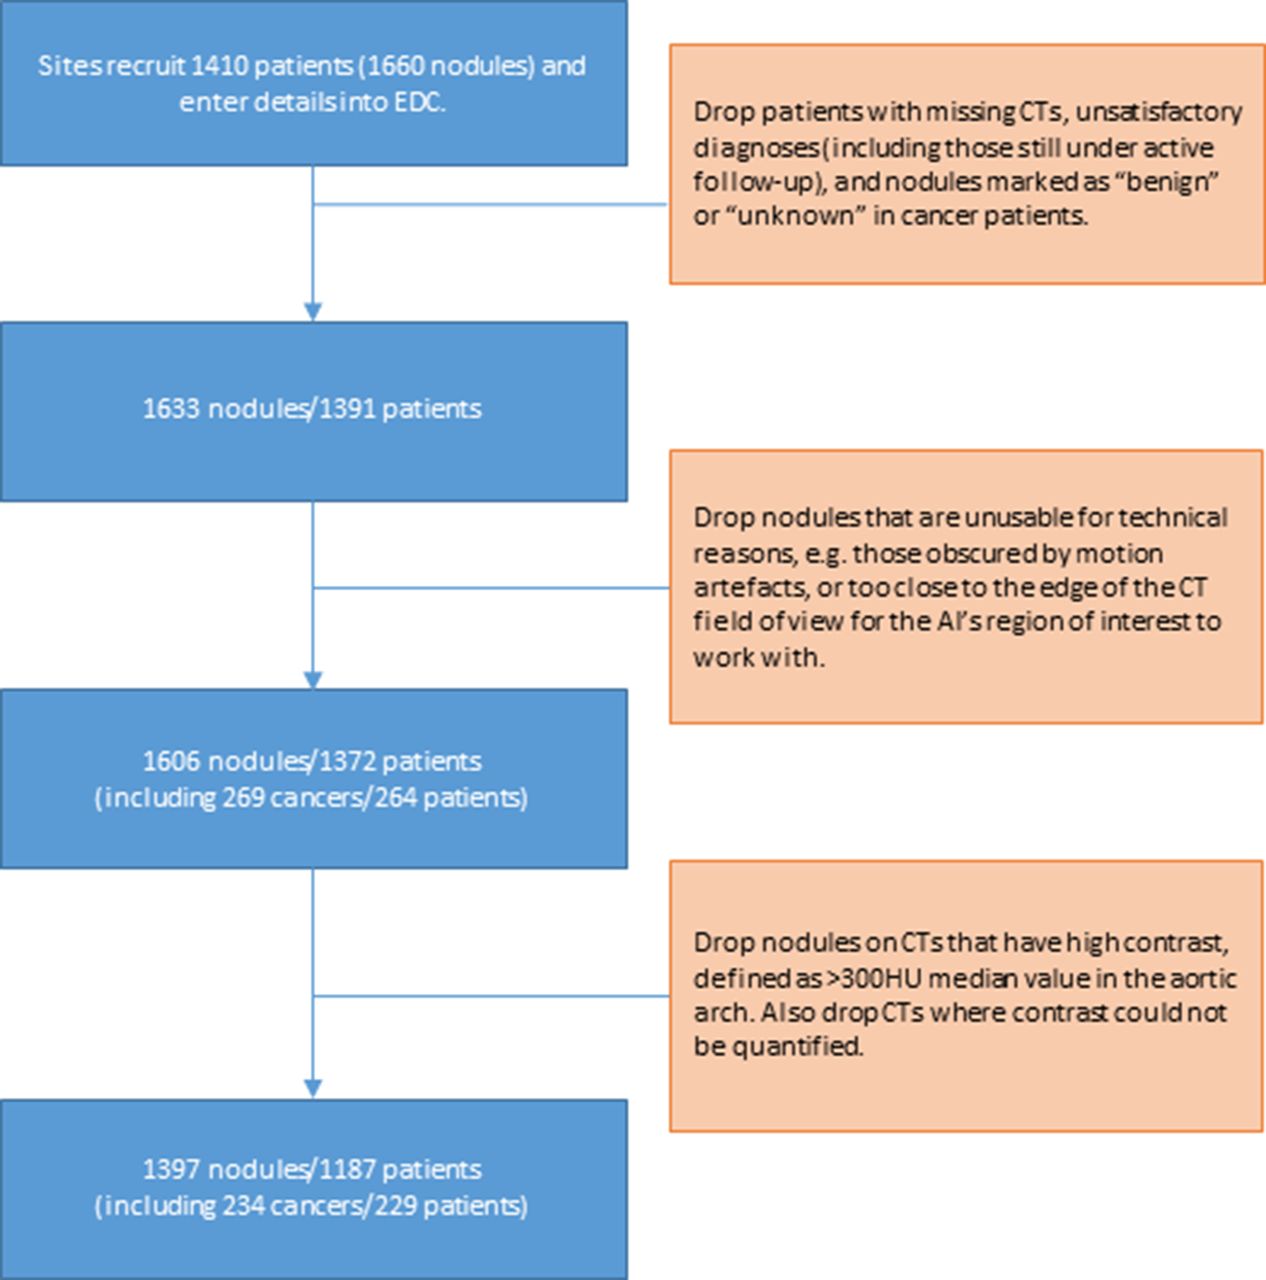
The IDEAL retrospective dataset development process is summarised in figure 1. Clinicians uploaded de-identified CT studies linked to each patient from Castor to the central IDEAL data curation team. The baseline time point for each patient was marked up with a tool to outline and label all nodules relevant to IDEAL. Patients with inconsistent metadata (ie, tagged nodules not in line with Castor entries) were queried with the sites and excluded where necessary. Some annotated nodules were too close to the edge of the field of view of the CT to be able to be captured within the field of view of the AI tool, so 27 nodules (including one cancer) were excluded for this reason. Finally, cases with high levels of contrast were excluded (159 nodules in 136 patients, including 30 cancers in 30 patients), because this has previously been found to lead to false negative results with some small cancers. The final dataset used in this paper consists of 1397 nodules in 1187 patients. Of these, there are 234 cancers in 229 patients. Challenging cases such as those excluded above will receive the current standard of care, rather than AI support, and so do not represent any increase in the risk of missed cancer detections through the application of AI.

Collection of the ideal retrospective dataset. AI, artificial intelligence, EDC, electronic data capture.
table 1 gives an overview of the 1397 nodules and associated clinical factors. the median age of patients was 68 (iqr 60–75), and the median nodule diameter was 7 mm (iqr 6–10 mm). the median cancer nodule diameter was 12 mm (iqr 9–14 mm). 140 (61%) of the cancer patients had cancers that were identified by histology as adenocarcinomas, and the other 89 cancer patients had other primary cancer diagnoses.
Details of nodules and associated clinical data
Application of the LCP-CNN
The LCP-CNN is an AI tool that analyses parts of a CT scan around a nodule of interest and provides a score from 0 to 100 for that nodule. Like the Brock model, this score could be read as a likelihood of malignancy, but also like the Brock model, it is not calibrated to a UK clinical incidental nodule population, so it is not strictly correct to call it a probability of malignancy. For both the Brock model and the LCP-CNN, a higher score indicates a higher chance of malignancy. For reference, a description of the LCP-CNN derivation is given in the online supplementary appendix.
Performance metrics and statistical analysis
We measured efficacy by obtaining the LCP-CNN score for each nodule in the IDEAL retrospective cohort and comparing these to the ground truth diagnosis established as part of data collection. In each case, the reference CT was taken to be the earliest thin-slice CT (<1.5 mm slice spacing) available, and both the LCP-CNN and Brock model scores were calculated only using this single study. To mitigate the effect of excessive levels of contrast where nodules were detected by contrast-enhanced scans, scans were only evaluated if the median attenuation in the aortic arch (measured algorithmically) was 300 HU or lower.
The primary measure is the area under the curve (AUC), which is obtained along with a 95% CI computed using 10 000 bootstraps with stratified sampling.14 AUCs and associated CIs are also computed for the Brock risk model, and directly from the nodule sizes (maximal axial diameter) alone. Note that the AUC is generally invariant to class imbalance (ie, the presence of a lot more benign nodules than cancers in the dataset), because the sensitivity and specificity of the dataset are calculated separately before being plotted against each other. If too large an imbalance occurs, this will still be reflected in a wide 95% CI, showing that more data are required. P-values to assess the significance of differences between the AUC values are also calculated using the same nonparametric bootstrap technique as the CIs.
The secondary endpoint is the sensitivity and specificity of the LCP-CNN estimate at an operating point set by a threshold value computed on the NLST development data. The threshold was chosen separately for the LCP-CNN and the Brock model, such that on a validation set withheld from the NLST training data, the false negative rate was 0%. Assuming that the NLST and IDEAL datasets are similar enough in score distribution, this should translate to measured sensitivity on the IDEAL data close to 100%, and measured specificity that shows what proportion of benign nodules could safely stratify into a ‘do not follow-up’ category for each of the two methods. As long as these sensitivities are high enough (eg, over 99.5%), then a high specificity is important because it reflects the ability of each model to correctly identify patients who may not require follow-up, potentially reducing clinical burden. Because the two risk scores (LCP-CNN and Brock) are not perfectly calibrated with one another (nor with the reference NLST dataset), the thresholds are not exactly in line, with the value for the LCP-CNN being 1.28, and for Brock being 1.17.
Results
The LCP-CNN achieved an AUC of 89.6% (95% CI 87.6 to 91.5), compared with 86.8% (95% CI 84.3 to 89.1) for Brock (p<0.005). While the CI intervals overlap, the P-value itself is significant, and this is because for any dataset, the Brock and LCP-CNN AUCs are highly correlated. On a dataset where the Brock model performs well, the LCP-CNN still performs a few percentage points better, so the chance of sampling a dataset such that the LCP-CNN gives an overall AUC lower than the Brock model’s AUC is significantly small, and this is what the P-value represents. In any case, it is not uncommon for a point estimate to show significance while 95% CIs overlap. The full set of AUCs and 95% CIs for the LCP-CNN, Brock and nodule diameters on the three centres and overall dataset are given in table 2. The associated ROC curves are displayed in figure 2.

Receiver operating characteristic curves for the three centres and the full dataset. For each curve, the distance it follows along the upper horizontal axis is directly related to its ability to rule out benign nodules, and in all plots, the magenta curve for the LCP-CNN dominates that upper part of the plot. The LCP-CNN also approaches the y-axis at a higher sensitivity value than the Brock or diameter curves, indicating that at the high-specificity end (ie, ruling in cancers rather than ruling out benign nodules), the LCP-CNN also offers better stratification than the two simpler methods. AUC, area under the cuve; LCP-CNN, lung cancer prediction convolutional neural network.
AUC results for each of the three centres individually and for the whole dataset overall
Considering the rule-out thresholds, the LCP-CNN had a sensitivity of 99.57 (95% CI 98.62 to 100.00) and a specificity of 28.03 (95% CI 25.51 to 30.62), compared with Brock’s sensitivity of 97.44 (95% CI 95.26 to 99.18) and specificity of 29.23 (95% CI 26.69 to 31.88). The LCP-CNN gave only one false negative (0.4% of cancers), but the Brock model gave six false negatives (2.5%). The sensitivity, specificity, diagnostic likelihood ratio and numbers of true/false positives and negatives are summarised in table 3. Confidence intervals on the number of false negatives follow mathematically from these sensitivities, though for avoidance of rounding errors, the LCP-CNN gives one false negative with 95% CI (0, 3.21), and the Brock model gives six false negatives with 95% CI (1.93, 11.09), p=0.0340. The negative predictive values were 99.69% (95% CI 99.04% to 100%) for the LCP-CNN and 98.27% (95% CI 96.79% to 99.44%) for the Brock model.
Sensitivity and specificity results for the rule-out thresholds
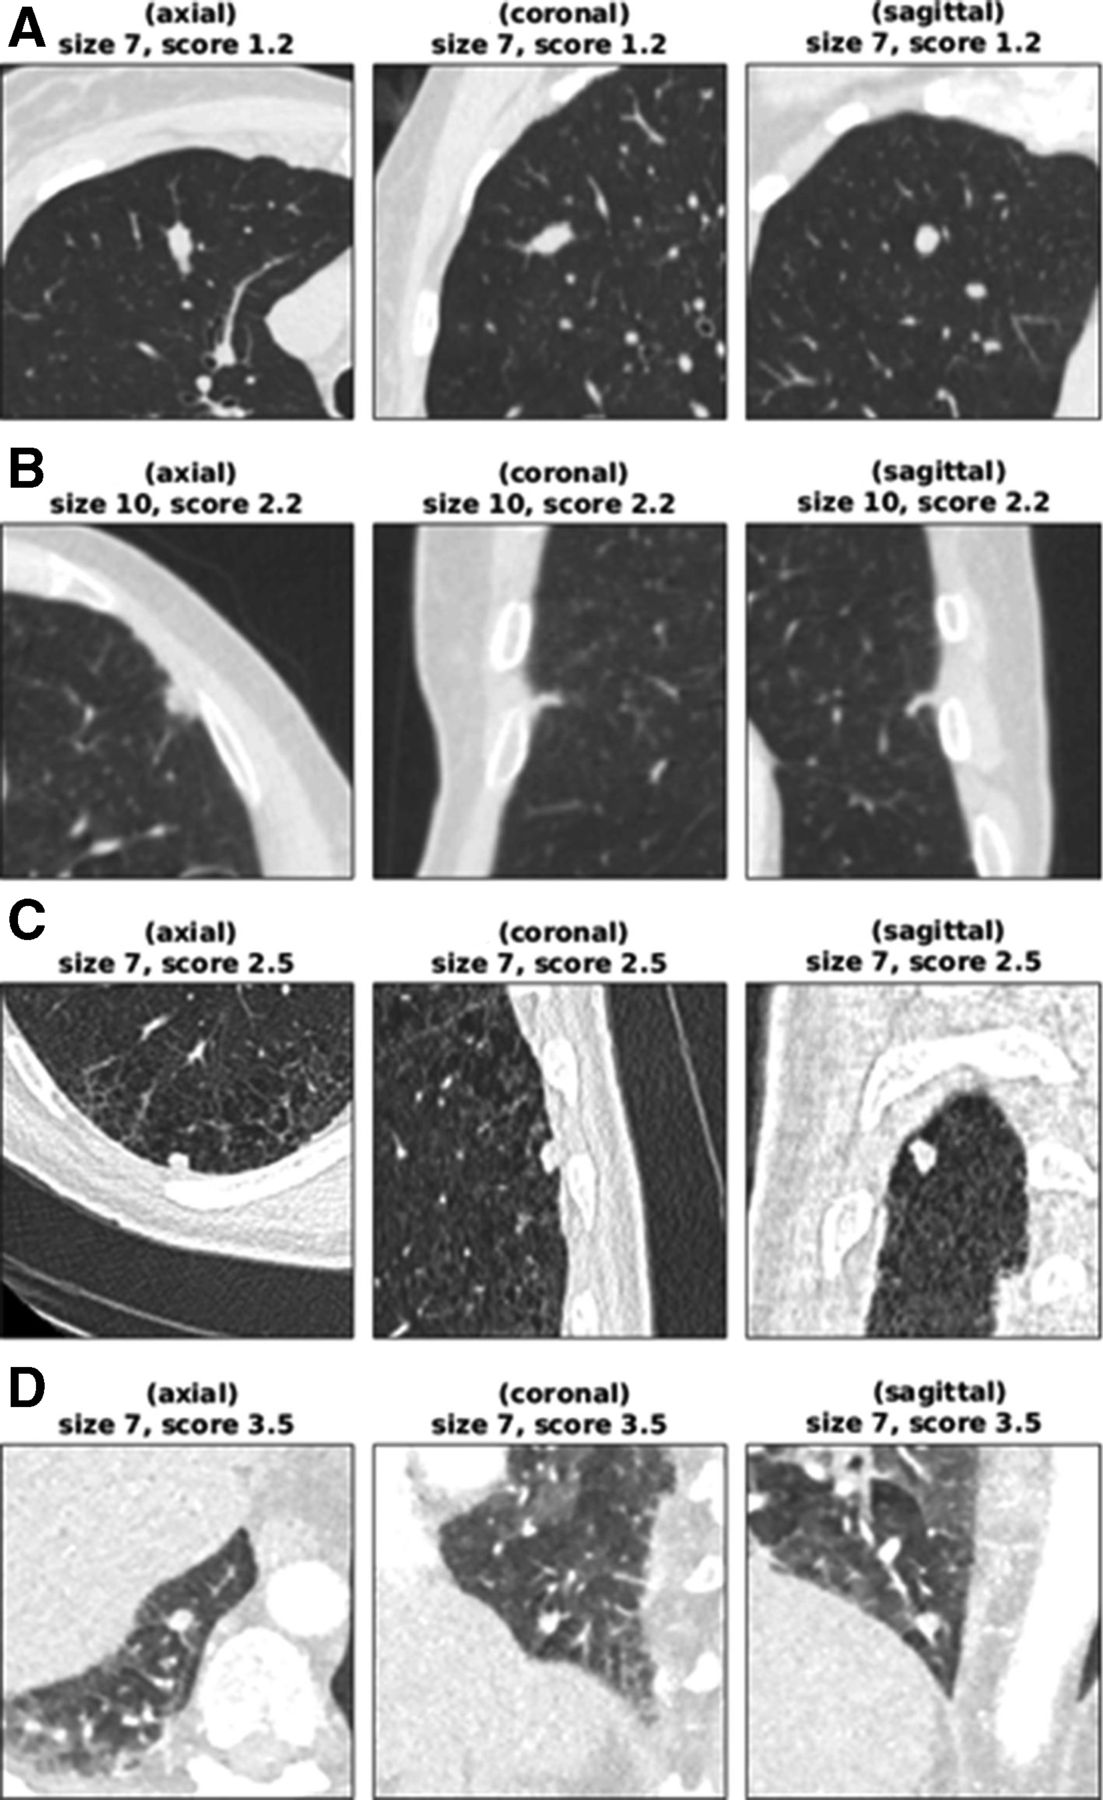
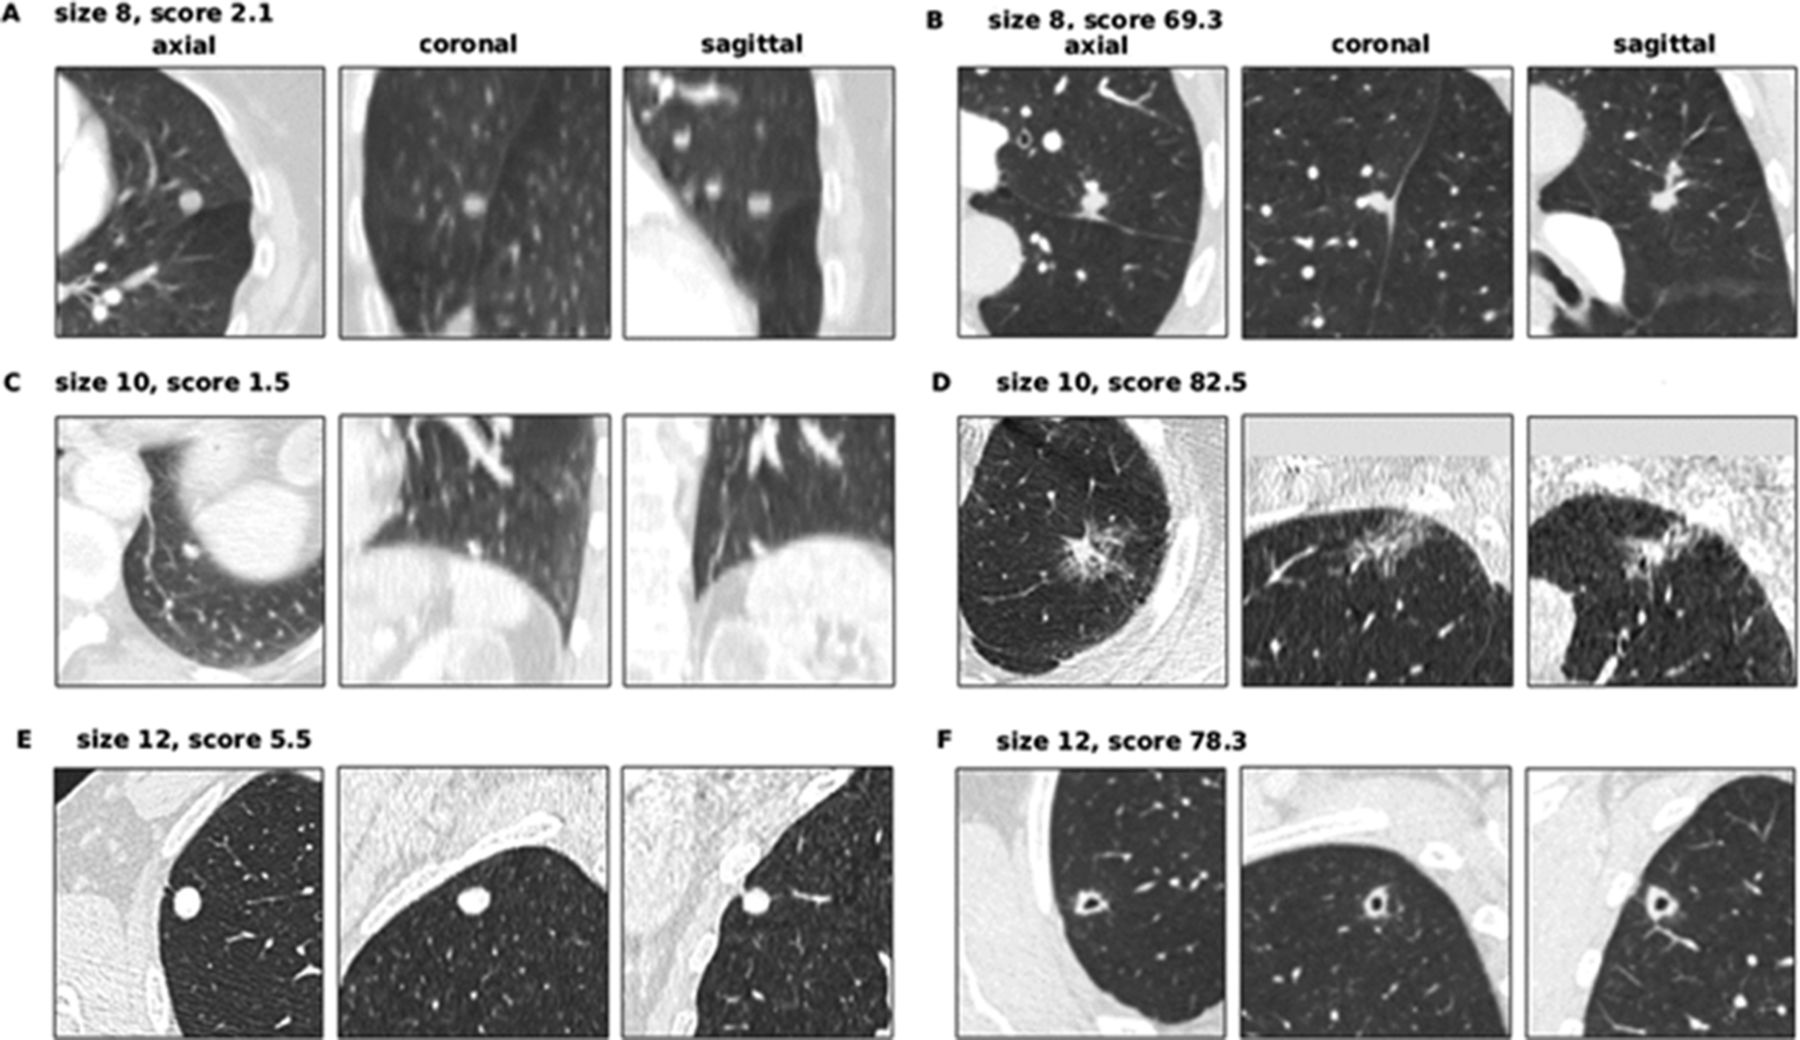
The seven false-negative cancer details are summarised in table 4. These also represent the set of cancers scoring in the bottom 25% of each model’s scores. LCP-CNN had significantly fewer cancers in its bottom 25% of scores than Brock, p<0.0001. Figure 3 shows images from the four lowest-scoring cancers in the overall dataset. Using Brock scores, 146/1337 (10.9%) of benign nodules score below this lowest cancer score. This represents the proportion of benign nodules that could have been safely excluded at 100% sensitivity, had the threshold not been set in advance on independent data. Using LCP-CNN scores, 328/1337 (24.5%) of benign nodules score below the lowest cancer score, suggesting that LCP-CNN has better potential than stratification for separating out benign nodules without including low-scoring cancer nodules. Figure 4 shows both benign and malignant nodules with scores provided by the LCP-CNN and Brock model.

Low-scoring cancer cases. (A) Woman aged 61 years (smoking status: ex-smoker) with a 7 mm cancer located in RUL, scoring 1.19 (Brock=3.50). The median HU value in the aortic arch is 37. (B) Man aged 61 years (smoking status: unknown) with a 10 mm cancer located in the lingula lobe, scoring 2.18 (Brock=5.83). The median HU value in the aortic arch is 135. (C) Man aged 67 years (smoking status: current smoker) with a 7 mm cancer located in RLL, scoring 2.55 (Brock=1.31). The median HU value in the aortic arch is 50. (D) Woman aged 71 years (smoking status: unknown) with a 7 mm cancer located in RLL, scoring 3.46 (Brock=2.26). The median HU value in the aortic arch is 217. CT appears not to be using a breath-hold protocol. The only cancer actually stratified into the ‘rule-out’ set is (A), possibly because of its atypical shape and smooth appearance. The cancer in (B) was not reimaged for another 2 years after this scan, and the patient’s lungs had several similar lesions that did not grow into cancers. For cases such as (D), reimaging the nodule with a standard breath-hold protocol would be expected to give a cleaner image on which the lung cancer prediction convolutional neural network yields a higher score. HU, Hounsfield unit; RLL, right lower lobe; RUL, right upper lobe.

Benign and cancer nodules of 8, 10 and 12 mm illustrating typical scoring behaviour of the LCP-CNN. (A) Woman aged 72 years (smoking status: ex-smoker) with a 8 mm benign nodule located in the lingula lobe, scoring 2.07 (Brock score 9.92). The median HU value in the aortic arch is 246. (B) Woman aged 75 years (smoking status: current) with an 8 mm cancer located in LUL, scoring 69.27 (Brock score 8.20). The median HU value in the aortic arch is 84. (C) Woman aged 77 years (smoking status: unknown) with a 10 mm benign nodule located in the left lower lobe, scoring 1.51 (Brock score 8.47). The median HU value in the aortic arch is 155. (D) Woman aged 83 years (smoking status: ex-smoker) with a 10 mm cancer located in LUL, scoring 82.54 (Brock score 31.49). The median HU value in the aortic arch is 53. (E) Man aged 65 years (smoking status: current) with a 12 mm benign nodule located in RUL, scoring 5.47 (Brock score 16.93). The median HU value in the aortic arch is 39. (F) Man aged 69 years (smoking status: ex-smoker) with a 12 mm cancer located in RUL, scoring 78.29 (Brock score 21.23). The median HU value in the aortic arch is 90. LCP-CNN, lung cancer prediction convolutional neural network. HU, Hounsfield unit; LUL, left upper lobe; RUL, right upper lobe.
Details of incorrectly ruled-out cancers according to the Brock or LCP-CNN models
When typical perifissural nodules and intra-pulmonary lymph nodes, which would not usually warrant follow-up, were excluded from the validation cohort the discriminatory ability of both models reduced. The LCP-CNN still outperformed the Brock model (AUC 86.4% (95% CI 82.2 to 90.3) compared with Brock AUC of 81.1% (95% CI 76.3 to 85.6); p=0.0113). Rule-out rates were also lower for this cohort, but the LCP-CNN still ruled out 16.7% of nodules with only one false negative, and Brock model ruled out 19.3% with six false negatives.
Discussion
In this study, we describe the development and external validation of the LCP-CNN risk prediction model in a retrospectively collected and cancer-enriched UK dataset of nodules restricted to 5–15 mm in maximum diameter. The LCP-CNN was found to outperform the Brock model, which itself represents the most discriminative baseline risk model available. LCP-CNN showed a sensitivity of over 99.5%, which approximates to the 0.5% background risk of cancer in a cohort of nodules in the UK and to that of the NELSON trial.1 15 Although the model was developed from the NLST dataset that only included low dose non-enhanced CT data, it still performed well when applied to CTs that were acquired for diagnostic purposes with a variety of acquisition parameters including administration of intravenous contrast. This is important because any model needs to perform well in a real-life situation and baseline detection of nodules is often via suboptimal CT studies.
Concerns have been raised about the number of nodules which may require surveillance imaging should lung cancer screening be implemented, and the consequent workforce demands (both radiographer and radiologist time) and also CT scanner capacity required for this. When set to a 100% sensitivity we found that Brock could have excluded 10.9% of benign nodules from follow-up and the LCP-CNN 24.5%. Only one of the nodules that LCP-CNN excluded turned out to be malignant (0.4% of cancers) compared with six using the Brock score (2.5%) which suggests that the LCP-CNN model can safely identify low-risk nodules which do not need to be followed up. This represents a potential considerable cost and resource saving using the LCP-CNN. While the difference in sensitivity at around 28% specificity may seem too small to be important, it is approximately a five-fold difference. BTS guidelines effectively set a threshold of 0.5% for discharge of patients because this was the risk in the NELSON population where nodules conferred no extra risk; it was the baseline risk where no nodules were present. The LCP-CNN is able to achieve this stratification at the 28% specificity level.
The LCP-CNN is blind to patient clinical data in the way it is applied in this paper, and yet it still performs better than the Brock risk score. This may be explained by the fact that size and spiculation are already visible to the LCP-CNN, and it is possible that age or parenchymal damage resulting from a 30 pack-year smoking history is already visible to the LCP-CNN as it analyses the CT image, so there may not be much Brock metadata that is not already known to the LCP-CNN. Both models showed better discrimination when tested in the Oxford dataset compared with data from the other centres. It is not clear why this is, but it may have been influenced by the fact that there were fewer cancers in the Oxford dataset and a much larger proportion of nodules (57% vs 16% in Nottingham and 9% in Leeds) were benign lymph nodes, that were both smaller in size and had a characteristic shape. Both the LCP-CNN and the Brock model give low scores in these nodules, increasing the number of nodules that were true negatives. The other two datasets, being more enriched with malignant nodules, may represent a greater number of challenging cases.
Further refinements
Although performing well, the LCP-CNN model may have been disadvantaged by the level of contrast enhancement on some scans. This potential source of error was reduced in the present study and will be in the prospective part of the study, which is now underway. Scans are only evaluated if the median attenuation in the aortic arch (measured algorithmically) is 300 HU or lower.
One common feature on several of the low-scoring cancer cases (including example D in figure 3) was that the CTs came from scan protocols where the patient did not appear to be performing a full inspiration breath-hold, which makes the appearance of such scans qualitatively different from those seen in the training set. It may therefore be appropriate to exclude scans where there is significant breathing artefact, although the extent of this will need to be defined.
The scores from the LCP-CNN are provided on a per-nodule basis. For the purpose of ruling a patient out from follow-up, it may be sufficient just to take the highest-scoring nodule within a patient, since any nodule scoring above the rule-out threshold indicates that the patient should be scheduled for follow-up, if the LCP-CNN were being used as part of the clinical decision-making process. However, the number of nodules within a patient is correlated with malignancy, as can be seen from the coefficient for “number of nodules” in the Brock model, so it may be more appropriate to have a more complex method of combining scores into a single number per patient.
Both Brock and the LCP-CNN are used for baseline assessment of nodules and have not been evaluated for nodule surveillance. Surveillance is somewhat different to baseline assessment because information may be used to both predict malignancy and also the growth rate. The latter is important because it can guide the next diagnostic step. A rapidly growing nodule, if not already identified by a baseline nodule risk model as malignant and requiring a further test such as PET-CT, may require more urgent intervention with biopsy or resection, whereas a slower growing nodule may prompt a more conservative approach. This forms part of nodule management guidelines.1
Using machine learning, we have developed and externally validated a new risk prediction model which compares favourably with the most accurate multivariable model in current usage and may also have a role to play in identifying low-risk nodules which do not need further surveillance. It is important that this model is further refined to include further attention to scan quality and incorporation of additional clinical and CT data. The model is being tested in a prospectively collected cohort in routine clinical practice to establish whether the results seen here are reproducible and what the impact of better risk prediction has on the efficiency of nodule management, timely diagnosis and quality of life for patients.
Footnotes
Contributors DRB drafted and finalised the manuscript with help from LCP, who provided the analysis, including all statistical analyses. The model was trained and internally validated by Optellum authors. All authors read and contributed to the final version. FG is the principal investigator.
Funding This is a summary of independent research funded by the National Institute for Health Research’s i4i Programme, IDEAL: Artificial Intelligence and Big Data for Early Lung Cancer Diagnosis, II-LB-0716-20006.
Disclaimer Views expressed are those of the authors and not necessarily those of the NHS, the National Institute for Health Research or the Department of Health and Social Care.
Competing interests Several members of the authorship are employed by Optellum, the company that has developed the risk prediction artificial intelligence tool.
Patient consent for publication Not required.
Ethics approval The study was approved by the Oxford University Hospitals Research Ethics Committee.
Provenance and peer review Not commissioned; externally peer reviewed.
Data availability statement Data are available upon reasonable request. Pseudomymised data can be requested.
Linked Articles
- Airwaves